6
IT Hardware Management
This chapter will teach you how to work with your IT hardware to positively impact social and environmental aspects and reduce costs.
The main objective of this chapter is to introduce how you can reimagine your approach to managing your IT hardware by exploring different opportunities. You will start by understanding the impact of IT hardware equipment and the most significant environmental impacts during the life cycle. Then, we will look closely at circular IT hardware management and what is required from your IT enterprise and vendors to transition from a linear to a circular economy.
In this chapter, we will cover the following topics:
- Understanding the impact of IT hardware equipment
- Circular IT hardware management
- ITAD – the rise of a new circular industry
- Choosing a sustainable IT hardware provider
The chapter includes a point of view from TCO Certified, the world-leading sustainability certification for IT products, on the importance of social responsibility in circular transition and a case study from Electrolux, the global leader in household appliances, on their journey into IT asset disposition (ITAD) to support their corporate sustainability strategy.
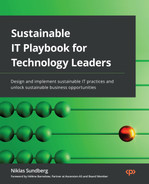
This chapter’s sustainable IT reference model perspective, as illustrated in Figure 6.1, will primarily cover IT hardware life cycle management within the sustainable IT enterprise section and circular waste management within the data center and cloud section. We will look at how these two capabilities can play an integral part in your sustainable IT plan to reduce greenhouse gas (GHG) emissions and e-waste while positively impacting society:
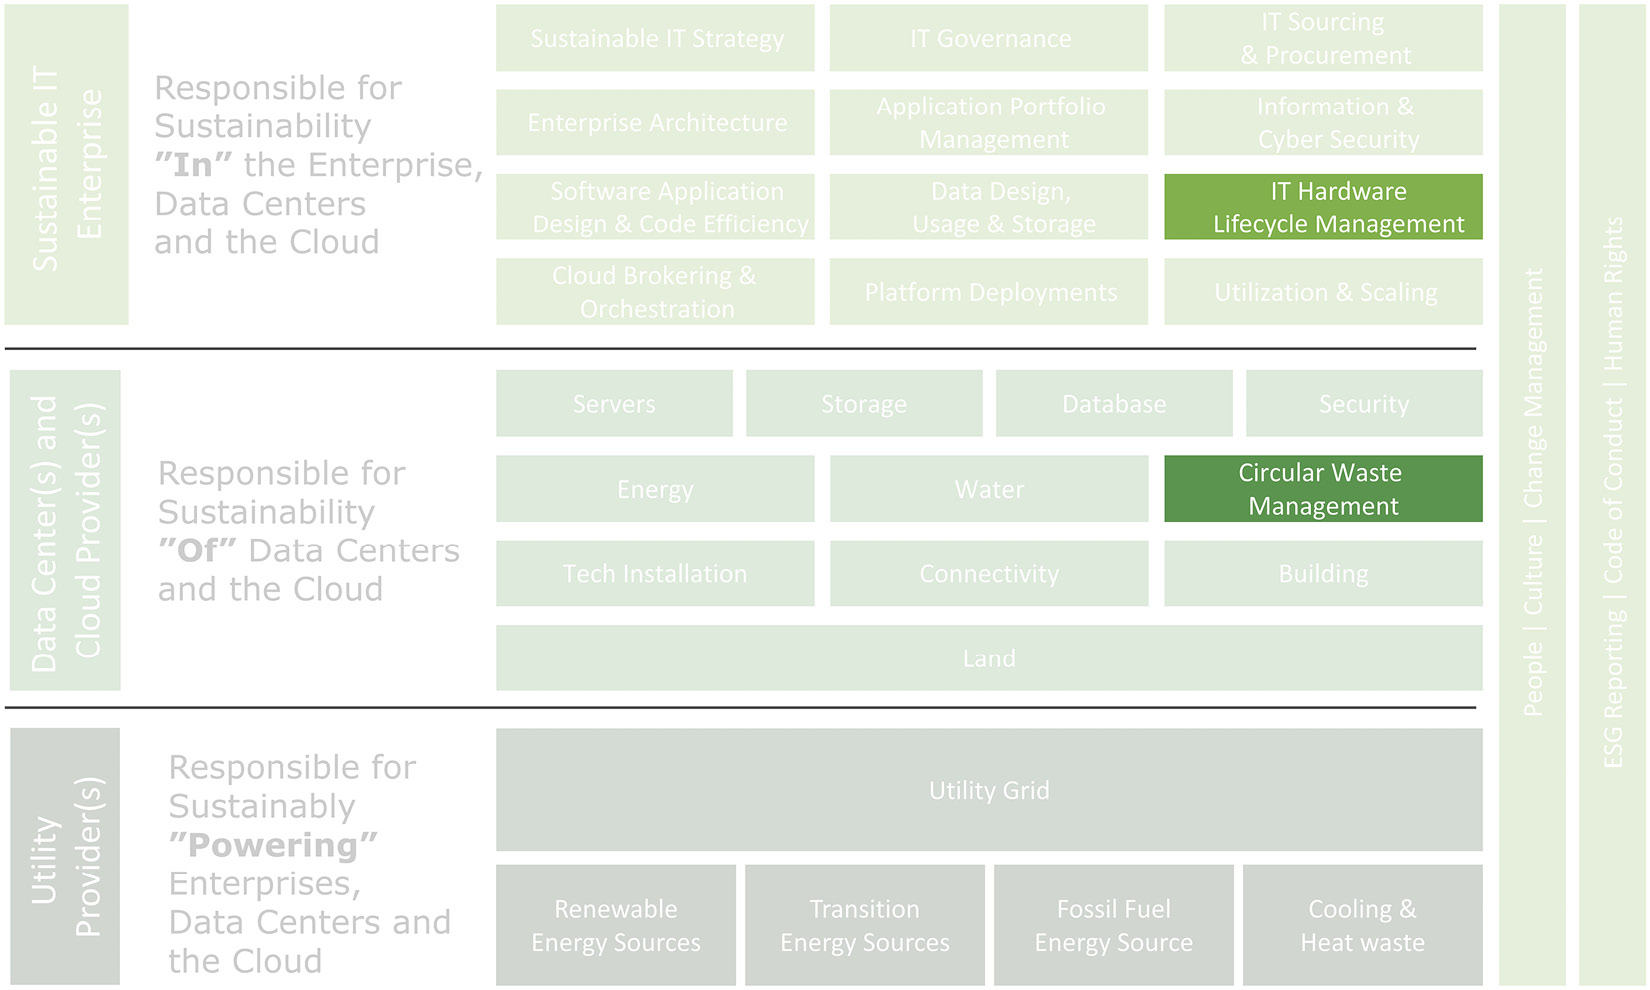
Figure 6.1 – Sustainable IT reference model – Chapter 6 focus
By the end of this chapter, you will have learned how to work with your IT hardware to positively impact social and environmental aspects and reduce costs. As an introduction to the topic, you will learn how you can reimagine your approach to managing your IT hardware by exploring different opportunities. You will also have a better understanding of the impact of IT hardware equipment and the most significant environmental impacts during the life cycle. Finally, you will understand circular IT hardware management and what is required from your IT enterprise and your vendors to transition from a linear to a circular economy.
Understanding the impact of IT hardware equipment
IT hardware from servers, network equipment, computers, monitors, tablets, and smartphones that an enterprise or organization uses significantly impacts your Scope 2 (energy consumption) and Scope 3 (material use) greenhouse gas emissions throughout the whole life cycle, especially during production and disposal. The extraction of raw materials, such as rare-earth metals and other materials needed in the manufacturing process when creating this equipment, can result in loss of biodiversity, depletion of finite resources, and generates enormous volumes of toxic waste. This also generates social inequalities related to using forced labor in some countries to obtain such rare metals. In many cases, finite resources such as lithium are used to manufacture smartphones and batteries (ISWA 2020). Overall, estimates indicate that producing these nearly equals or exceeds the carbon cost of using them (European Environmental Bureau 2019). The current geopolitical situation also adds to the business case beyond carbon cost. A large proportion of lithium comes from China and is processed in China or Russia. The current restrictions and geopolitical situation can become a tremendous weakness.
Unfortunately, the IT hardware life cycle process tends to be linear rather than circular. Applying a circular approach to managing IT hardware is an excellent unlock toward carbon neutrality by focusing on extending product lifetime and recirculating all materials without producing any waste. Switching from a linear to a circular economy requires our supply chains to use minimal virgin material and produce zero waste. My previous employer, Gartner, predicts that within a decade, in the 2030s, the circular economy will be the only economy:
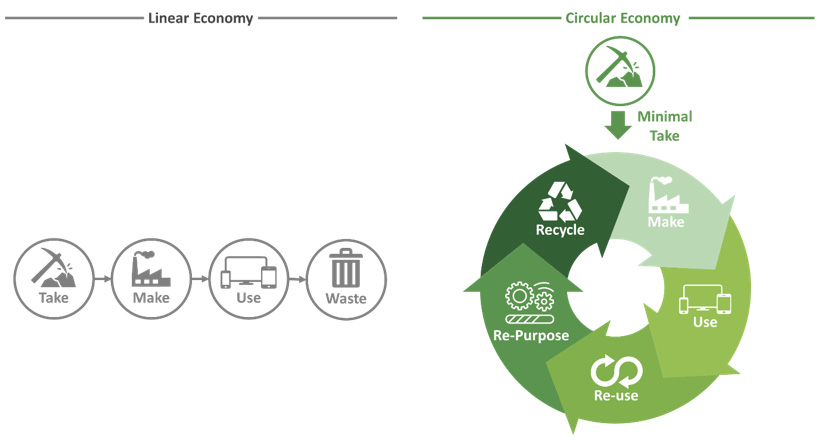
Figure 6.2 – From a linear to a circular economy
As highlighted in Chapter 1, Our Most Significant Challenge Ahead, the circular economy is a design paradigm that aims to eliminate waste as a phenomenon. All products, processes, and business models are designed more innovatively from the beginning so that all products can be used and maintained for longer, reused, and refurbished, if possible. When the day comes when you can no longer use the product anymore, you should be able to disassemble the products into closed cycles, where technical material is either repurposed or recycled in technical cycles and biodegradable material in biological cycles.
Converting all the material flows of the world in circularity is a critical enabler because it is an illusion that we can throw something away. Instead, we practically throw the garbage at ourselves and each other, either in physical form, in particulate form, or in the form of chemicals (Carlsson 2021).
The most significant environmental impacts during their life cycle can be divided into five categories:
- Product design and manufacturing
- Product lifetime expansion
- Energy consumption
- Finite resources and hazardous substances
- End-of-life management
Let us look closer at each of these categories.
Product design and manufacturing
The most crucial concept in the circular economy is design for disassembly. This means that everything is designed with excellent care so that all components and materials can be easily disassembled from each other. In the circular economy, for example, you do not want to mix materials in a way that makes them difficult to separate. Nor do you want to use forms of glue or other joining methods that make it difficult to separate the components from each other, but instead join them, for example, in various sophisticated ways, allowing the components to be clicked into each other. The design phase is crucial for creating possibilities for how to reuse the object later. It is estimated that approximately 80% of a product’s environmental impact is determined in the design phase (European Union 2022). This usually translates into roughly 80% of the greenhouse gas emissions of a product’s life cycle having already been spent before you receive a new notebook or smartphone in your hand in the manufacturing process. Therefore, it is critical to eco-design your products to reduce the environmental impact of your products, not only in the manufacturing process but including the energy consumption throughout their entire life cycle.
An electronic product follows the same life cycle from the cradle to the grave. The life cycle can be divided into five categories: take (extract raw materials/source materials), make, logistics (package and ship), use, and recover. This is more commonly known as embodied carbon – the amount of carbon pollution emitted during a product’s life cycle from creation to disposal. In addition to the embodied carbon, you also have the carbon emission from powering the device with electricity during the use phase. The environmental impact from your embodied carbon and your electricity depends on your energy mix’s carbon intensity: the more renewable energy used, the less the environmental impacts.
An environmentally and socially responsible supply chain approach must be applied throughout the process of extracting raw materials, sourcing components, and manufacturing. Controls must be in place to ensure supply chain transparency, suitable working environments, anti-bribery, energy efficiency, responsible chemical management, and responsible use of sourced materials (minerals, rare-earth metals, plastics, and so on).
The following two sub-sections will closely examine the life cycle assessment (LCA) of two IT Hardware categories: end user and server equipment. Your spontaneous reaction might be that they do not differ much, but their LCA profiles are quite different.
End user hardware life cycle assessment
Let us compare three specific end-user products – a notebook, tablet, and smartphone – from different vendors. Let us start with a notebook. The following diagram compares three similar notebooks from three different hardware vendors – Dell, HP, and Lenovo. All three products are TCO Certified:
Figure 6.3 – Notebook product CO2 life cycle emission comparison
Based on the LCA provided by the three vendors, the overall emissions can differ significantly. A Dell Latitude 7420 emits 341 ± 81 kgCO2e (Dell Latitude 7420 2021), an HP EliteBook 830 6th Generation (HP 2019) emits 292 ± 71 kgCO2e, and a Lenovo ThinkPad X1 Yoga 4th Generation (Lenovo 2019) emits 449 ± 89 kgCO2e all three based on an expected lifetime of 4 years.
Let us look at each of these devices in a bit more detail.
The notebook Latitude 7420 from Dell emits 341 kgCO2e ± 81 kgCO2e over an expected product lifetime of 4 years. Manufacturing represents 85.9% of total emissions, transportation 3.3%, end of life < 1%, and usage 10.6% (Dell Latitude 7420 2021). According to TCO Certified, the product contains 10.4% recycled plastics, the Typical Energy Consumption (TEC) per year is 15.3 kWh, and the TEC max is 33.9 kWh (TCO Certified 2022).
The notebook EliteBook 830 6th Gen from HP emits 292 kgCO2e ± 71 kgCO2e over an expected product lifetime of 4 years. Manufacturing represents 80% of total emissions, transportation 9%, end of life < 1%, and usage 11% (HP 2019). According to TCO Certified, the product contains 32.77% recycled plastics, the TEC per year is 25.1 kWh, and the TEC max is 42.8 kWh (TCO Certified 2022).
The notebook ThinkPad X1, Yoga 4th Gen from Lenovo emits 449 kgCO2e ± 89 kgCO2e over an expected product lifetime of 4 years. Manufacturing represents 82% of total emissions, transportation 5%, end of life < 1%, and usage 13% (Lenovo 2019). According to TCO Certified, the product contains 10.4% recycled plastics, the TEC per year is 11.6 kWh, and the TEC max is 34.5 kWh (TCO Certified 2022).
It is worth noting that the EliteBook 830 from HP contains 32.77% recycled plastics, whereas the ThinkPad X1 Yoga only contains 10.4% recycled plastics. Let us compare the carbon emissions for each notebook over a year. We find the number of kilograms (kg) of CO2 emissions per year by multiplying the TEC per year by the global average carbon intensity of 0.475 KgCO2/kWh. Doing the calculations, we find that the yearly CO2 emissions for Lenovo ThinkPad X1 Yoga Gen 4 are 5.5 kilograms (kg) (12.13 pounds), Dell Latitude 7420 7.3 kg (16.09 pounds), and the HP EliteBook 830 6th Gen 11.9 kg (26.24 pounds). Due to the difference in TEC, the carbon emissions are more than twice as much for the HP EliteBook 6th Gen as opposed to the Lenovo ThinkPad X1 4th Gen. We will look closer into the carbon emissions for energy consumption in Chapter 7, Energy Resource Management.
Now, let us take a closer look at the tablet product category. The following diagram compares three similar tablets from three different hardware vendors – Microsoft, Apple, and Lenovo:
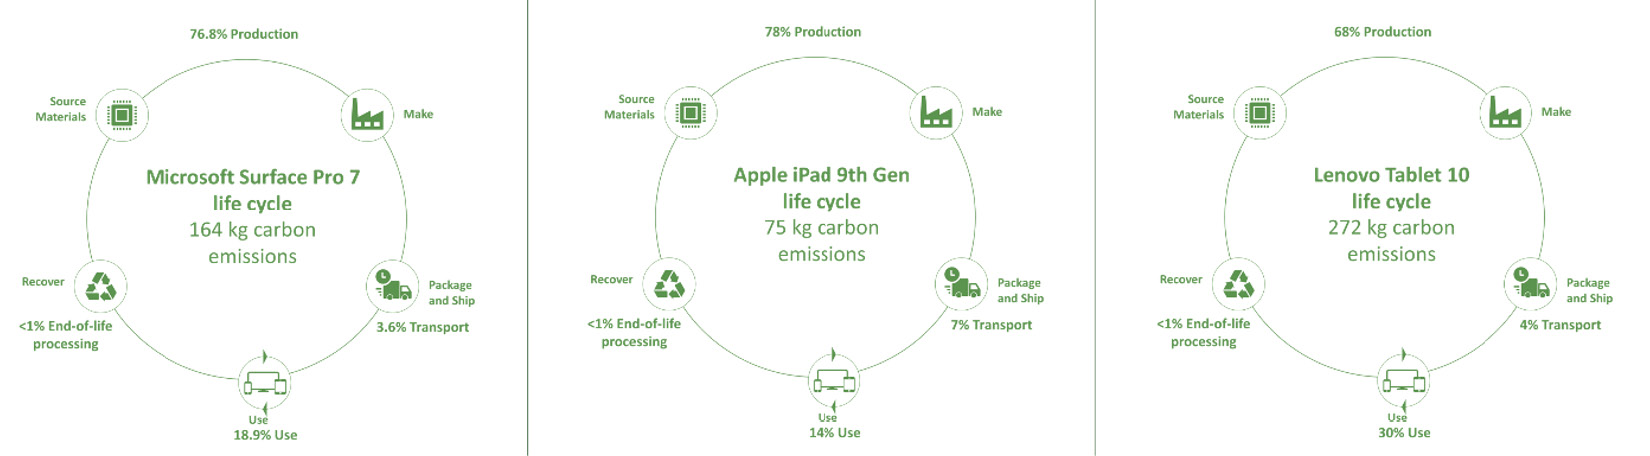
Figure 6.4 – Tablet product CO2 life cycle emission comparison
Based on the LCA provided by the three vendors, we can see that the overall emissions can differ up to 3 times between the vendors. A Microsoft Surface Pro 7 emits 164 kgCO2e (Microsoft 2022), an Apple iPad 9th Gen emits 75 kgCO2e (Apple 2021), and a Lenovo Tablet 10 emits 272 kgCO2e (Lenovo 2018), all three of which are based on an expected lifetime of 3 years.
Finally, let us take a closer look at the smartphone product category. The five biggest smartphone brands as of Q4 2021, in the order of market share in brackets, are Samsung (24%), Apple (18%), Xiaomi (13%), Oppo (10%), and Vivo (8%), whereas other brands constitute a 27% share of the global smartphone market (TimesofIndia.com 2022). However, regarding the availability of a reliable Product Carbon Footprint (PCF) from the vendors, the availability of reliable data points is scarce. At the time of writing, only Apple and Fairphone have provided detailed LCA assessment product data sheets. Fairphone is one of the few smartphone vendors that are TCO Certified and is the only vendor to hold a platinum Ecovadis medal and is a Blue Angel certified smartphone (Fairphone 2022). Samsung, the world’s largest supplier of smartphones, does have an LCA for mobile products. Still, it only includes material use and no estimation of carbon emissions (Samsung 2018). It is also quite outdated; the latest LCA is from 2018. Therefore, the following diagram only illustrates a comparison between Apple and Fairphone:
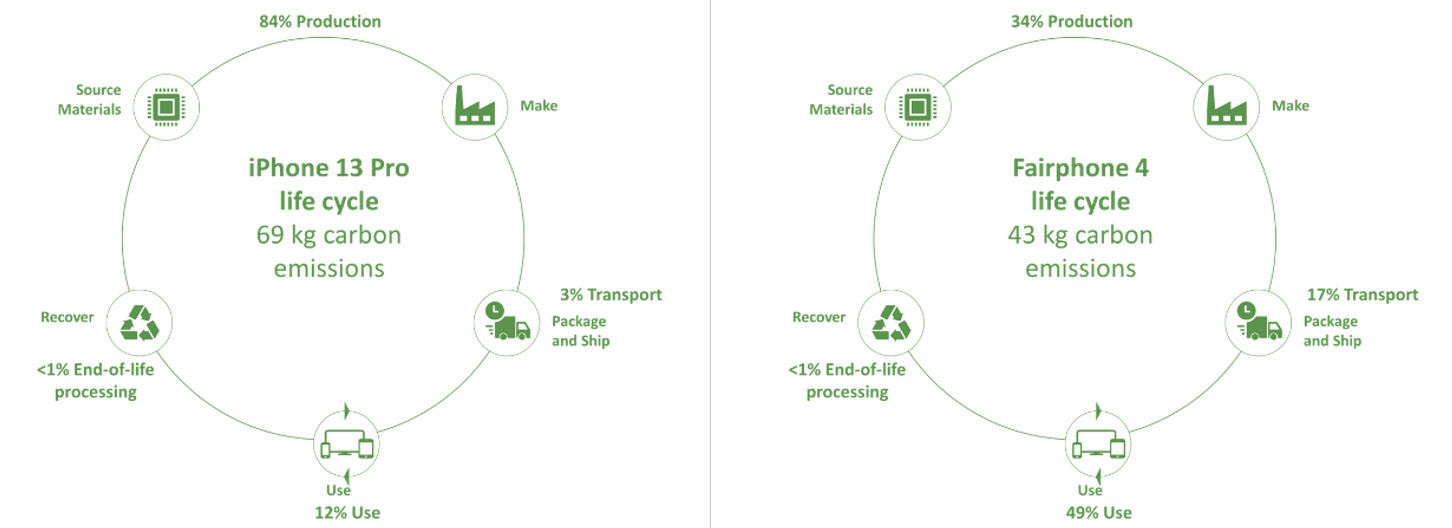
Figure 6.5 – Smartphone product CO2 life cycle emission comparison
Based on the LCA provided by Apple and Fairphone, an Apple iPhone 13 emits 69 kgCO2e (Apple 2020), while a Fairphone 4 emits 43 kgCO2e (Fairphone 2022) based on an expected lifetime of 3 years. Fairphone has almost half the carbon emissions over a life cycle due to the number of recycled materials in a Fairphone, such as rare-earth metals in several components, 100% recycled tin, and the back cover is made from 100% recycled plastics.
Sustainably designed phones by Fairphone
One of the major criticisms for smartphone manufacturers has been the product’s longevity, especially the battery’s shelf-life and the inability to replace damaged components easily. Netherlands-based phone manufacturer, Fairphone, has sought to change the industry from the inside. Fairphone offers a small range of sustainably designed phones whose materials are sustainably sourced and whose modular components allow them to be easily repaired, increasing their longevity. With Fairphone, the idea is simple. Building smartphones that last with a modular design makes it easy for an end user to replace a battery, display, ports, cameras, and speakers at an affordable cost. Fairphone has been labeled the most ethical, repairable smartphone you can buy. Read more at https://www.fairphone.com/en/impact/?ref=header.
Now that we have looked at the carbon emission impact from a few categories, let us look at a concrete example from a typical global manufacturing company.
End user hardware impact at scale
Let us look at the greenhouse gas (GHG) emission impact at the scale of a typical global manufacturing company with 60,000 employees, where 60% – that is, 36,000 employees – have a designated computer. The current life cycle hardware policy is 4 years, equivalent to the vendor warranty period. This means that 9,000 computers – a quarter of the computer estate – are replaced annually. No recycling or refurbishment has been considered. The assumption is that the employment growth is 10% per annum. For simplicity, we have chosen Dell Latitude 7420 as the model computer issued to all employees. The following diagram illustrates the projected GHG emissions over 10 years:
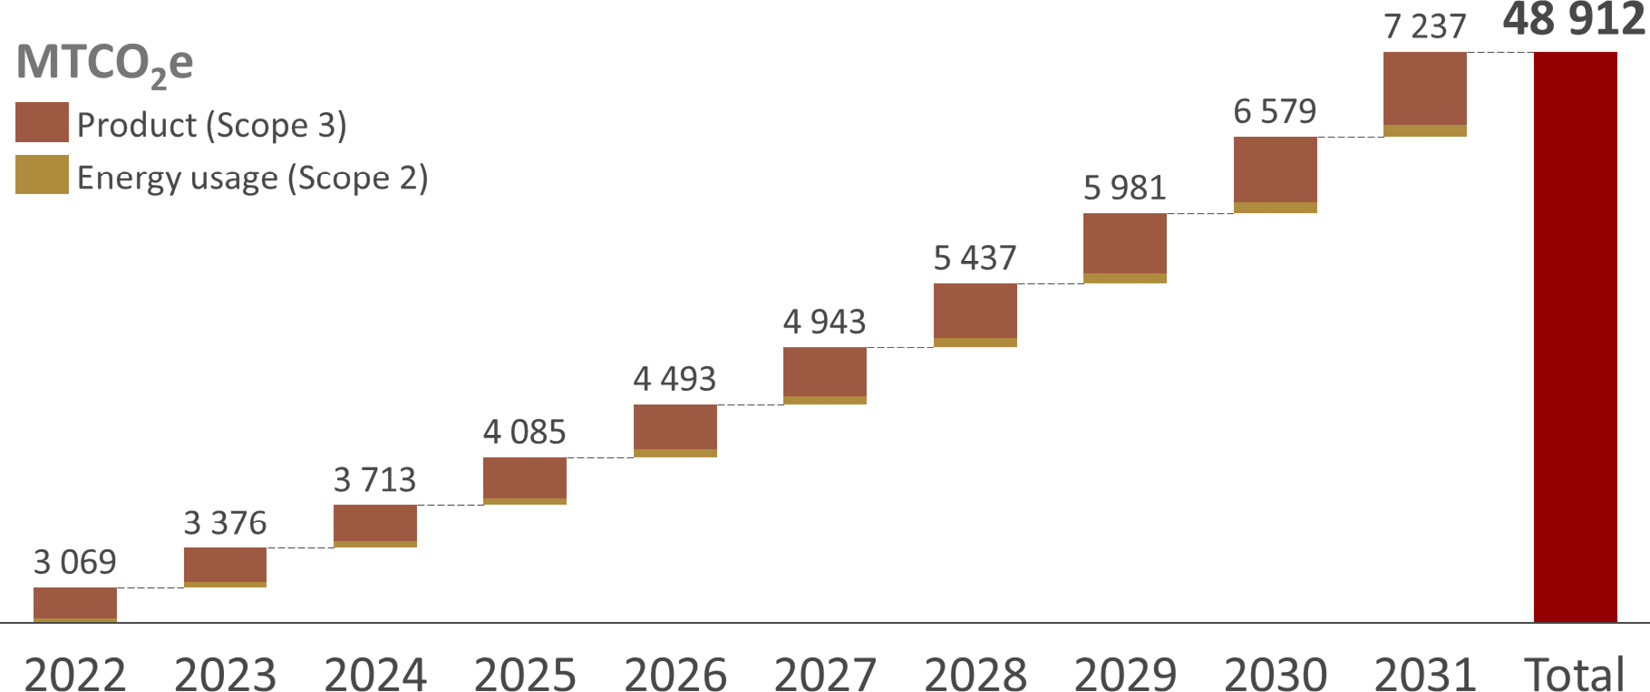
Figure 6.6 – Global manufacturing model company computer GHG emissions
Looking at the total impact just from energy usage (Scope 2) and product (Scope 3) over a 10-year cycle, the emissions are close to 50,000 metric tons of CO2e (MTCO2e), which is a staggering number. Roughly 16% comes from your Scope 2, which is energy usage, while the remaining 86% comes from your Scope 3, which is manufacturing, logistics, and end-of-life management.
This is just for one global manufacturing model company, so it should give you a good sense of the gravity of the situation. The good news is that several alternatives can be explored to reduce GHG emissions radically. Later in this chapter, we will explore ways to prolong the end user’s hardware’s lifetime.
Server life cycle assessment
Now, let us look at a life cycle assessment of a server. According to IDC, the worldwide server market will be 120 MUSD business in 2022, and it is expected to grow to 170 MUSD by 2026 (Chandarasanti 2022). The worldwide server market is primarily dominated by DELL-EMC (17.5% market share) and HP Enterprise (HPE) (16.3% market share), tightly followed by Lenovo, Cisco, and IBM. For this example, I have chosen two servers from the two largest providers – Dell-EMC and HP Enterprise (HPE).
You will discover that the Product Carbon Footprint (PCF) profile will look different than end user computing IT equipment, where most of the carbon emission is spent in the use phase instead of manufacturing. According to Dell-EMC’s assessment, a PowerEdge R740 server emits 8,640 kg CO2e (Dell 2019) over an expected lifetime of 4 years with a yearly TEC of 1,760.3 kWh. Similarly, for an HPE server, the PCF for a standard ProLiant DL365 Gen10 Plus Server is estimated to be 7,980kg CO2e over a 4-year life cycle with a yearly TEC of 1,289.92 kWh (HPE 2021).
In both cases, an expected lifetime of 4 years seems a bit short. In my experience, there is a second-hand market for servers, and they can live on for 7 to 8 years and even 10 years if they are correctly serviced and upgraded along the way. However, in the past, there have been reports that the average refresh rate for the major cloud providers – Amazon Web Services (AWS), Microsoft, and Google – was 3 years. Fortunately, that has now changed; Microsoft and Google have extended their lifespan to 4 years, and AWS has extended it to 5 years (Miller 2022). All three vendors have also reported that extending the lifespan of the IT equipment would boost their operating income by billions of dollars (Miller 2022).
Compared to a Dell Latitude 7420 notebook, which emits 341 kgCO2e ± 81 kgCO2e over a lifetime of 4 years, a server emits 25 times more than a standard laptop. This is a significant difference. Only one server equates to driving a car 34,000 kilometers in a passenger car, and 10 of these servers have a carbon footprint equal to what 41 hectares of forests can absorb in a year. The following diagram illustrates how the carbon emissions are distributed over the server’s life cycle:
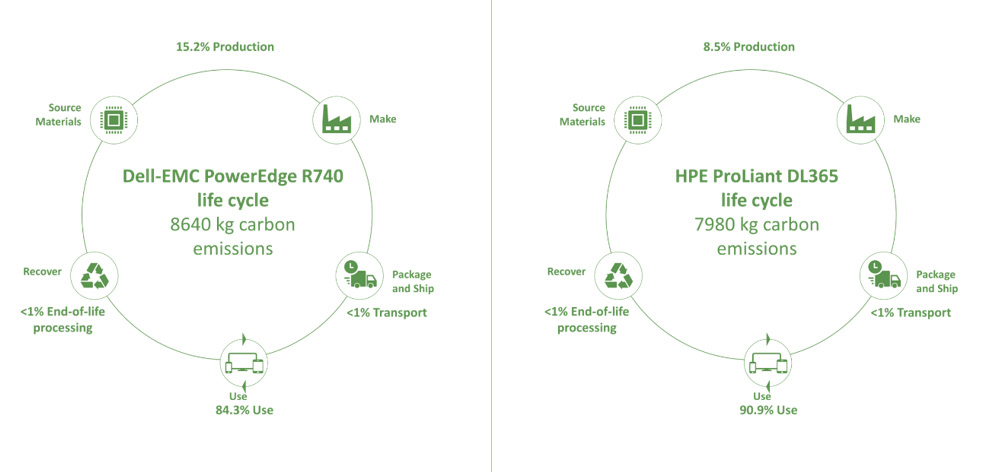
Figure 6.7 – DELL-EMC and HPE server production carbon footprint life cycle distribution
Contrary to end user equipment, where 80% of the carbon emissions are spent during the manufacturing phase, only 10% to 15% of a server’s product carbon footprint is attributed to the manufacturing phase. The 85% to 90% remaining of the product’s carbon footprint is consumed during the usage phase. The package and shipment and end-of-life processing are less relevant for a server.
As 85% to 90% of the server’s carbon footprint is consumed during the usage phase, which can be translated into your energy consumption, this has a significant implication for your total cost of ownership since running and cooling the server far exceeds the initial price of the hardware. Therefore, buying “Energy Star” certified servers is extremely important to ensure the efficient use of your enterprise servers. Furthermore, a data center/cloud provider has a significant role in lowering carbon emissions by running on renewable or low-carbon energy, leveraging hardware utilization, increasing share of virtualization, and heat recovery, to mention a few. We explored some of these key concepts in detail in Chapter 4, Data Center and the Cloud, on optimizing your computing workload.
In the next section, we will look at how to extend the lifetime of a product by applying several different techniques.
Product lifetime expansion
Extending the lifetime of a product is one of the most critical factors in reducing greenhouse gas emissions. In today’s fast-electronics mindset, we tend to apply a linear approach, treat our electronics as disposable assets, and pay little or no attention to circular practices. This approach is not sustainable in a world with finite resources and an insurmountable amount of e-waste that is continuously growing. It is worth noting that the EU has an entire initiative focused on becoming a circular region as part of the Green Deal. It has been creating several laws aimed explicitly at e-waste, such as the Waste from Electrical and Electronic Equipment (WEEE) directive.
We radically need to prolong the lifespan of our IT products and components while maximizing their value by minimizing resource use. Prolonging our IT products’ lifespan is a significant opportunity to reduce our greenhouse gases and resource consumption in energy, water, minerals, and metals.
Several factors can be considered to extend the product’s lifetime use:
- Product warranty: Demand an extended product warranty to ensure a longer lifetime of the product in the first use phase.
- Product durability: The product should come with high durability to withstand everyday use from wear and tear.
- Modularized assembly: Components and materials that are easy to disassemble from each other and can be replaced, such as the battery, hard drive, and memory.
- Battery longevity and replicability: Demand guarantees above 1,000 charge cycles and the ability to quickly replace batteries.
- Standardized connectors: Utilize products with standardized connectors to reduce the need for multiple accessories such as power adapters, docking stations, screens, and more.
- Data protection and security features: Ensure that IT products can be safely refurbished and redistributed. The ability to remove data securely is critical. Different removal techniques must be used, depending on the sensitivity of the data on the storage media. We will explore them further in this chapter’s ITAD – the rise of a new circular industry section.
- Product-as-a-Service: Explore the Product-as-a-Service subscription model instead of buying a product up front. Some leasing companies and increasingly hardware vendors such as Cisco, Dell, and HP offer a green-leasing approach that can bring several sustainability benefits and reduce carbon footprint, recover the material, minimize e-waste, and reduce up-front CapEx spending.
Energy consumption
The most significant contributing factor over time to reducing your carbon cost is your energy consumption. 60% of businesses prioritize energy consumption of IT resources in their company’s sustainability policy (Google Cloud 2020). More than half also choose suppliers that share their sustainability aspirations (54%) and work to reduce the use of plastics (54%) (Google Cloud 2020). In Chapter 7, Energy Resource Management, we will be looking closer into the use of energy, but for now, let us look at some key recommendations for preserving energy:
- Understand your energy usage from your IT assets
- Educate end users to switch off IT assets when not in use
- Enforce IT policies to automatically switch off IT assets when idle for 15 to 30 minutes
- Switch your offices and sites to renewable energy where possible and offer financial incentives for employees at home to shift to renewable energy providers with monthly contributions to the energy bill
Finite resources and hazardous substances
IT hardware contains finite resources such as rare-earth metals, minerals, and hazardous substances. As the world is facing both supply chain and geopolitical issues, which disrupt the flow of materials and finished goods, it has become clear that we need to rethink our supply strategies. Geopolitical issues, such as the war in Ukraine, show how fragile our global supply chain has become. For example, the supply of nickel, a valuable component of vehicle batteries, has experienced severe shortages due to Ukrainian production coming to a standstill. End-of-life management, which we will discuss in the next section, has become an excellent source to tap into as the heap of e-waste is increasingly growing. Let us take a closer look at these finite resources and hazardous substances.
In a computer, the following metals can be found: copper, aluminum, gallium, phosphorous, lead, tin, iron and steel, silver, gold, tantalum, mercury, and yttrium. The Royal Society of Chemistry in the United Kingdom highlights that gallium, arsenic, indium, yttrium, and tantalum are at risk of running out in the next decade (Royal Society of Chemistry 2022). They are frequently used in batteries, computers, LED lights, medical devices, microchips, semiconductors, smartphones, and solar panels. For example, there is more gold in a tonne of smartphones than in a tonne of gold ore (Gill 2021). Furthermore, the Royal Society of Chemistry advocates global efforts to “mine waste rather than the Earth.”
In addition, a computer contains hazardous substances such as phthalates, brominated flame retardants, synthetic musks, alkylphenols, and organotins that must be managed with extreme care. These hazardous substances can cause unwanted side effects such as asthma, hay fever, eczema, and cancer (IT-recycling 2022).
Following the 1992 Basel Convention on the Control of Transboundary Movements of Hazardous Wastes and Their Disposal, many countries have implemented regulatory restrictions prohibiting the export of electronic waste. In 2003, the EU brought the Waste Electrical and Electronic Equipment Directive (WEEE Directive) 2012/19/EU and the RoHS Directive 2011/65/EU into European law.
The WEEE Directive regulates the collection, recycling, and recovery of various electronic goods. It places a “producer responsibility” on manufacturers to ensure proper collection and life cycle management of old products and materials. The WEEE Directive includes 10 electronics categories, including IT and telecommunications equipment. The WEEE Directive has been updated several times; the latest revision was enacted on August 13, 2012. It is also worth noting that while WEEE regulates consumer waste electronics, it does very little to regulate commercial products.
The RoHS Directive regulates European manufacturers’ usage of hazardous substances in production and product inclusion on new electronic equipment being introduced in the market. RoHS stands for Restriction of Hazardous Substances (EU Parliament 2011). To further restrict the use of certain hazardous substances in electrical and electronic equipment (EEE), the European Parliament enacted an updated RoHS Directive on June 8, 2011. The sole purpose of this directive is to address the increasing global issue of e-waste and prevent the use of hazardous materials. The directive singles out six hazardous materials:
- Lead (Pb)
- Mercury (Hg)
- Cadmium (Cd)
- Hexavalent chromium (Cr6+): Used in chrome plating, chromate coatings, and primers
- Polybrominated biphenyls (PBB): Flame retardant in plastic
- Polybrominated diphenyl ether (PBDE): Flame retardant in plastic
The directive states that the use of these six hazardous materials in electrical and electronic equipment should be restricted during the point of manufacturing, with the product itself, and ensure proper release of materials within e-waste streams to prevent human health and environmental hazards. The most effective way to eliminate hazardous substances is at the point of manufacturing, ensuring that they are not carried over into other subsequent value streams.
End-of-life management
The disposal of IT equipment poses a significant threat to the environment. The volume of electronic waste generated worldwide in 2021 was roughly 57 million metric tons, equivalent to 125,000 jumbo jets or the weight of the entire Great Chinese Wall (Gill 2021). The United Nations refers to it as a “tsunami of e-waste” (Ryder and Houlin 2019). Unfortunately, e-waste has become the fastest worldwide waste stream, expected to grow to 75 million metric tonnes by 2030. Contributing factors to fuel this growth are the global availability of electronics and increased spending power. The following diagram illustrates the expected growth of e-waste from 2019 to 2030 at an annual rate of 3% per year:
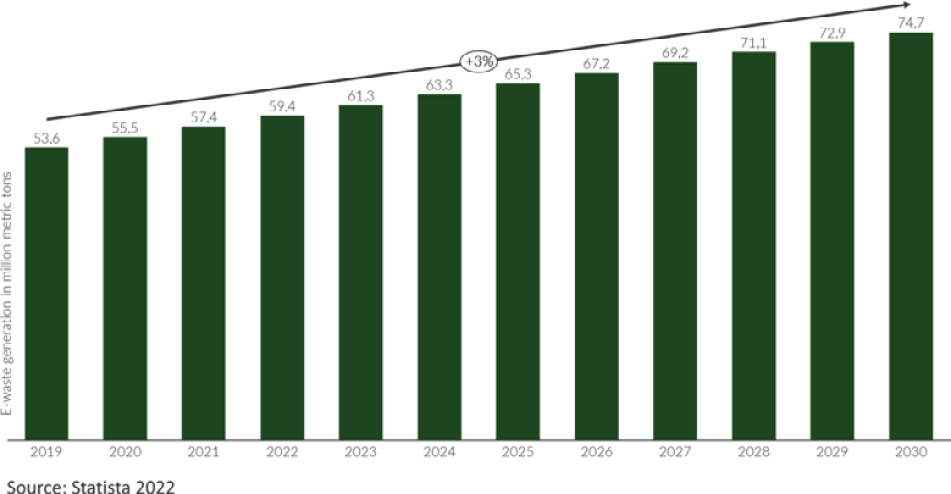
Figure 6.8 – Projected electronic waste generation worldwide from 2019 to 2030 (in a million metric tons)
The following diagram illustrates the breakdown of e-waste and recycling rate per continent. The most e-waste is generated in Asia (24.9 Mt) but broken down per capita, Europe is the frontrunner with 16.2 kg per capita. In Europe, 42.5% of e-waste is collected, documented, and recycled correctly, whereas in the Americas (9.4%), Asia (11.7%), Oceania (8.8%), and Africa (0.9%), the recycling rates are significantly lower:
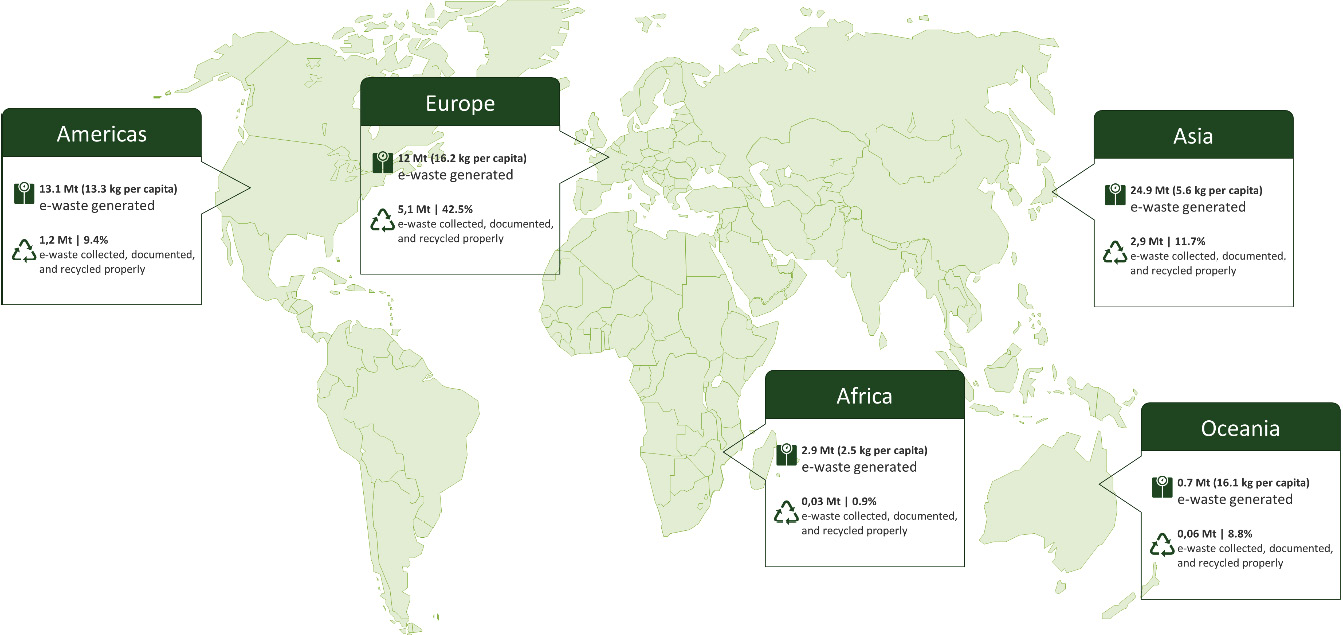
Figure 6.9 – E-waste and recycling rate per continent (ISWA 2020)
It is estimated that only 17.4% of all e-waste is appropriately collected, documented, and recycled, whereas 82.6% represents undocumented e-waste flows. It is estimated that $57 billion of raw materials is wasted annually due to the lack of reusability and recycling practices (Mendoza 2020). With global supply chain issues and geopolitical concerns, such as the war in Ukraine, there is a significant opportunity to harvest and recycle raw materials instead of extracting virgin material from the ground. Yet, this requires changes in processes, suppliers, partner networks for repair and recycling, reverse logistics, and funding.
Capgemini highlights in their recent report, Sustainable IT – Why it’s time for a green revolution for your organization’s IT, that 89% of organizations recycle less than 10% of their hardware (Capgemini 2021). Despite the rapidly growing rates of e-waste, many organizations do not treat it as a priority (Ryder and Houlin 2019). If you think about it, this is an eye-opening figure that shows we are not doing enough to apply circular principles to ensure that our e-waste is recycled, regenerated, and repurposed back in the IT hardware life cycle. Instead, it ends up in a toxic landfill.
Later, in the ITAD – the rise of a new circular industry section, we will take a closer look at an emerging industry called IT asset disposition (ITAD), which is increasingly focusing on curbing the e-waste management problem and getting assets back in circulation through refurbishment, remarketing, parts harvesting, recycling, and disposal.
But first, let us take a closer look at how to work with the circularity of the IT hardware throughout the whole life cycle from cradle to cradle.
Circular IT hardware management
As we saw in the previous section, there are some significant environmental impacts during a product’s life cycle. The switch from a linear economy to a circular economy is pivotal in transitioning to a sustainable future. As we saw in Chapter 1, Our Most Significant Challenge Ahead, we are already consuming 1.75% of Earth’s resources and not regenerating enough to live within the constraints of planet Earth. In our current way of living, finite raw materials are extracted, or non-virgin plastics are used, the products are manufactured, products are shipped to a distribution point, the customer buys and uses the products, and at the end of the product lifetime, it is discarded with limited reused or recycled – the process is linear.
In the linear economy, we continue to deplete Earth’s natural resources, and once they have reached their end of life, they end up in a toxic landfill instead of being recycled. In the circular economy, we take a minimal number of finite resources and create a regenerative process flow that continues to live as long as possible. The following diagram illustrates the 9R framework (Kirchherr, Hekkert, and Denise 2017) for a circular economy:
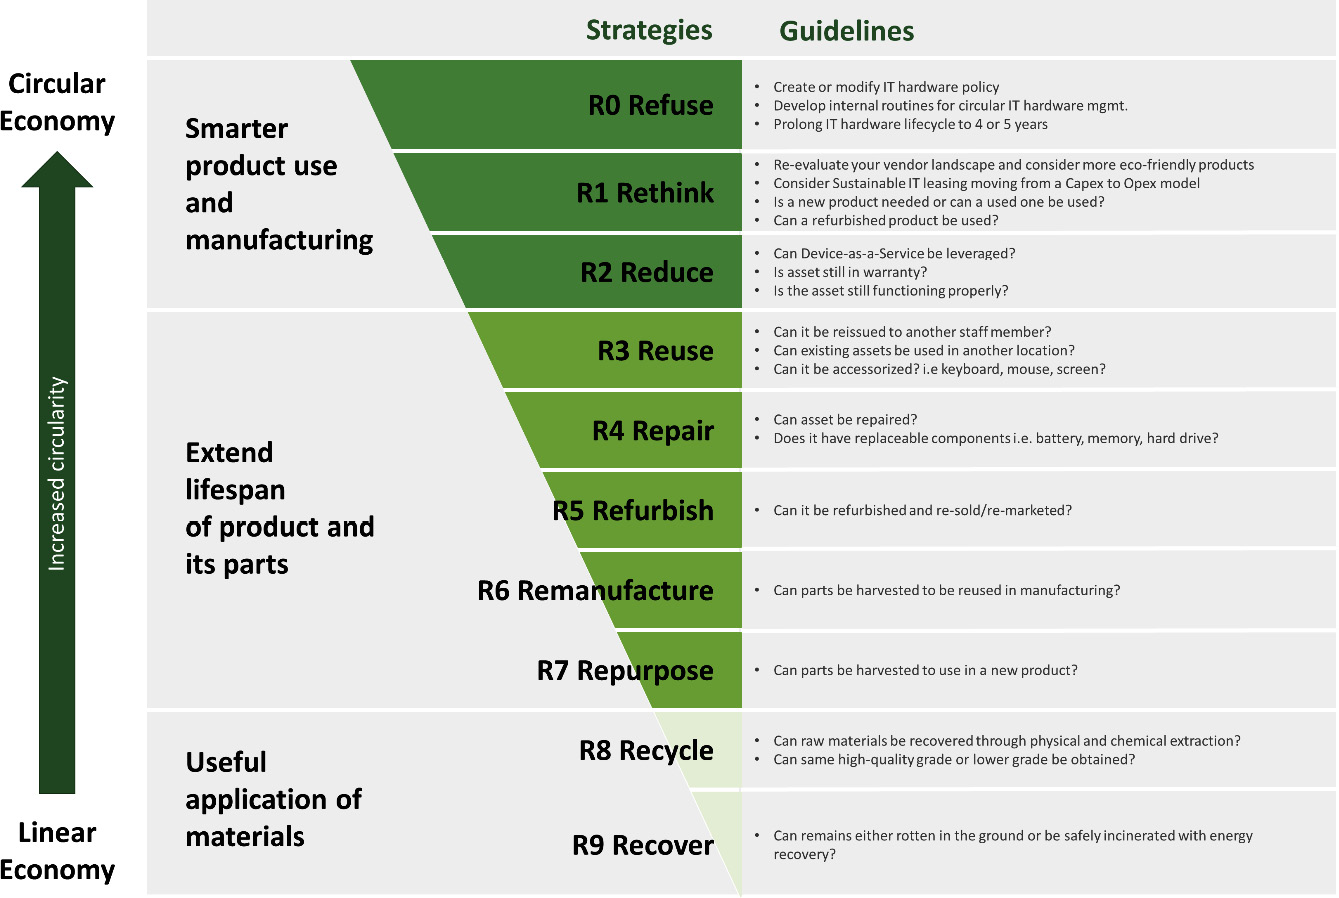
Figure 6.10 – 9R framework circular economy
The 9R framework consists of 10R strategies divided into three categories. The categories specify a more innovative product use and manufacturing, the extended lifespan of the product and its parts, and the practical application of materials. These strategies are R0 Refuse, R1 Rethink, R2 Reduce, R3 Reuse, R4 Repair, R5 Refurbish, R6 Remanufacture, R7 Repurpose, R8 Recycle, and R9 Recover. Several guidelines or critical questions can be applied for each step to inspire thinking differently. These strategies are well aligned with the circular economy’s core pillars defined by the Ellen MacArthur Foundation:
- Designing out waste and pollution
- Keeping products and materials in use
- Regenerating natural systems
The whole idea is that the further you move from R9 Recover to R0 Refuse, the more you transition from a linear to a circular economy. The earlier in the life cycle you can apply one of the strategies within the 9R framework, the better and the less invasive impact it has on the environment. Let us look at how the circular economy approach can be applied within your environment:
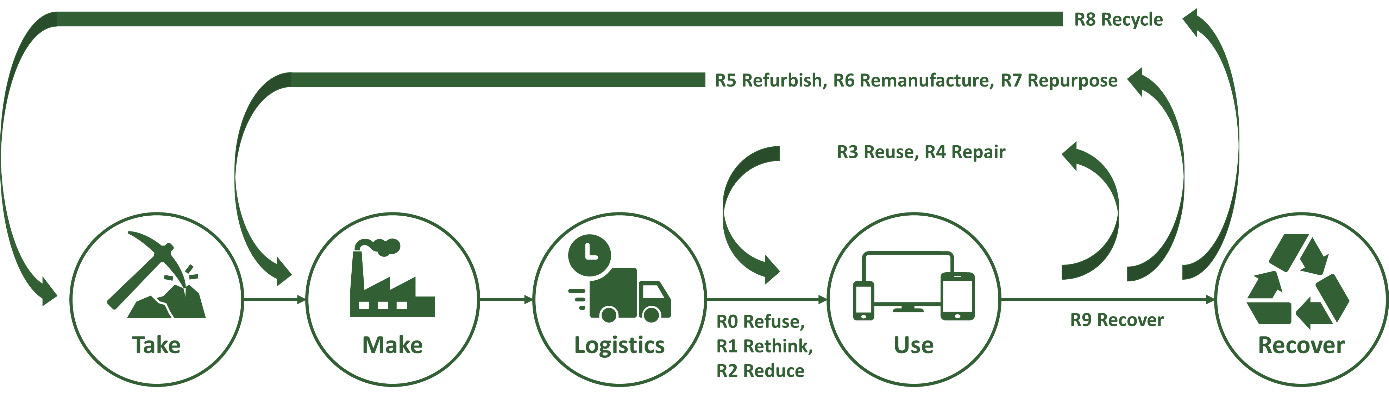
Figure 6.11 – Circular economy approach to the 9R framework
The most significant impact you can have is refusing, rethinking, and reducing strategies in the pre-use phase. Once the product is in use, reuse and repair strategies should be applied. This capability can be retained in-house or outsourced to a vendor. Once the product approaches its end of life, refurbish, remanufacture and repurpose strategies should be applied. This is most likely a capability for you to need assistance from a vendor that can support you with the IT asset disposition process. If all nine other strategies fail, the last phase is the recovery phase, where remains can rot in the ground or be safely incinerated with energy recovery.
Let us take a closer look at some of the guidelines that you can apply within your environment for each strategy to promote circular principles:
- R0 Refuse:
- R1 Rethink:
- R2 Reduce:
- R3 Reuse:
- R4 Repair:
- R5 Refurbish:
- R6 Remanufacture:
- R7 Repurpose:
- R8 Recycle:
- R9 Recover:
Social responsibility – a key unlocking circular transition
One shortcoming of the circular economy is that it almost exclusively focuses on environmental issues and puts limited focus on social issues. In this section, Stephen Fuller, a supply chain management and senior developer of supply chain and chemical management criteria for TCO Certified, the global sustainability certification body for IT products, shares his perspective on how social responsibility and worker rights can help leverage the circular transition.
How worker rights can help leverage the circular transition
Circular solutions help us tackle many of today’s sustainability issues, such as climate change, the depletion of scarce resources, natural resources, and the destruction of natural habits. However, a shortcoming in today’s circularity plan is that it lacks focus on social issues. This is unfortunate from a human perspective, but it also reduces our chances of succeeding with the circular transition. Human and worker rights can be used as leverage to accelerate the pace of change. By stopping the exploitation of people in the IT product supply chain, we can quickly move to producing and consuming IT products that are genuinely sustainable.
Today, IT products are manufactured and used in a mainly linear way. We take virgin natural resources and make products from them, which we discard once we use them – often after a relatively short time. The products are then replaced with others, made in the same way. It’s widely accepted that the short life we currently give IT products leads to several sustainability issues that need to be addressed urgently, such as significant greenhouse gas emissions, overconsumption of scarce natural resources, and enormous amounts of toxic e-waste. In addition, short-lived products cause significant fluctuations in demand, requiring production to be ramped up, often at short notice. These frequent spikes in production are covered by employees agreeing to excessive overtime hours, mainly because the minimum wage levels they are paid do not provide them with enough income to cover their living costs.
Low prices come at a high cost
One reason IT products are discarded prematurely is that they are relatively cheap to buy – we pay far from the total cost if the value of natural resources and human well-being is factored in. Thousands of people participate in the production of computers and phones, from the miners who dig up the minerals used in electronic components to the workers in the final assembly factory. Compared to other product supply chains such as textiles, the multi-tiered supply chain of the IT industry dwarfs all others and should make these products very expensive to manufacture and buy:
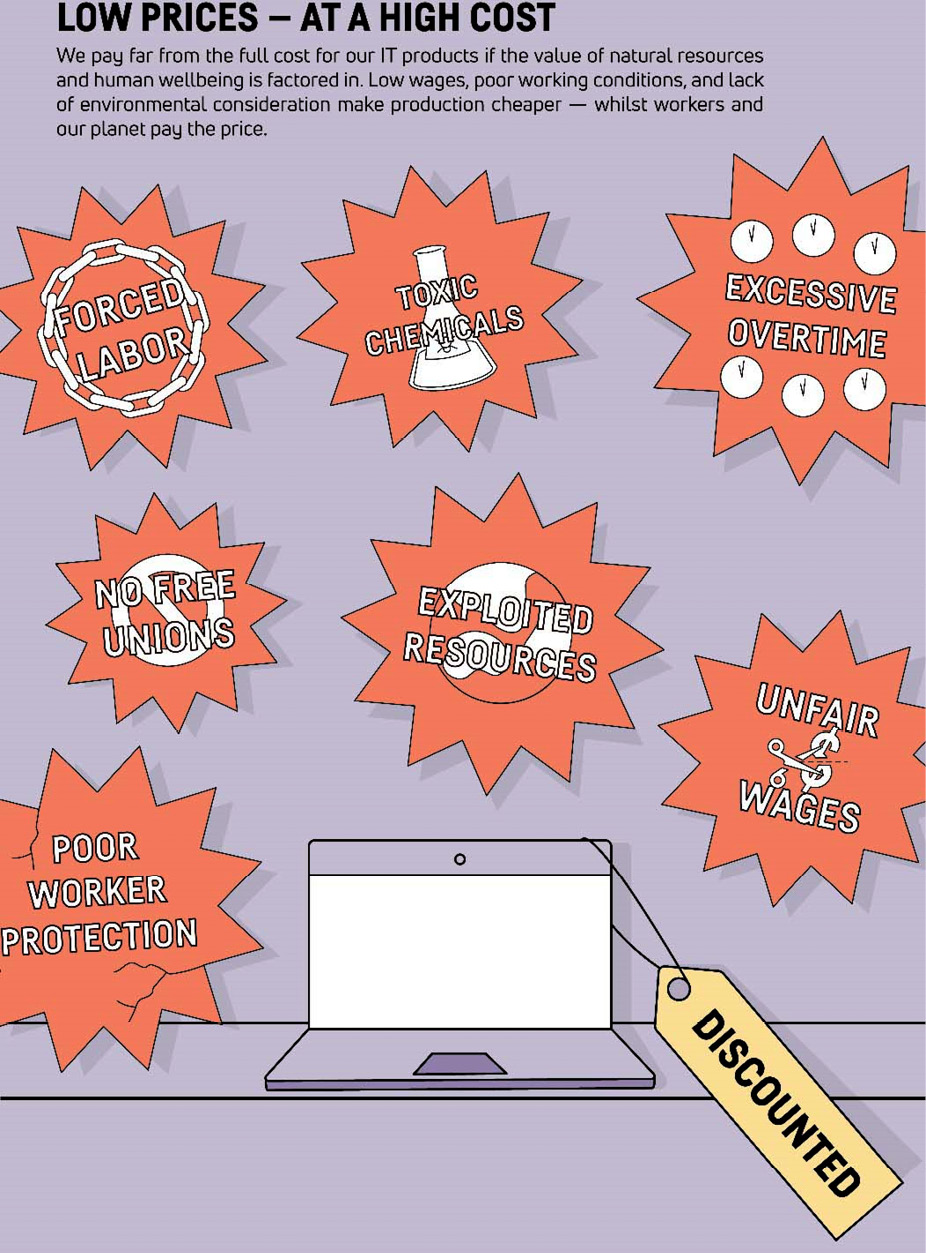
Figure 6.12 – Low prices – at a high cost (image courtesy of TCO Certified)
This, however, is not the case, and a significant reason is that the IT product supply chain contains a high concentration of cheap labor. Much of the manufacturing of IT products is carried out in low-cost, low-wage countries, where workers are often less protected and employment is less regulated than in more developed countries. Local governments are known to ignore human rights and establish labor laws to stimulate business investment. Wages are kept low, working conditions are sometimes poor, and the abuse of labor rights and social benefits is allowed to continue. In addition, the supply chain is complex and geographically widespread, making it difficult to control. A computer or a phone contains raw materials and components from hundreds of suppliers, which are often spread over the globe. With so many actors involved, human rights risks are difficult to manage.
Worker rights help speed up the circular transition
To buy and manage IT products responsibly, you need to consider environmental, social, and circular economy practices. All these issues are linked; treating workers in the IT industry somewhat can help speed up the transition to the circular economy. In meetings with IT product manufacturers, I have often heard from factory management that investing in social improvements increases production costs and a reduction in revenue. It is not surprising – giving workers a living wage and social benefits will increase the cost of manufacturing. However, it is the only reasonable way to go. Apart from respecting workers’ rights and promoting a safer and healthier working environment, it will make the circular take-make-use-reuse economy all the more possible.
Higher production costs will mean higher purchasing prices. That is the most effective way of driving the innovation and development of longer-lasting products that users want to keep, service, and repair rather than dispose of and replace. More expensive IT devices will also incentivize IT brands to give more room to circular business models, such as Product-as-a-Service solutions where the IT brand retains ownership of the product, and the user pays for the function and values it can offer during a set period. This way, revenue generation is not exclusively linked to selling as many products as possible. Instead, it makes business sense to manufacture durable IT devices designed for a long life that can be repaired and upgraded so that each product can be leased for as long as possible. This is a dream scenario for anyone who wants to realize a circular economy.
Purchaser demand sets the process in motion
Not enough progress will happen without demands on those with power and influence. Local governments in some manufacturing countries do far too little to enforce their human rights and labor laws, which means that the responsibility falls to manufacturers and brand owners to take responsibility for their supply chains and ensure workers are treated fairly and receive the rights they are entitled to.
Having worked for 25 years with sustainability issues in the IT industry, I know that financial incentives are crucial to getting brand owners and factory management to prioritize the well-being of workers and our planet before short-term economic gains. In conversations with IT brands, I’ve sometimes asked what they consider is needed to speed up the move to more sustainable practices. The reply is almost always: “buyer demand.”
By setting precise, sharp requirements, purchasing organizations can push the industry in a sustainable direction. Criteria need to be relevant, up to date, and go beyond legislation. To drive change and reduce the risk of greenwashing, compliance with all criteria should be verified by independent experts. When non-compliance is found, a corrective action plan should be set up and implemented within a set timeframe. Regular monitoring is also essential to make sure bad practice doesn’t return.
Manufacturing a sustainable product is not just about which product uses the most recycled content or is the easiest to repair. It is the whole life cycle of the product that tells us if it is genuinely sustainable – that is, how it is made, used, and treated at the end of its usable life. By allowing social considerations within this chain to drive circular development, we can create solutions that benefit both people and the environment in the long term. If we are prepared to pay the actual environmental and social costs of our IT use, the circular transition can be made in a way that benefits everyone.
Stephen Fuller, supply chain management expert and senior developer of supply chain and chemical management criteria for TCO Certified
What is TCO Certified?
TCO Certified helps buyers worldwide address the most critical sustainability challenges connected to electronics, such as climate, circularity, hazardous substances, and supply chain responsibility. The certification also includes a comprehensive independent verification system and a structured system for continuous improvement to drive real and lasting change. TCO Certified covers 12 product categories, including most IT products you can find in an office and those that store your data. Read more about TCO Certified here: https://tcocertified.com/tco-certified/.
As we transition from the linear to the circular economy, we can conclude that we cannot single-handedly focus on environmental and social issues. Transitioning toward producing, consuming, and recovering IT products that are genuinely sustainable requires firm action to stop the exploitation of people in the IT product supply chain. In Chapter 8, Leveraging Your Buying Power, we will explore how you can set clear and sharp requirements to push the industry in a sustainable direction.
Making a business case for change
By now, it should hopefully be abundantly clear that the most cost-effective and sustainable way is to keep your products and materials in use for as long as possible. Earlier in this chapter, we looked at a global manufacturing model company. Over 10 years, it emits a staggering 50,000 metric tons of CO2e (MTCO2e) just from end user computers within Scope 2 and Scope 3. We must rapidly change our approach from a linear to a circular model.
By focusing on buying IT hardware that is durable, repairable, and upgradable, you have a sizable opportunity to maximize the lifespan and reduce greenhouse gas emissions. Consider how this would play out in practice for our end user equipment. Earlier in this chapter, we learned that roughly 80% of greenhouse emissions are consumed during manufacturing. Looking at the scene where a Dell Latitude 7420 emits 341 kgCO2e ± 81 kgCO2e, the manufacturing represents 85.9% of total emissions, equating to 292 kgCO2e. An expected life expectancy of 4 years means that 73 kgCO2e is emitted yearly. By extending the product’s life expectancy by 1 or 2 years, the yearly emissions decrease to 58 kgCO2e and 49 kgCO2e, respectively. This is a reduction of 15 kg per year or 20% to extend for 1 year and 24 kg per year or 32.9% percent to extend for 2 years. The following diagram illustrates an example of amortizing a laptop’s carbon emission over 4, 5, and 6 years:
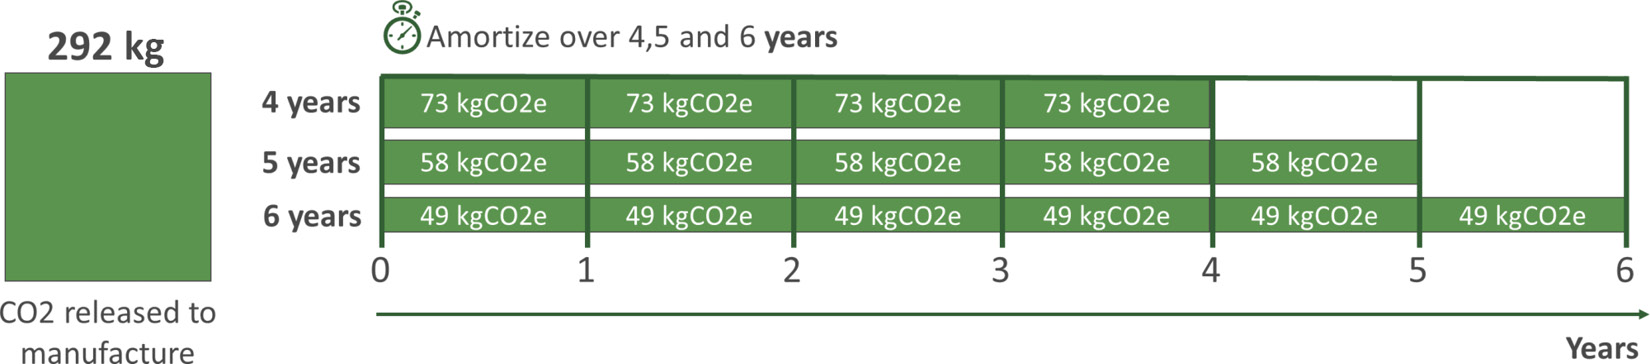
Figure 6.13 – Amortizing a laptop’s carbon emission over 4, 5, and 6 years
Extending the product life cycle does not only cut greenhouse gas emissions but can also significantly impact your bottom line by reducing cost. Let us look at the same global manufacturing model company we looked at before with 36,000 computers with an existing hardware life cycle policy of 4 years.
Suppose we consider changing our hardware life cycle policy from 4 to 5 years; let us investigate the financial and sustainability benefits. Instead of replacing 9,000 computers every 4 years, we will now replace 7,200 every 5 years. We assume that the average global cost for a new Dell Latitude 7420 is 950 euros. We anticipate that we will have 4 hours of efficiency gains per computer by having to replace 1,800 fewer per annum. We also factor in a contingency factor of 10% to 25% to account for variable change, meaning that all computers may not be able to live beyond the 5-year mark. No carbon credits have been factored in by handing over your end-of-life computer to an ITAD provider to be refurbished, repurposed, or recycled:

Table 6.1 – Business case for change – end user computing
As shown in the preceding table, extending the product life cycle by a year will give us significant benefits from a cost, efficiency, and sustainability perspective, considering variable change by factoring in a contingency between 10% to 25%. The following diagram summarizes cost savings, efficiency gains, and GHG emission reduction potential within the contingency range:
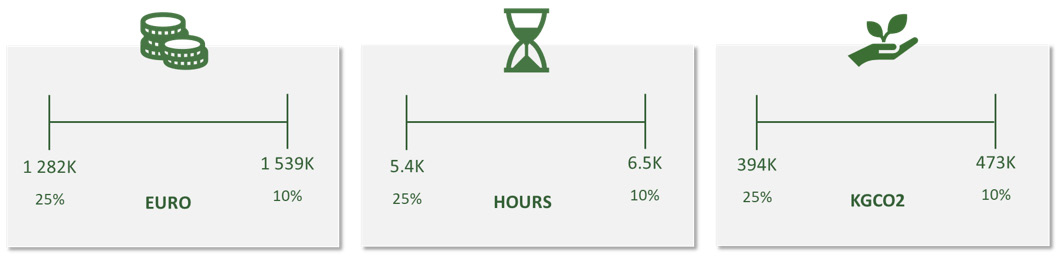
Figure 6.14 – Business case for change – summary of cost savings, efficiency gains, and GHG emission reduction
As we can conclude, there are several significant benefits from a cost, efficiency, and greenhouse gas emission reduction perspective by simply prolonging your hardware life cycle by 1 year and revisiting Figure 6.3, where we observed the computer GHG emissions for the global manufacturing model company over 10 years. The following diagram illustrates how the dynamics change moving the product life cycle from 4 to 5 years, resulting in an aggregated reduction of roughly 10,000 metric tons of CO2e (MTCO2e), which is a 20% reduction:
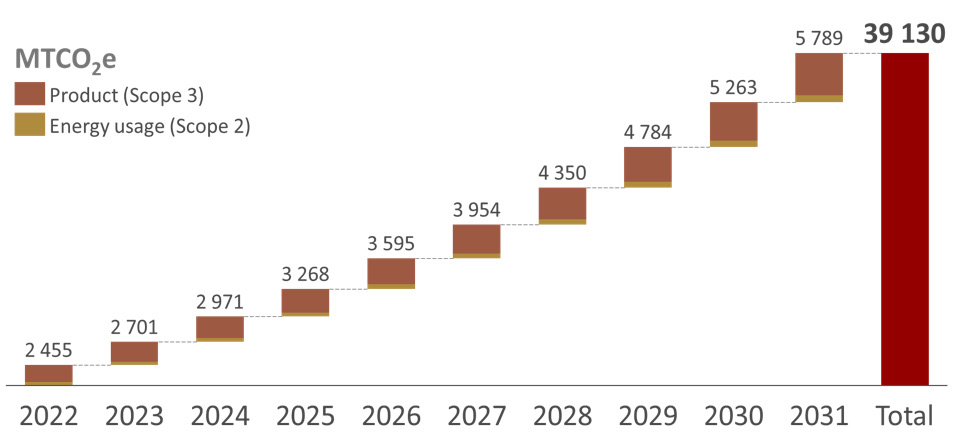
Figure 6.15 – Changing the product life cycle’s global manufacturing model company computer GHG emissions
If your company’s overall goals are to reduce its GHG emissions by 50% until 2030, just prolonging the product life cycle from 4 to 5 years will not take you all the way. As we saw earlier in this section, there are several different alternatives to be explored, such as buying more eco and carbon-friendly from the start, exploring DaaS to reduce the need for new hardware, leveraging green leasing that guarantees a CO2-neutral impact, and buying refurbished hardware from the start, just to mention a few. One of your most powerful ways to move from linear to circular IT hardware management is to start working with ITAD.
In the next section, we will explore how to manage IT hardware when it is approaching its end of life and what alternatives are available.
ITAD – the rise of a new circular industry
As we discussed earlier in this chapter, e-waste is the most significant growing waste in the world. As the volume of electronic waste in 2021 reached roughly 57 million metric tons, which is the equivalent of the weight of the entire Great Wall of China (Gill 2021), and projections for 2030 are reaching 75 million metric tons, this is a huge concern. In particular, manufacturing electronic equipment requires high consumption of resources and creates high greenhouse gas emissions. In addition, incorrect disposal or informal recycling leads to the release of highly toxic substances.
As we saw in the previous section, both the Basel Convention and WEEE Directive regulate the proper collection, documentation, and recycling of e-waste. It is worth noting that the WEEE Directive has also been widely criticized for falling short in several areas. This is primarily due to the lack of controls in place to promote the reuse and recycling of valuable electronic resources but also failing to prevent the cross-border transfer of equipment sent to developing countries for scrap (Murray 2012).
A considerable proportion of discarded IT equipment is not waste. For this reason, the ITAD industry was created, focusing on the acquisition, reuse, repair, and disposal of unwanted IT equipment, predominantly from commercial companies, in a safe and environmentally responsible way. Following the 9R framework, as previously introduced, an ITAD vendor tries to make value recovery as high up in the value chain as possible to recover maximum value.
The ITAD industry tries to address three critical environmental impacts:
- Avoid GHG emissions through responsible recycling
- Recycle critical metals and minerals
- Divert hazardous substances from landfills and improper dispersal
In recent years, the ITAD industry has enjoyed tremendous growth due to increased focus on environmental issues, increased need to prevent data breaches, and tougher regulatory compliances. Market Research Future expects the global ITAD market to reach $27 billion at a 12% compound annual growth rate (CAGR) by 2025 (Cunnie 2022). Although the industry has enjoyed healthy growth in recent years, there are also factors holding the industry back due to a lack of awareness of ITAD services and fear of service costs. Disposal of an IT asset is unfortunately rarely factored into a total cost of ownership (TCO) calculation, and designated funds are rarely allocated. However, properly executing your IT asset disposition process can turn a cost center into a profit center.
Two primary certifying bodies within the ITAD industry are administered by Sustainable Electronics Recycling International (SERI) and e-Stewards. SERI administers the R2 certification, which is the most common, and e-Stewards administers e-Stewards certification. In addition, most reputable ITAD vendors uphold ISO 9001 (Quality Management), ISO 45001 (Occupational Health and Safety), ISO 14001 (Environmental Management), and ISO 27001 (Information Security Management). When choosing an ITAD vendor, you should look for these credentials per site location, not just on headquarters or primary sites.
Services
There is a wide variety of ITAD services available that can be tailored to your needs. Most of the services are listed here, but this list is not exhaustive:
- Managed deployment
- On or offsite data erasure and destruction
- Asset recovery
- IT asset valuation
- IT asset repurposing or redeployment
- Data center consolidation, migration, and decommissioning
- Recycling
- Donation
Global footprint and service availability
Say you are a global company operating in multiple countries. In that case, it is also essential to understand the global footprint of the ITAD market as well as the maturity of the services available. Based on my experience surveying some of the most prominent ITAD vendors in the world, the following diagram illustrates the global ITAD footprint and service availability:
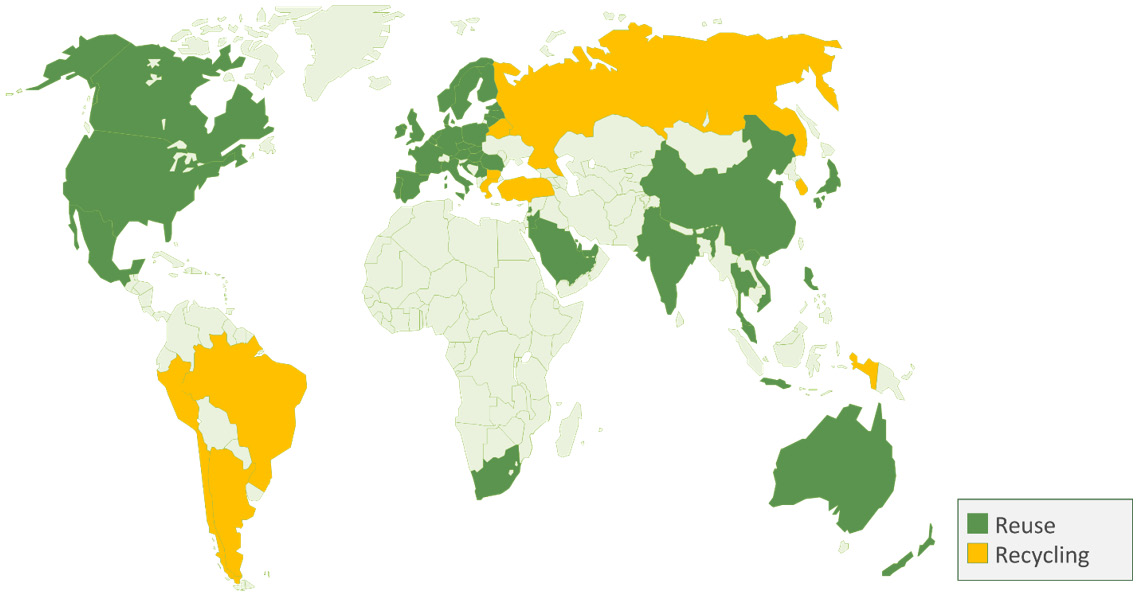
Figure 6.16 – Global ITAD footprint and service availability
In Europe, North America, and Oceania, the ITAD market is well developed and offers a complete range portfolio. In Asia, the footprint is a bit more scattered, but markets such as China, India, and Japan are well developed. South America is a bit more scattered, and most recycling facilities are available except for a few reuse facilities. In the middle East, United Arab Emirates (UAE) acts as a collection hub for the whole region, including Africa. It has excellent growth potential.
Process
Regardless of your ITAD vendor, the process will look the same. As shown in the following diagram, the ITAD process consists of six steps, from collecting used IT hardware to final reporting:
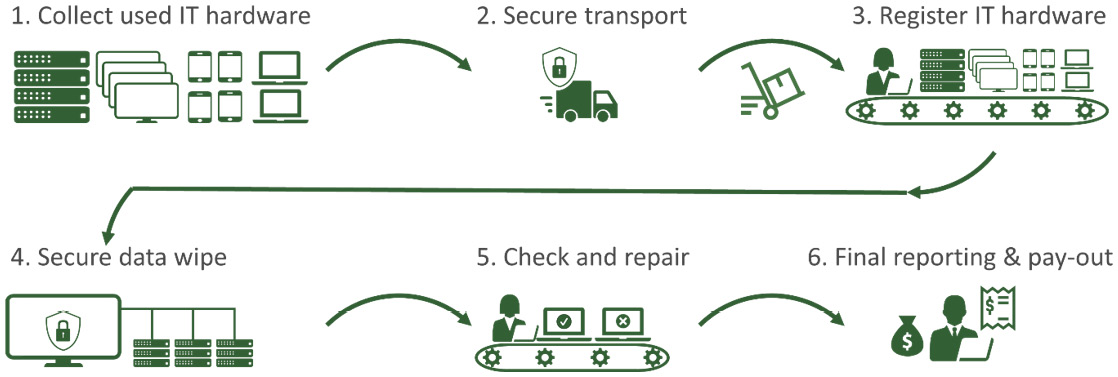
Figure 6.17 – IT asset disposition process
Let us take a closer look at each step of the ITAD process:
- Collect used IT hardware: IT hardware is collected at the customer site and audited. Depending on customer requirements, the data is sanitized before transport. The IT hardware is carefully packaged, and the outer packaging is sealed and tamper-proofed.
- Secure transport: The IT hardware is securely transported to the ITAD vendor site. Ideally, the site should be as close as possible to the customer location to minimize the impact on CO2 emissions during transportation.
- Register IT hardware: Once the IT hardware has arrived, it is unpacked, registered, labeled value assessed, and pre-sorted. Assets that fail the test are sent to de-manufacturing.
- Secure data wipe: The data is securely wiped according to customer requirements and classification. Assets that fail the test are sent to de-manufacturing. For additional details of data wiping alternatives available, refer to the Data sanitization section.
- Check and repair: The IT hardware is tested, and specifications are captured. The value of the IT asset is assessed, repaired, refurbished, and re-imaged. Assets that fail the test are sent to de-manufacturing. Assets sent for reuse are remarketed in either B2B or B2C channels. Once sold individually or in bulk, they are redeployed and dispatched. The asset registry is updated. Assets that fail the various tests are sent for de-manufacturing. Storage media is for removal and destruction. The IT hardware is dismantled, and its parts are sorted and harvested. The asset registry is updated, and any removed parts are given a parent-child identifier to ensure complete transparency. According to the WEEE Directive, parts and materials that cannot be harvested are recycled. A certificate of destruction is created.
- Final reporting and payout: The final report is produced and sent to the customer, and the financials are settled.
No matter what vendor you choose to work with, the ITAD process is relatively standardized and will follow a similar six-step process to what was outlined here. A critical step within the ITAD process is how data can be sanitized safely and securely. In the next section, we will take a closer look at what requirements you need to put on your vendors.
Data sanitization
Preventing data breaches and sanitization is a critical step in the process where the information classification of the data should guide the sanitization method. Generally, within an enterprise, government, or military, there are 4 to 5 levels of classification. The United States government and military use the following classification levels: top secret, secret, confidential, sensitive but unclassified (SBU), and unclassified. An enterprise may use five levels but different definitions, such as secret, confidential, restricted, internal, or public.
National Institute of Standards and Technology (NIST) recommends three ways to sanitize your data: clearing, purging, or destroying. For further details of the different methods, refer to NIST SP 800-88 Guidelines for Media Sanitization at https://nvlpubs.nist.gov/nistpubs/SpecialPublications/NIST.SP.800-88r1.pdf.
The following diagram illustrates how mapping the enterprise information classification levels with the different data sanitization methods may look to preserve the right level of integrity and confidentiality of the data:
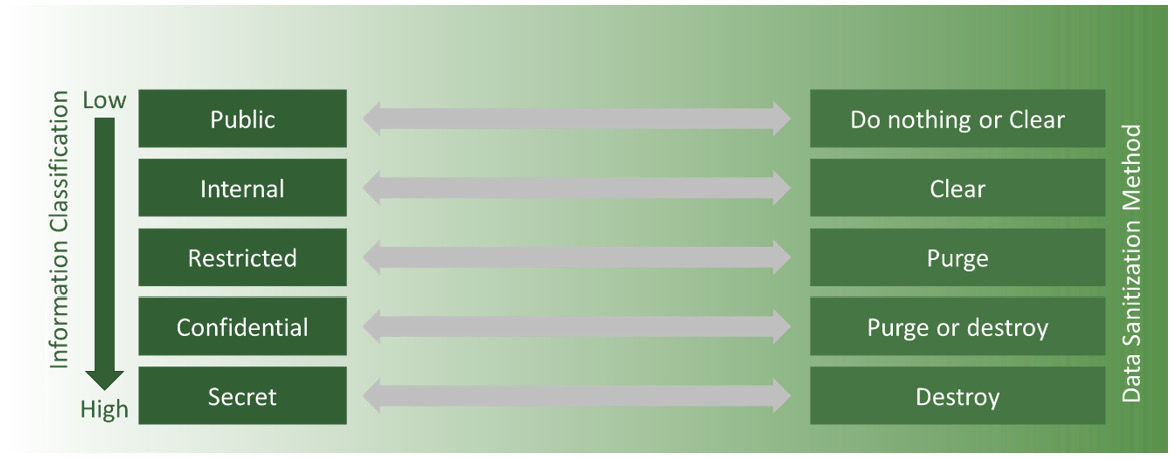
Figure 6.18 – Mapping information classification versus data sanitization
Please note that this is only an example. You should always consult with your Chief Information Security Officer (CISO) and Data Privacy Manager (DPM) to discuss how to set it up within your environment.
Now that you have a better understanding of ITAD, let us look at a case study and how ITAD fits into Electrolux’s sustainability strategy.
Why and how does ITAD fit with the Electrolux sustainability strategy?
In this section, Helena Babelon, Head of IT Sustainability, and David Scrivner, IT Sustainability Specialist/Asset Recovery Manager at Electrolux, share their journey into ITAD, which fits into the overall Electrolux sustainability strategy. Electrolux is a global leader in household appliances, with 52,000 employees worldwide, over 12.6 billion euros in sales, and over 60 million products sold annually in 120 markets. Electrolux has committed to the Science-Based Target Initiative (SBTi) regarding climate goals. They have set a lofty ambition to reduce 80% of Scope 1 and 2 emissions in operations by 2025 from the 2015 baseline and become climate neutral from Scope 1 and 2 by 2030. Furthermore, their long-term ambition is to be utterly neutral across the entire value chain (Scopes 1, 2, and 3) by 2050.
At Electrolux, we are committed to acting sustainably. Sustainability is a top priority, and we are proud to be recognized as a leader within our industry. Our company goal is to make our business circular and climate neutral by 2030. To succeed, we are continuously rethinking and improving our ways of working internally and with our customers, partners, and suppliers.
Electrolux’s goal regarding circularity is to offer circular products and business solutions and contribute to the circular economy by integrating recycled materials into our product platforms, promoting recyclability, using more sustainable packaging solutions, increasing the availability of spare parts to repair our products, and developing circular business solutions.
Using the ITAD industry to deal with unwanted IT equipment fits into the Electrolux strategy and sustainability framework and the focus on the concept of circularity and reducing the emissions from manufacturing products.
How unwanted IT equipment is handled differed in each country and region; there was no coordinated global standard approach or process for ITAD. As the quantities and demand increased, there was a need to set an internal standard and define a global process from a security, environmental and operational standpoint.
How are we starting to work with ITAD?
The ITAD industry generally works because an ITAD partner will collect the equipment you no longer need. Then, they will either resell it for future use; repair and resell it; harvest the parts for use in another machine; or recycle them down to their raw materials, some of which are rare and valuable and can be sold. There is more gold in a mobile phone compared to the same weight of gold ore. The sales price is based upon the market value of the equipment, and costs are incurred for the transportation and equipment review.
We decided to do an RFI and find potential suppliers, so we referenced the 2020 Gartner Market Guide for IT Asset Disposition. In total, 32 local and global potential suppliers were evaluated.
The RFI evaluation primarily considered the following:
- Compliance with relevant legislative mandates (for instance, the WEEE Directive, Basel Convention, GDPR, CCPA)
- Ability to evidence that devices have been sanitized, wiped, or destroyed
- Ability to collect IT equipment from Electrolux sites once per year or as required per site
- To demonstrate that the equipment is resold, refurbished, or recycled to avoid landfill or incineration
- Proof of correct material recycling
- Reference customers
We also requested a response to a case study to understand the packaging, transport cost, and processing destinations and to estimate the total financial impact for each site.
Then, we made site visits to the three preferred candidates left in the RFP. The site visits were performed by members of IT, the Chief Information Security Officer, and the Director of Responsible Sourcing. We also visited an electronic waste recycling facility. Although we had researched and understood the growing quantities of this waste, it was insightful to see the enormous quantity of e-waste. Upon asking, we were shocked to learn that what we could see was just from Stockholm from the previous week. The electronic recycling facility in Sweden is often referred to as the Swedish Gold Mine.
Through the RFI and RFP process, we decided to work with one global ITAD partner that matched well with Electrolux’s geographic locations worldwide. We could see that this would significantly reduce unnecessary transportation of used equipment and cost. One prominent financial and environmental cost driver in this process is the logistic costs and the CO2 emissions from transportation, so if it can be limited, the benefits will be higher.
How to deliver ITAD
After selecting the ITAD partner, due to the complexity of the legal requirements, several other parts of the organization had to be involved. Legally, we obtained a global Master Services Agreement. However, local Participation Agreements must be signed for each country between the Electrolux subsidiary and the collection partner company. The Participation Agreement ensures that the local companies apply the conditions of the Master Services Agreement and follow any local laws. Also, because the equipment remains in the country where it is collected for tax reasons, the financial transactions for the cost and income are between the Electrolux subsidiary and the collection partner company.
We have started to prepare to work with it globally in more than 50 different countries where Electrolux has facilities and potentially unwanted IT equipment.
A major challenge of starting with ITAD is identifying the quantity and type of unwanted equipment we have. Typically, it is placed in drawers, cupboards, and storerooms for several years, unlogged and forgotten about – it only becomes a problem when the storage room is full.
Once the partner has been selected and contracted, more activities are required to be able to deliver a successful ITAD program:
- Everyone in the organization uses some form of IT equipment and will therefore have unwanted equipment at some point due to it being broken or upgraded
- Everyone should understand that this is not waste that should be discarded or thrown in a drawer, but that it is an asset with value and should be retained and stored for sale to the ITAD partner
- The internal culture and awareness around ITAD should be upheld
- To help this education, at Electrolux, we have also extended the collection to cover not just company equipment but also personal equipment from employees’ homes
Organizational needs
To coordinate the work and the rollout, a central coordinator was identified for the following reasons:
- To learn the practical issues of the new process to share and advise each country and track and report on the progress
- To be the primary contact for the global ITAD partner
- To track and report on the outcomes
- To set internal guidelines on what/when/how
- To provide a financial oversight
A local responsible person for ITAD at each site needed to be identified, where they have the responsibility to do the following:
- Collect and store unwanted equipment
- Ensure any necessary information security tasks are performed
- Book the collection by the ITAD partner at the appropriate time when a reasonable amount of equipment has been gathered
Benefits of ITAD
A standard and typical ITAD process bring many benefits:
- Prolongs the lifetime of the assets by reselling
- Carbon saving of the hardware inventory by about 50% per collected unit
- Ensures this type of equipment is handled and stored in a secure way
- Ensures correct refurbishment, repurposing, and disposal by material recycling (zero waste)
- Internal engagement, with a demand for involvement and willingness for education and spreading awareness
- Possibility to make a profit
The journey that Electrolux has taken while being present in 120 markets worldwide goes to show that it is possible to have a global approach to IT asset disposition, introducing a second life when they have reached end-of-use within a corporation but also ensuring safe management and disposal when they have reached end-of-life, creating a circular closed loop back into raw materials. In the next section, we will look closely at the global IT hardware providers to understand their sustainability commitments and how you can leverage their strengths and weaknesses to become a sustainable enterprise.
Choosing a sustainable IT hardware provider
In this section, we will take a closer look at the sustainability commitments of the top six computer vendors by the number of units shipped in 2021 (Gartner 2022). Why computer providers? Because your end user computers significantly impact Scopes 2 and 3. In Chapter 8, Leveraging Your Buying Power, we will look at a more general view of what net-zero commitments the technology companies have made. As shown in the following table, roughly 75% of the market is dominated by six vendors, with Lenovo, HP, and Dell claiming the top three spots:
|
Rank |
Manufacturer |
Market Share |
|
1 |
Lenovo |
24.7% |
|
2 |
HP |
21.8% |
|
3 |
Dell |
17.6% |
|
4 |
Apple |
7.6% |
|
5 |
Acer |
7.2% |
|
6 |
Asus |
6.4% |
|
7 |
Other |
14.7% |
Table 6.2 – Top six vendors by number of units shipped in 2021
To dissect their public sustainability commitments, let us look at each vendor in more detail.
Lenovo
Lenovo is a Chinese multinational electronics manufacturing hardware and electronics company founded in 1984 and headquartered in Hong Kong. In 2005, Lenovo accelerated its penetration into foreign markets by acquiring IBM’s computer business, including the ThinkPad laptop and tablet series. By January 2021, Lenovo will be the world’s largest personal computer vendor by the number of units shipped, enjoying almost a quarter of the global market (Gartner 2022). Lenovo’s GHG emission in FY 2019/20, excluding Scope 3, was 150 million metric tons (Lenovo 2020). Supply Chain emissions are roughly nine times larger than their internal emissions (Greenpeace 2017). Renewable energy projects are ongoing, and the company has committed to SBTi targets (Lenovo 2020). In terms of the use of hazardous substances, Lenovo has phased out Brominated Flame Retardants (BFR) and Polyvinyl Chloride (PVC) from all mechanical parts and some laptops, excluding accessories (Greenpeace 2017).
Lenovo has made the following public commitments at the time of writing:
- Cut Scope 1 and 2 emissions by 50% by 2030
- Reduce Scope 3 value chain emissions by 25% by 2030
- Achieve new zero-emissions across Scopes 1 and 2 by 2050
- Renewable energy projects are ongoing, but no official target has been communicated
- Water usage tracked, but no official target has been communicated
- Waste usage tracked, but no official target has been communicated
During the 2022 Russian invasion of Ukraine, Lenovo refused to join the international community and withdraw from Russia. Lenovo remains the only Hong Kong-based company that has not pulled out (Yale University 2022).
HP
HP or Hewlett Packard is an American multinational electronics manufacturing hardware and electronics company founded in 1939 and headquartered in Palo Alto, California. In November 2015, the company was split in two. HP retained the personal computers and printer business, while the enterprise products and services business was spun off into Hewlett-Packard Enterprise (HPE).
HP “aims to be the world’s most sustainable and just tech company—taking urgent action to combat climate change, protect human rights, and accelerate digital equity.” HP is recognized as one of the most sustainable companies in the world. They have received several recognitions, such as number one on Newsweek’s America’s most responsible companies for three straight years, five-time winner of ENERGY STAR partner of the year, and Carbon Disclosure Project (CDP) Triple A-list for climate, water, forest, and leaderboard for supplier engagement (HP 2022). HP has been included in the Dow Jones Sustainability Indices (DJSI) global sustainability indices for nine consecutive years (HP 2020). HP’s GHG emission in 2020, excluding Scope 3, was 44.9 million metric tons of carbon dioxide equivalent (HP Inc. 2021). In terms of the use of hazardous substances, HP has phased out BFRs in their Elite series, and all products, including accessories, are free from PVC (Greenpeace 2017). HP also has several refurbishing and recycling facilities worldwide and DaaS programs. In 2019, Antonio Neri, President and CEO of HPE, stated a few years ago that they would make their entire portfolio available as a service by 2022 (HPE 2019).
HP has made the following public commitments at the time of writing:
- Reach carbon neutrality and zero waste in HP operations by 2025
- Slash value chain GHG emissions by 50% by 2030
- Achieve new zero-emissions across Scopes 1, 2, and 3 by 2040
- Achieve 75% circularity in products and packaging by 2030
- Maintain zero deforestation for HP paper and paper-based packaging and counteract deforestation of non-HP paper used in their products and print service by 2030
- Reduce potable water withdrawal in global operations by 35% by 2025
- Reach zero waste in HP operations by 2025
During the 2022 Russian invasion of Ukraine, HP Inc. announced that they suspended all shipments to Russia (Yale University 2022).
Dell
Dell is one of the largest hardware manufacturers on the planet and has a dominant position in several ICT categories, such as computers and servers. By 2030, Dell has the ambition to offer the market one of the industry’s most sustainable commercial PC portfolios leveraging bioplastics. The ambition is also that by 2030, a minimum of 50% of the material it will use will be recycled or renewable (Dell 2022). Compared to HP, Dell’s sustainability commitments lack meaningful ambition. In their Progress Made accurate FY21 ESG report, it was stated that they tend to focus on their social impact plan for 2030 in favor of their environmental commitments. Nevertheless, Dell has committed to an SBTi. Still, compared to their industry peers, it does not position them as a frontrunner in setting ambitious climate-related goals. Regarding hazardous substances, some Dell products and tablets are free from BFRs and PVC. BFRs and PVC have been banned in mechanical parts and plastic parts in a higher concentration of 25 grams (Greenpeace 2017). It is worth noting that for every product that Dell sold in 2021, only 9.6% was captured for recycling or reuse. Dell is taking steps to prolong the longevity of its products and materials by promoting repair, reuse, recycle (Page Motes 2022). Still, for a company committed to the circular economy, Dell has a long way to go to transition from being a linear to a circular economy company and live up to its 2030 goal to reuse or recycle a product for every new product sold.
Dell has made the following public commitments at the time of writing:
- Cut Scope 1 and 2 emissions by 50% by 2030.
- Achieve new zero-emissions across Scopes 1, 2, and 3 by 2050.
- Source 75% of renewable energy across Dell operations by 2030 and 100% by 2040.
- Water usage tracked, but no official target has been communicated. For example, they wish to reduce freshwater by 25% in Dell locales with high water stress but no target date.
- Waste usage tracked, but no official target has been communicated. Ambition to reuse or recycle a product for every customer purchase by 2030.
During the 2022 Russian invasion of Ukraine, Dell announced that they had suspended all shipments to Russia (Yale University 2022).
Apple
Like Microsoft, Apple is a pioneer in driving the sustainable IT agenda forward, especially within the technology sector. Tim Cook, Apple’s CEO, “is committed to leaving the world better than we found it.” Apple uses 100% renewable energy, including carbon credits, to power its data centers (Apple 2018). Their renewable energy commitment includes retail stores, offices, and co-located facilities in 43 countries. Furthermore, Apple places stringent requirements on their suppliers, especially in manufacturing, which mandates them to power their production with clean energy. So far, they have 213 suppliers committed to that requirement (Apple 2022). However, seven Apple suppliers in China were identified in May 2022 as using forced labor in China, including Uyghur Muslims in Xinjiang (Kastrenakes 2021). To deliver on its promise to leverage 100% renewable energy, Apple is continuously making significant investments in renewable energy projects worldwide in the United States, Japan, Singapore, and China, just to name a few. Apple’s GHG emission in 2020, including Scope 3, was 22.6 million tons (Tiseo 2021).
Apple is also committed to reusing more recycled materials across its products and setting up closed-loop goals. Apple is one of few electronics manufacturing companies free from hazardous substances, such as BFRs and PVC (Greenpeace 2017). Apple has introduced robots such as Daisy to disassemble Apple phones to recover valuable recycling materials (Apple 2022). According to their 2022 Environmental Progress Report, nearly 20% of materials used in Apple products in 2021 were recycled.
Apple has made the following public commitments at the time of writing:
- Net-zero from operations in 2020
- Committed to creating products with a net-zero footprint by 2030
- Use 100% renewable energy in internal operations, including data centers, and are committed to transitioning the entire product supply chain to 100% renewable energy by 2030
- Eliminate plastics in packaging by 2025
- Water usage tracked, but no official target has been communicated
- Waste usage tracked, but no official target has been communicated
During the 2022 Russian invasion of Ukraine, Apple announced that they suspended all sales to Russia (Yale University 2022).
Acer
Acer is a Taiwanese multinational electronics manufacturing hardware and electronics company founded in 1976. Acer provided roughly 7.2% of the global computer market in 2021 in terms of units shipped and is the top six computer vendor in terms of the number of units shipped in 2021. Acer published its first sustainability report in 2005 using the Global Reporting Initiative (GRI) guidelines. Acer has been criticized for not setting targets to reduce GHG emissions as intended in 2010, not meeting Energy Star standards on their products, and scoring low on product criteria such as life cycle management. Since then, in 2012, Acer set carbon reduction goals and renewable energy targets. Acer reports that they have met its 2020 target of reducing carbon emissions worldwide by 60%, including carbon credits (Acer 2021).
In terms of hazardous substances, all Acer’s products are not yet free from BFRs and PVC (Greenpeace 2017). In 2021, Acer introduced the Vero line, a suite of eco-friendly green products made of post-consumer recycled (PCR) plastic and recycled packaging (Acer 2021). Since 2016, Acer has been included in the two global sustainability indices – that is, the Dow Jones Sustainability Indices (DJSI) and MSCI Global Sustainability Index (Acer 2021).
Acer has made the following public commitments at the time of writing:
- Reduce 80% carbon emissions by 2050 from the 2009 baseline
- Acer reports that it has achieved its mid-term target of reducing carbon emissions by 60% by 2020 from the 2009 baseline.
- Committed to achieving 100% renewable energy by 2035
- Water usage tracked, but no official target has been communicated
- Waste usage tracked, but no official target has been communicated
During the 2022 Russian invasion of Ukraine, Acer refused to join the international community and withdraw from Russia (Yale University 2022).
Asus
Asus is also a Taiwanese multinational electronics manufacturing hardware and electronics company founded in 1989.
Asus’s GHG emission in 2020, excluding Scope 3, was 1.2 million metric tons (Asus 2020). The Scope 1 and 2 emissions are low because ASUS has no assembly plants. Scope 3 from the supply chain is 862 million tons of CO2 emissions.
Regarding hazardous substances, all of Asus’s products are free from BFRs and PVC, except for cables and connectors (Greenpeace 2017).
Asus has made the following public commitments at the time of writing:
- Reduce 50% of carbon emissions from global operations by 2030
- Committed to achieving 100% renewable energy by 2035
- 30% reduction in carbon intensity by 2025 for critical suppliers
- Commitment to increase the energy efficiency of significant products by 50% by 2025
- Commitment to responsibly source 100% of minerals of tantalum, tin, tungsten, gold, and cobalt from qualified smelters
- Goal to achieve 20% recycling rates from ASUS products by 2025
During the 2022 Russian invasion of Ukraine, Asus at first refused to join the international community and withdraw from Russia. After social media boycotts and pressure from the Taiwanese government, Asus suspended shipments to Russia in mid-March 2022 (Yale University 2022).
IT hardware vendor report cards
Now that we have walked through each IT hardware vendor, let us look at how they stack up against each other regarding their sustainability commitments:
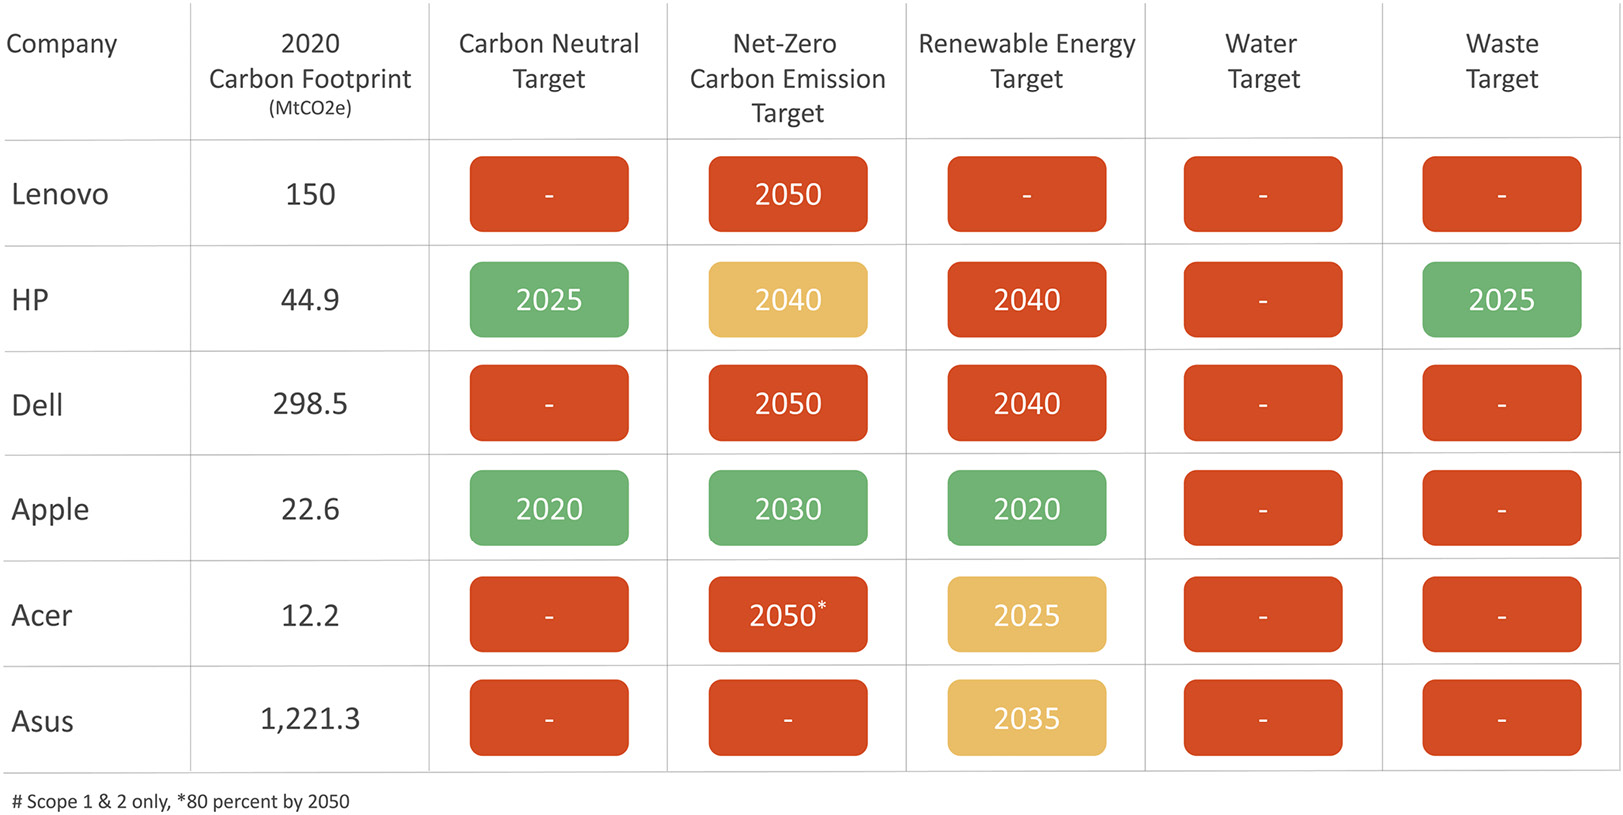
Figure 6.19 – IT hardware sustainability commitment comparison
Unfortunately, most of the vendors fall short in many categories. Only Apple has already achieved carbon neutrality, and HP has committed to achieving it by 2025. The ambition to reach net-zero carbon emission is low across the board except for Apple. Asus also sticks out in the negative sense, where they have only set an ambition to halve their carbon dioxide emissions in 2025 but have not set a net-zero emission target to date. In terms of transitioning to the circular economy, no vendor has set a clear water target despite being in a water intense industry. When it comes to waste, HP is the only vendor with a clear waste target with the ambition to reach zero waste in its operations by 2025.
Understanding our vendor landscape is critical in transitioning to a sustainable IT enterprise. In Chapter 8, Leveraging Your Buying Power, we will examine how procurement is critical to placing stricter environment and social requirements on your vendors. In the next section, we will look closely at some KPIs that can be leveraged to track and monitor your IT hardware.
IT hardware sustainability scorecard
Finally, as we have not gone through the different levers you can use to reduce your carbon intensity, let us look at how we can summarize these critical metrics on an IT hardware sustainability scorecard:
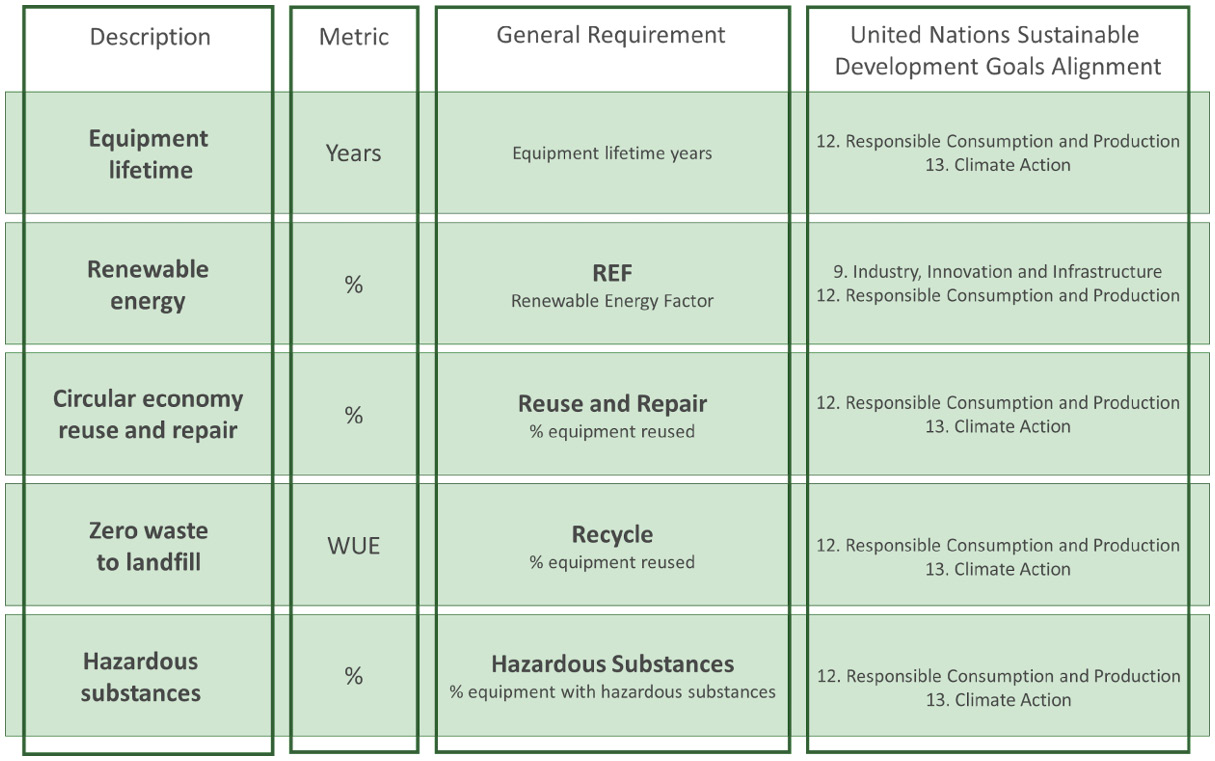
Figure 6.20 – IT hardware sustainability scorecard
Most of the IT hardware manufacturing vendors report % on these KPIs, so it should be easy to compare them. Remember, as roughly 80% of the carbon emissions are already spent before you get your new computer, smartphone, or tablet in your hand, it is essential to understand the impact of your vendor landscape and how you can work collectively to reduce the environmental and social impact. In Chapter 8, Leveraging Your Buying Power, we will take a closer look at what levers are available to place stricter environment and social requirements on your vendors.
Summary
In this chapter, you learned how to work with your IT hardware to positively impact social and environmental aspects and reduce costs. As an introduction to this topic, you learned how you can reimagine your approach to managing your IT hardware by exploring different opportunities. By now, you should understand the impact of IT hardware equipment and the most significant environmental impacts during the life cycle. Finally, you should better understand circular IT hardware management and what is required from your IT enterprise and your vendors to transition from a linear to a circular economy.
To conclude this chapter, let us look at the key recommendations from this chapter:
- Procure hardware with a minimum life cycle carbon cost, socially responsible supply chain, and sustainably sourced raw materials.
- Explore opportunities to buy refurbished IT equipment to save on carbon costs.
- Demand Energy Star, EPEAT, and TCO Certified labeled IT hardware to reduce both operational cost and carbon emissions.
- Leverage both social and environmental requirements from, for example, TCO Certified or EPEAT in your RFIs, RFPs, Master Service Agreements (MSAs), contracts, and supplier code of conduct.
- Extend the possibility to extend the IT hardware life cycle policy to 4, 5, or even 6 years.
- Explore the ITAD industry, which can enable circularity through reuse, refurbishment, and remarketing.
- Auto switch-off hardware when not in use to preserve energy.
- Understand the share of renewable energy in your office locations. Resource management will be further explored in Chapter 7, Energy Resource Management.
- Explore DaaS to save on IT hardware and transfer the workload from client-side to server-side.
- Engage your employees by raising awareness of device carbon footprint and enabling them to make conscious, sustainable choices to reduce carbon costs.
- Introduce refurbished IT hardware such as computers, laptops, and smartphones for ordering into your IT Service Catalog.
Now that we have reached the end of this chapter, you should understand how you can work with your IT hardware to use different levers to impact social and environmental aspects and reduce costs positively.
In the next chapter, we will look at how we can use our scarce resources more responsibly and sustainably, such as energy and water.
Further reading
To learn more about the topics that were covered in this chapter, take a look at the following resources:
- Basel action network: https://www.ban.org/.
- WEEE forum: https://weee-forum.org/who-we-are/.
- Impacts and Insights: Circular IT management in practice. Report on circularity in the IT sector, including 33 hands-on tips on how your organization can move in a circular direction: https://tcocertified.com/2020-impacts-and-insights/.
- The circular economy — an opportunity for more sustainable IT products: https://tcocertified.com/circular-economy/.
- Social responsibility is a challenge in the IT product supply chain: https://tcocertified.com/social-responsibility/.
- Sustainable Electronics Recycling International (SERI)
- https://sustainableelectronics.org/.
- E-Stewards
- https://e-stewards.org/.
Bibliography
- Acer. 2021. “Acer Earthion: our long-term commitment to the environment.” acerforeducation.acer.com. June 04. Accessed May 18, 2022. https://acerforeducation.acer.com/experiences/projects/earthion-commitment-environment/#:~:text=%E2%80%9CAcer%20joins%20over%20300%20of,the%20RE100%20Key%20Collaborator%20Award.
- —. 2021. “Acer Expands Lineup of Eco-friendly Vero Products.” news.acer.com. October 13. Accessed May 18, 2022. https://news.acer.com/acer-expands-lineup-of-eco-friendly-vero-products.
- —. 2021. “Acer Listed on Dow Jones Sustainability Indices (DJSI) for Eighth Straight Year in 2021.” news.acer.com. November 18. Accessed May 18, 2022. https://news.acer.com/acer-listed-on-dow-jones-sustainability-indices-djsi-for-eighth-straight-year-in-2021.
- 2018. Apple. April 9. https://www.apple.com/newsroom/2018/04/apple-now-globally-powered-by-100-percent-renewable-energy/.
- 2020. Apple 12 Product Environmental Report. October 13. Accessed March 13, 2022. https://www.apple.com/environment/pdf/products/iphone/iPhone_12_PER_Oct2020.pdf.
- Apple. 2022. “Apple Environmental Progress Report 2022.” Apple. Accessed May 15, 2022. https://www.apple.com/environment/pdf/Apple_Environmental_Progress_Report_2022.pdf.
- —. 2022. “Apple expands the use of recycled materials across its products.” Apple.com. April 19. Accessed May 16, 2022. https://www.apple.com/newsroom/2022/04/apple-expands-the-use-of-recycled-materials-across-its-products/.
- Asus. 2020. “Operational Footprint | Climate Action.” csr.asus.com. Accessed May 18, 2022. https://csr.asus.com/english/article.aspx?id=1729.
- Capgemini. 2021. Sustainable IT - Why it’s time for a Green revolution for your organization’s IT. Capgemini research institute.
- Carlsson, Rebecka. 2021. Exponentiell klimatomställning. Stockholm: Lava förlag.
- Cunnie, Shawn. 2022. IT Asset Disposition is Critical to Sustainability Goals. January 21. Accessed May 21, 2022. https://www.missioncriticalmagazine.com/articles/93937-it-asset-disposition-is-critical-to-sustainability-goals.
- 2021. Dell Latitude 7420. January. Accessed March 17, 2022. https://www.dell.com/sv-se/dt/corporate/social-impact/advancing-sustainability/sustainable-products-and-services/product-carbon-footprints.htm#tab0=1&pdf-overlay=//www.delltechnologies.com/asset/sv-se/products/laptops-and-2-in-1s/technical-support/latitud.
- Dell. 2019. “Life Cycle Assessment of Dell PowerEdge R740.” Dell.com. Junie. Accessed May 15, 2022. https://www.dell.com/sv-se/dt/corporate/social-impact/advancing-sustainability/sustainable-products-and-services/product-carbon-footprints.htm#scroll=off&tab0=3&pdf-overlay=//www.delltechnologies.com/asset/sv-se/products/servers/technical-support/lca_powe.
- —. 2022. “Progress made real FY21 ESG Report.” Dell. Accessed May 15, 2022. https://www.dell.com/en-ie/dt/corporate/social-impact/reporting/fy21-progress-made-real-report.htm#pdf-overlay=//www.delltechnologies.com/asset/en-ie/solutions/business-solutions/briefs-summaries/delltechnologies-fy21-progress-made-real-report.pdf.
- —. n.d. “Social impact.” Dell.com. Accessed May 15, 2022. https://www.dell.com/sv-se/dt/corporate/social-impact.htm#:~:text=By%202030%20we%20will%20cut,2%20and%203%20by%202050.
- EU Parliament. 2011. “Directive 2011/65/EU of the European Parliament and of the Council of 8 June 2011 on the restriction of the use of certain hazardous substances in electrical and electronic equipment Text with EEA relevance.” eur-lex.europa.eu. June 8. Accessed May 18, 2022. https://eur-lex.europa.eu/legal-content/en/TXT/?uri=CELEX:32011L0065.
- —. 2011. “RoHS Directive.” cemarking.net. June 8. Accessed May 18, 2022. https://cemarking.net/eu-ce-marking-directives/rohs-directive/.
- European Environmental Bureau. 2019. “Coolproducts don’t cost the Earth.”
- Exittechnologies. 2021. IT Asset Disposition: A Review of the Services, Market, and Considerations. September 27. Accessed May 21, 2022. https://www.exittechnologies.com/blog/data-center/it-asset-disposition-overview/.
- Gartner. 2022. Gartner.com. January 12. Accessed May 15, 2022. https://www.gartner.com/en/newsroom/press-releases/2022-01-12-gartner-says-worldwide-pc-shipments-declined-5-percent-in-fourth-quarter-of-2021-but-grew-nearly-10-percent-for-the-year.
- Gill, Victoria. 2021. “Waste electronics will weigh more than the Great Wall of China.” bbc.com. October 13. Accessed May 16, 2022. https://www.bbc.com/news/science-environment-58885143.
- Greenpeace. 2017. “Guide to Greener.” greenpeace.org. Accessed May 18, 2022. https://www.greenpeace.org/usa/wp-content/uploads/2017/10/Guide-to-Greener-Electronics-2017.pdf.
- —. 2017. “HP report card.” greenpeace.org. Accessed May 18, 2022. https://www.greenpeace.org/usa/wp-content/uploads/2017/10/GGE2017_HP.pdf.
- —. 2017. “Lenovo report card.” greenpeace.org. Accessed May 18, 2022. https://www.greenpeace.org/usa/wp-content/uploads/2017/10/GGE2017_Lenovo.pdf.
- HP. 2020. “HP 2020 Sustainable Impact Report.” HP.com. Accessed May 15, 2022. https://www8.hp.com/h20195/v2/GetPDF.aspx/c07539064.pdf.
- HP Inc. 2021. “HP Inc. Announces Ambitious Climate Action Goals.” HP.com. April 20. Accessed May 15, 2022. https://press.hp.com/us/en/press-releases/2021/hp-inc-announces-ambitious-climate-action-goals.html.
- ISWA. 2020. Global E-waste Surging: Up 21 Percent in 5 years. United Nations institute for Training and Research. July 2. Accessed January 27, 2022.
- IT-recycling. 2022. “Environmentally-harmful substances in old computers and computer waste.” it-recycling.nl. Accessed May 16, 2022. https://www.it-recycling.nl/en/it-recycling/computer-components-contain-toxic-substances/.
- Kirchherr, Julian, M.P. Hekkert, and Reike Denise. 2017. “Conceptualizing the Circular Economy: An Analysis of 114 Definitions.” Researchgate.net. September. Accessed May 12, 2022. https://www.researchgate.net/publication/320074659_Conceptualizing_the_Circular_Economy_An_Analysis_of_114_Definitions.
- Lenovo. 2020. “Lenovo Sustainability Combatting Climate Change: Performance.” www.lenovo.com. Accessed May 18, 2022. https://www.lenovo.com/us/en/sustainability-climate-change-performance/.
- Market Research Future. 2021. “IT Asset Disposition Market with COVID-19 impact Analysis By Service Type, Asset Type, Organization Size, End User (Banking, Financial Services, and Insurance (BFSI), IT and Telecom, Healthcare), and Region - Global Forecast to 2026.” www.researchandmarkets.com. April. Accessed May 2022, 2022. https://www.researchandmarkets.com/reports/5318361/it-asset-disposition-market-with-covid-19-impact?utm_source=GNOM&utm_medium=PressRelease&utm_code=h3l493&utm_campaign=1535256+-+Global+IT+Asset+Disposition+Market+(2021+to+2026)+-+Strategic+Partnerships+a.
- Mendoza, N.F. 2020. “Global e-waste is up 21% in 5 years, causing serious environmental harm.” techrepublic.com. July 14. Accessed May 21, 2022. https://www.techrepublic.com/article/global-e-waste-is-up-21-in-5-years-causing-serious-environmental-harm/.
- Microsoft. 2021. “Ecoprofile Surface Pro 8.” Microsoft. Accessed May 12, 2022. https://www.microsoft.com/en-us/download/confirmation.aspx?id=55974&6B49FDFB-8E5B-4B07-BC31-15695C5A2143=1.
- Morgan, Blake. 2020. Forbes. November 9. https://www.forbes.com/sites/blakemorgan/2020/11/09/10-most-sustainable-consumer-tech-companies/?sh=32ee43c549a8.
- Murray, James. 2012. “EU revamps e-waste rules with demanding new recovery targets.” theguardian.com. Aug 14. Accessed May 21, 2022. https://www.theguardian.com/environment/2012/aug/14/eu-waste.
- 2020. NO TURNING BACK. How the Pandemic as Reshaped Digital Business Agendas. Google Cloud. IDG Communications, Inc.
- Page Motes. 2022. “Repair, Reuse, Recycle: The Circular Economy in Action.” Dell.com. Feburary 22. Accessed May 15, 2022. https://www.dell.com/en-us/blog/repair-reuse-recycle-the-circular-economy-in-action/.
- Potting, José, Marko Hekkert, Ernst Worrell, and Aldert Hanemaaijer. 2017. “Circular Economy: Measuring Innovation in the Product Chain - Policy Report.” PBL.nl. January. Accessed May 12, 2022. https://www.pbl.nl/sites/default/files/downloads/pbl-2016-circular-economy-measuring-innovation-in-product-chains-2544.pdf.
- Royal Society of Chemistry. 2022. “Meet the precious metals.” rsc.org. Accessed May 16, 2022. https://sustainability.rsc.org/meet-the-precious-elements/.
- Ryder, Guy, and Zhao Houlin. 2019. The world’s e-waste is a huge problem. It’s also a golden opportunity. January 24. Accessed July 07, 2022. https://www.weforum.org/agenda/2019/01/how-a-circular-approach-can-turn-e-waste-into-a-golden-opportunity/.
- The Guardian. 2019. Fairphone 3 review: the most ethical and repairable phone you can buy. The Guardian. September 19. Accessed January 27, 2022. https://www.theguardian.com/technology/2019/sep/18/fairphone-3-review-ethical-phone.
- January 24, 2019. “The world’s e-waste is a huge problem. It’s also a golden opportunity.” World Economic Forum. Davos, Switzerland.
- Tiseo, Ian. 2021. “Apple’s GHG emission 2012-2020.” Statista.com. May 2021. Accessed May 15, 2022. https://www.statista.com/statistics/528604/carbon-emissions-from-apple-by-segment/#:~:text=Apple%20Inc%20released%20approximately%2022.6,period%2C%20followed%20by%20product%20use.
- Yale University. 2022. “Almost 1,000 Companies Have Curtailed Operations in Russia—But Some Remain .” som.yale.edu. May 22. Accessed May 21, 2022. https://som.yale.edu/story/2022/almost-1000-companies-have-curtailed-operations-russia-some-remain.