10
Get Started Today
This book takes you through a three-part journey of sustainable IT. In Part 1, we focused on the “why” and the importance of sustainable IT. In Part 2, we focused on “what” different tools can deliver sustainable IT. Finally, as we enter Part 3, which is this book’s final section, we will focus on “how” we deliver sustainable IT. This chapter marks the first of three chapters in Part 3. How do we accelerate sustainable IT? How do we turn ideas into action? What do you need to do to assess your current and future state of sustainable IT maturity? Furthermore, what is required to establish your baseline and your direction of travel toward your target state? In subsequent chapters, we will focus on putting a sustainable IT strategy in place and finally go from strategy to execution. We will start your journey towards a sustainable IT enterprise by delivering global and impactful objectives and key results.
This chapter will focus on pulling all the pieces together by outlining a sustainable IT maturity model© to enable you to determine your current state and set out your future state ambitions. Secondly, you will learn how to establish your current state’s greenhouse gas (GHG) /carbon emission baseline. Establishing a baseline enables you to get valuable insights into your current state. The baseline will guide you towards what action areas should be prioritized and what actions should be taken and simulate your GHG emission target state. This chapter will guide you from first collecting data points on your IT assets, such as data centers, servers, laptops, mobile phones, energy usage, and electronic waste (e-waste) management practices. We will plug the collected data points into the downloadable sustainable IT baseline. Finally, the chapter will finish with how the established baseline can be interpreted and guide you on how to start thinking about formulating an actionable, sustainable IT strategy, which will follow in Chapter 11, Putting a Sustainable IT Strategy in Place.
On the book’s website, www.sustainableITplaybook.com, you can download your own Excel sheet, create your GHG emission baseline, and simulate your target state.
In this chapter, we will cover the following topics:
- Sustainable IT maturity model©
- Understanding impact areas
- Establishing your sustainable IT emission baseline
- Simulating your target state
By the end of this chapter, you will have learned what data points need to be collected to establish a baseline that is as accurate as possible. Secondly, you will have learned how you can leverage this book’s resources to establish your own sustainable IT GHG emission baseline. Finally, you should be able to simulate a target state based on your emission baseline. Our emission baseline and simulated target state will form the basis for the sustainable IT strategy we will cover in Chapter 11, Putting a Sustainable IT Strategy in Place.
The sustainable IT maturity model©
This subsection introduces the sustainable IT maturity model (Sundberg 2021). It is a maturity assessment framework that guides you on your journey to developing a sustainable IT practice. The model is designed to help you, as a technology leader, to identify shortcomings, determine priorities, and establish goals to improve your sustainable IT practice. The sustainable IT maturity model has five levels of maturity: Initial, Repeatable, Defined, Managed, and Optimized. These should be driven by and support enterprise-wide sustainability business goals. Figure 10.1 illustrates the characteristics of each level of the sustainable IT maturity model:

Figure 10.1 – The sustainable IT maturity model©
The maturity assessment framework is one tool to help you evaluate your current capabilities, determine your intermediary and target state, and develop a roadmap toward improved sustainable IT practices and outcomes. It would help if you used the framework to improve processes, governance, organizational models, and performance metrics on your journey to developing a sustainable IT practice. It would also help if you regularly revisited the framework to reassess and track your progress against your established baseline to drive continuous improvement and increase your maturity. The size of the company, corporate culture, sustainability ambitions, industry, and geography influence the maturity level that an enterprise can reach. It does not make sense for most companies to aim for level 5 (Optimized) but rather level 3 (Defined) or level 4 (Managed). Regardless of your ambition level, it will take a wholehearted commitment of time, money, and resources to achieve any level. The higher the level you aim for, the greater the commitment required.
Using the framework will benefit your organization by helping you track your progress over time, giving transparency as to your improvement from your baseline to your desired state, and validating whether investments in new capabilities deliver their expected potential and wanted outcomes. If you are a large company with multiple divisions, you might want to keep track of each division’s progress and present an aggregated view at a group level.
As we saw earlier in the chapter, most organizations have low maturity, with 50% saying that they have an enterprise-wide sustainability strategy. Still, only 18% have a comprehensive sustainable IT strategy with well-defined goals and target timelines (Why it’s time for a Green revolution for your organization’s IT, 2021).
The five dimensions of the sustainable IT maturity model©
The maturity of sustainable IT is assessed based on how the enterprise operates in the five dimensions illustrated in Figure 10.2: commitment, governance, processes and tools, people and organization, and performance management.

Figure 10.2 – The five dimensions of the sustainable IT maturity model
Let us look at each in brief:
- Commitment: Achieved through fulfilling sustainable IT commitments and contributing to overall enterprise-wide sustainability goals.
- Governance: Achieved through clear policies, guidelines, procedures, established baselines, audits, rewards/consequences, and transparent reporting.
- Processes and tools: A set of defined processes and tools to provide efficiency and effectiveness.
- People and organization: Defined roles, responsibilities, accountability, and organizational alignment. Defined upskill criteria and learning paths to ensure stakeholder engagement, awareness, and understanding.
- Performance management: Data collected at the local and group levels, analyzed to report progress between baseline and target state and make necessary adjustments, including comprehensive sustainability reporting.
An organization rarely implements and upholds all dimensions at the same time. These dimensions should guide your organization’s progress through the maturity model. The most important dimension is setting a high level of commitment that will significantly propel your organization toward a sustainable IT practice and minimize environmental impact.
The five maturity levels of the sustainable IT maturity model©
Now, let us take a closer look at the five maturity levels of the sustainable IT maturity model.
Level 1 – Initial
At level 1, sustainable IT is not on the agenda. There are a few or no specified processes for managing your sustainable IT practice. There is a lack of defined or formalized sustainable IT metrics; things are followed up on an ad hoc basis at best. There is also a lack of awareness and understanding within IT and across the entire organization. Sustainable IT is primarily viewed as a cost.
The right approach is left up to individuals, divisions, functions, and departments; therefore, there is limited repeatability. There are no documented processes, policies, or standards for managing sustainable IT practices or determining who has what responsibilities. Each activity is carried out independently, without applying learnings from previous actions.
Level 2 – Repeatable
At level 2, sustainable IT starts to be seen as an area of influence. Processes are established within teams or IT functions, but there is little consistency across the organization. In this model, we use the Capability Maturity Model (CMM) term “repeatable” because it indicates that the key activities are being repeated although they have not been formally defined. No current baseline or target state has been determined. No clear objectives and key results have been defined or agreed upon. Awareness and understanding are maturing within the IT function and across the enterprise. However, sustainable IT practices are primarily viewed as a compliance requirement rather than an enabler. There is some alignment with the enterprise-wide sustainability plan, but nothing formalized has been implemented. The sustainability plan is rarely mentioned in sustainability reports and is not part of formalized reporting.
Level 3 – Defined
At level 3, sustainable IT is defined and is starting to be viewed as an enabler. Processes are established, and a central organization for coordination or decision-making exists. A set of guidelines, policies, and procedures exists, and minimal rework is required. Clear objectives and key results are defined, and sustainable IT is driven as a strategic initiative. A current baseline and a target state have been established, agreed upon, and communicated. A plan exists, and steps are taken to close the current baseline and target state commitment gap—mature awareness and understanding within the IT function and the enterprise. Sustainable IT is now connected to the overall sustainability plan. The comprehensive sustainability plan is mentioned in sustainability reports and is part of the formalized reporting.
Level 4 – Managed
At level 4, sustainable IT is embedded in the overall IT delivery. Sustainable IT is a critical enabler and a source of innovation for new sustainable products and solutions. A set of measures exists to determine gaps in processes and to find out whether performance is secure or adjustment is needed. The current baseline and target state are tracked and reported on in a standardized way. A multi-year plan exists, and significant progress has been made from the initial baseline to the target state. There are learning paths in place to raise awareness and skill levels. There is maturing agility throughout the organization in response to changes in the desired business outcome and value.
Sustainable IT is now fully integrated into the overall sustainability plan. Through fully embedded comprehensive sustainability reporting, minor adjustments are being made to improve performance and transparency.
Level 5 – Transformative
At level 5, sustainability by design has been fully embedded into the overall IT delivery. Sustainable IT has become a competitive advantage and contributes significantly to the organization’s financial performance through new and improved revenue streams. There is solid executive support, and compensation is tied to sustainability goals. Limitations are known, and there is clear accountability and responsibility for continuous improvement. The gaps between the current baseline and target state have been closed, and a new ambitious target state has been set out—strong awareness and understanding within the IT function and the enterprise. There is high agility throughout the organization in response to changes in the desired business outcome and value.
The path to sustainable IT
To set your path to a sustainable IT practice, it is recommended that you follow a four-step process to assess your current state, set your ambition toward your target state, compare your current and target state, and finally, set the direction of travel. Figure 10.3 outlines some critical questions you should ask yourself as you walk through each process step.
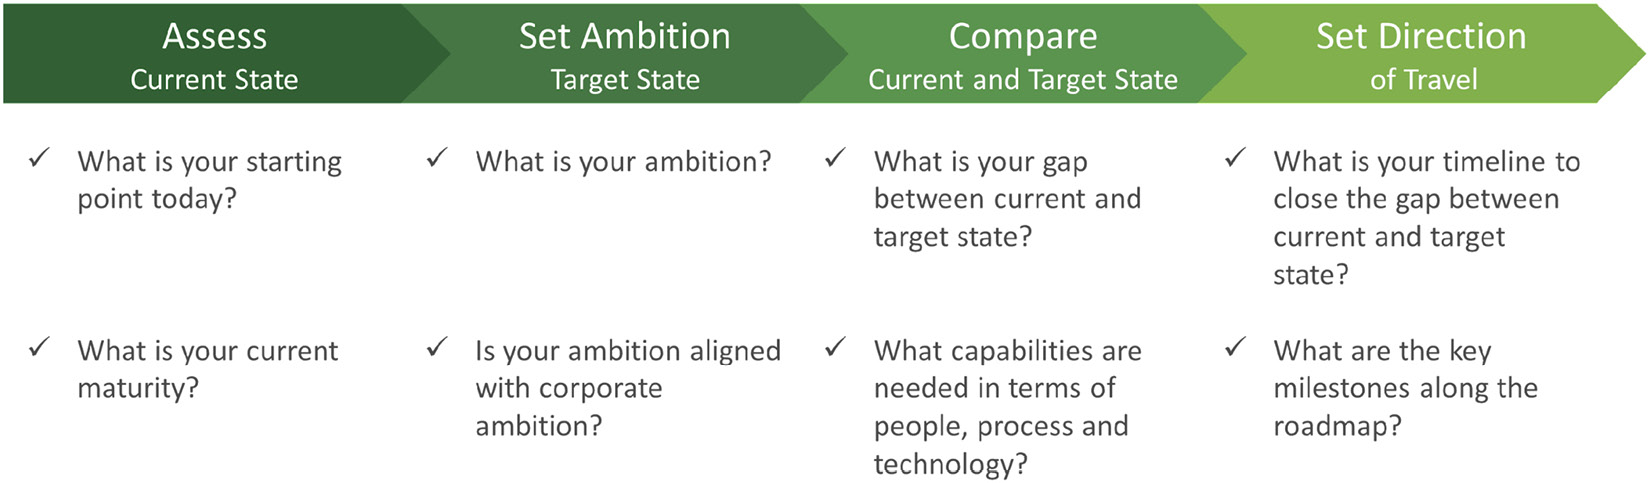
Figure 10.3 – The path to sustainable IT
Sustainable IT maturity model assessment
Now that we have introduced the sustainable IT maturity model©, the five dimensions, and the requirements for each level, it is time to put the model into practice. Figure 10.4 illustrates how you can illustrate your baseline and target state along the five dimensions.

Figure 10.4 – Sustainable IT maturity model assessment example
As you start your journey, you can also include a current state marker to show your progress toward your target state. Establishing current and target states and associating progress with executive compensation is a powerful tool to get things moving in the right direction.
If you are a large corporation with many divisions or business areas, it may also make sense to track overall progress at a division level. Figure 10.5 illustrates how you can track progress as a group and at a division level toward your baseline and against your target state ambition.
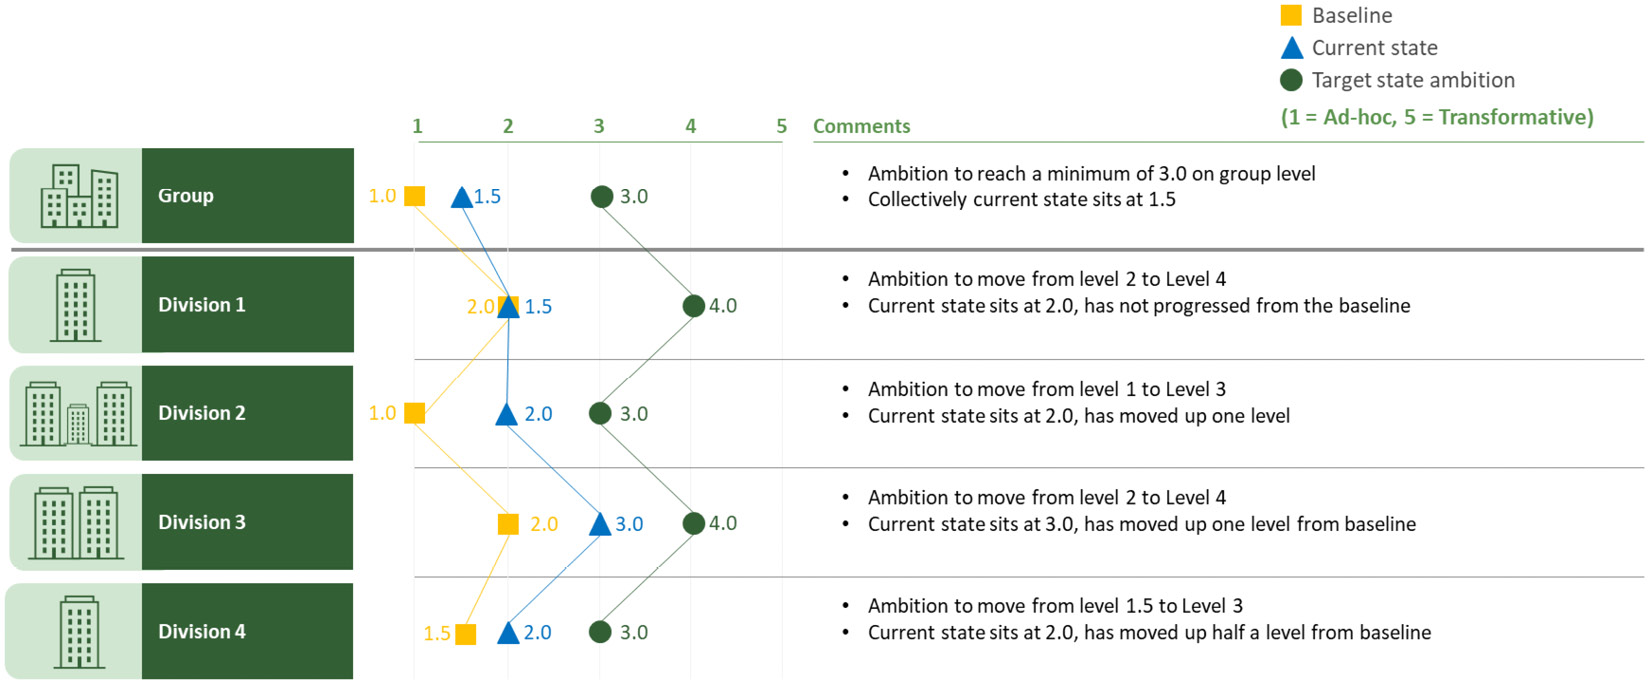
Figure 10.5 – Large corporation’s sustainable IT maturity model assessment example
In this section, we examined how you can leverage the sustainable IT maturity model to conduct an assessment, both on an individual unit and multiple units, to determine your current and target states. We now shift gears, and in the following sections of this chapter, we will focus on establishing a GHG/carbon emission baseline and simulating our desired target state 8-10 years from now.
Understand impact areas
Back in 2010, Christina Figueres, the former executive secretary of the UN Framework Convention on Climate Change and chief architect behind the 2015 Paris agreement, said that “the Carbon Disclosure Project (CDP) is to the future of business what the X-ray was to the future of medicine – without it, doctors could never see the inside of a patient’s health.” Establishing a GHG emission baseline gives you the necessary insights into your IT organization’s climate health and what necessary actions you need to take to transition into a sustainable IT enterprise. In this section, we will take a closer look at what you need to know to assess your impact through a top-down assessment. Suppose you are not interested in how I calculated these numbers, and you are just interested in getting started with your carbon emission baseline. In that case, I recommend you skip ahead to the next section. The numbers presented in this chapter are fictional, but they are a pretty good representation of a real company.
The following diagram shows a sample of a GHG emissions baseline built up by four focus areas – data center and cloud, IT hardware, end user energy management, and IT asset disposition (ITAD):

Figure 10.6 – GHG emissions baseline example
The first three categories – data center and cloud, IT hardware, and energy management – are, first and foremost, GHG emitters and ITAD should hopefully enable us to recover GHG emissions through circular IT hardware management in the end-of-use/end-of-life phase. Each category sums up a total GHG emission baseline. Later in this chapter, we will detail how you can calculate your baseline.
These four key focus areas are not an exhaustive list, but as we go through the process, you will hopefully see that they can capture most of your enterprise’s GHG emissions. Individual applications have been included in the Data center and cloud section. Suppose you aim to measure and improve individual applications over time. In that case, I recommend reverting to Chapter 5, Application and Data, for more details on establishing near real-time feedback. One area that has been left out is the network because it requires detailed data points for each network node to calculate inbound and outbound data and location carbon intensity. Later in this chapter, we will examine how it can be scientifically done if needed. For example, if you are an ICT company, including network traffic in your calculations is highly relevant since it is part of your core business.
Let us look at each key focus area in detail to understand what parameters are required to calculate the GHG emissions per area.
Data center and cloud
To calculate an emission baseline for data center and cloud, we primarily need to focus on the following factors:
- Location – carbon intensity per region
- Power usage effectiveness (PUE)
- Percentage of virtual CPUs
- Server utilization rate (CPU usage)
- Hardware-specific energy consumption
In the following subsections, we will take a closer look at each factor.
Location – carbon intensity per region
Whether you run your data center and cloud workload on fossil fuel or carbon-free emission (CFE), this has a significant impact on your carbon emission. As we learned earlier in this book, according to the International Energy Agency (IEA), the global average carbon intensity of electricity generated is 475 gCO2/kWh (IEA 2019). With 100% low-carbon energy, you can get down to as low as 21 gCO2/kWh, roughly a 22 times improvement on the global average. Figure 10.7 shows a carbon intensity map for Europe:

Figure 10.7 – Europe carbon intensity map snapshot courtesy of Electricitymaps.com
Here, we can see that low-carbon energy with a carbon intensity under 150 gCO2/kWh is available in the Nordic countries, Denmark, Iceland, Finland, Norway, and Sweden but also in France and Lithuania. The low-carbon factor is primarily due to the availability of renewable energy sources such as wind, hydro, and solar but low-carbon energy from nuclear. Countries with a high carbon intensity of over 600 gCO2/kWh are Poland, Bosnia and Herzegovina, and Kosovo. Their high carbon intensity is primarily due to the high concentration of coal and the limited availability of renewable or low-carbon energy. As mentioned in Chapter 7, Energy Resource Management, the geopolitical uncertainty in the world, especially with the war in Ukraine (at the time of writing), the energy supply has become a critical issue threatening to set a European energy crisis in motion. This could potentially lead countries to re-open closed coal plants, which will significantly raise their carbon intensity.
For the calculations, we will stick to a low (21 gCO2/kWh), medium (475 gCO2/kWh), and high (600 CO2/kWh) scenario, but if you are interested in the specific carbon intensity within a region, I would recommend visiting Electricity maps (https://app.electricitymaps.com/map) for additional details.
Power usage effectiveness
As we learned in Chapter 4, Data Center and Cloud, the second-largest factor contributing to your carbon emission is the data center’s energy consumption. Energy consumption is a closely watched indicator of environmental sustainability. High-efficiency gains are necessary to meet the constantly growing demand due to digitization to prevent energy consumption from rising quickly.
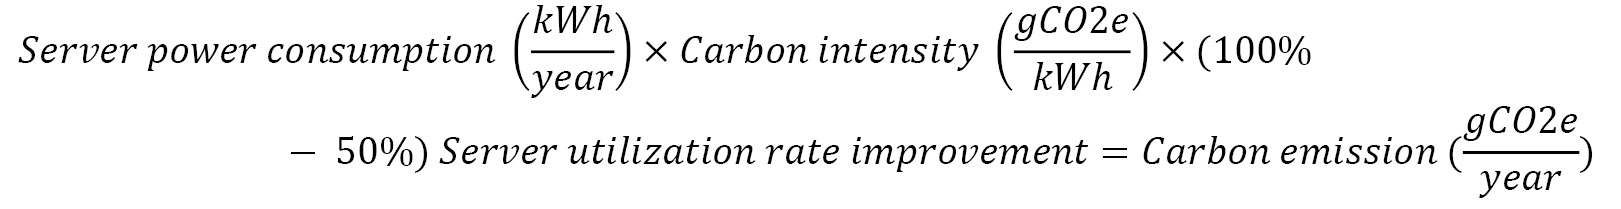
The Green Grid organization has introduced a few key benchmarks, and the most used is Power Usage Effectiveness (PUE) (Brady, et al. 2013). PUE is the total electrical power supplied to the data center divided by the power consumed by IT equipment:
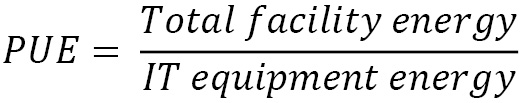
The lower the PUE value, the more efficient the data center is. A PUE close to 1.0 is ideal. The following diagram shows the relationship between the total facility power and the IT equipment power and what components are powered in the respective categories:

Figure 10.8 – Power Usage Effectiveness (PUE)
As we learned in Chapter 4, Data Center and Cloud, the average data center sits at around a PUE of 1.65, which means it has an overhead of 65%. In an average small data center, the PUE sits at 2.0, which means a staggering 100% overhead is wasted (Khaliq uz Zaman, et al. January 2019). However, the problem is primarily centered around the utilization of the data center and not so much around the energy spent. Therefore, a data center with poor PUE could improve its numbers by optimizing existing workloads or adding additional workloads. Other common approaches, as highlighted in detail in Chapter 4, Data Center and Cloud, include more efficient cooling systems, heat reuse, eco-design for infrastructure efficiency, and software virtualization (European Commission 2020). Utilizing cloud “hyper-scalers” only generates an overhead between 1.10 to 1.15 PUE, which means only 10% to 15% of the energy will go to waste.
A study by 451 Research commissioned by Amazon Web Services (AWS) found that AWS is 3.6 more energy efficient than the average US data center and up to five times more energy efficient than a European data center (451 Research 2019). The study primarily points out three factors why AWS infrastructure is more carbon efficient:
- More efficient servers and higher server utilization
- More efficient data center facilities
- Reduced electricity consumption and higher renewable energy usage
A word of caution: the study is highly dependent on the specific data centers considered in the dataset. It is improbable that an old AWS data center is more energy efficient than a state-of-the-art data center leveraging the latest approaches for energy efficiency. Other cloud hyper-scalers, such as Microsoft, have claimed that they can save customers as much as 93% in energy efficiency and as high as 98% in carbon efficiency (Microsoft News Center 2018).
In our calculation, to distinguish between a traditional on-premise data center and a cloud vendor, we will keep our assumptions a bit more conservative and assume that a cloud vendor is 50% more efficient than an average on-premise data center. This also considers the more minor, non-hyperscalers, which might have low energy efficiency rates.
Percentage of virtual CPUs
The very nature of cloud computing is that the resources should be shared and virtualized to improve utilization and energy efficiency. However, for a traditional on-premise data center, the virtualization factor can differ significantly from no virtualization to a high level of virtualization, depending on where you are on your modernization journey. The following diagram shows an example of moving from physical server hardware to virtual server hardware:
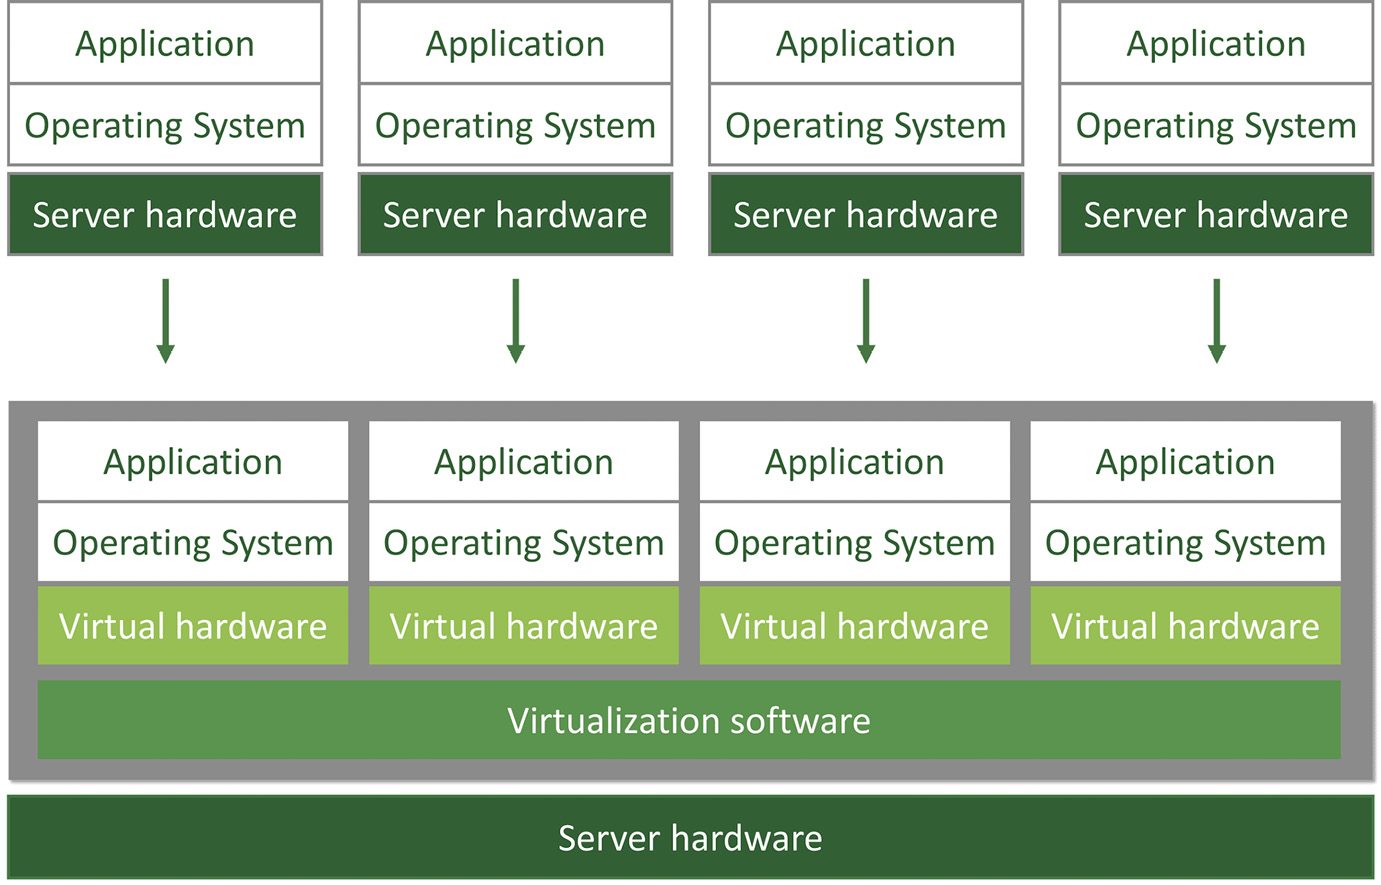
Figure 10.9 – From hardware to software virtualization
In the preceding example, four physical servers running standalone operating systems and applications are virtualized onto one server using virtualization software. Instead of running four physical servers, you have one physical server and four virtualized hardware running the same standalone operating system and applications in isolation.
For our calculations, we have assumed no virtualization in on-premise data centers, 25% in global data centers, and 50% in the cloud. Based on your virtualization grade within your environment, you should be able to determine what categories are feasible for you.
Server utilization rate (CPU usage)
In a typical on-premise data center, the server utilization rate is typically 15%, whereas a large cloud provider can achieve a 65% utilization rate (Delforge and Whitney 2014). Similar to the PUE, I have chosen to take a conservative approach and apply a 25% utilization rate improvement for a global data center and a 50% utilization rate improvement for a large-scale cloud provider to an on-premise data center.
Hardware-specific energy consumption
Chapter 2, Rise of Sustainable IT, covered definitions for emission scope. Whether the server is hosted in the cloud, in an owned or outsourced data center, or even in a small closet in a local office, this has an impact on your energy efficiency and whether your emissions fall under Scope 2 or Scope 3. We could come up with several hosting variations, but to keep it simple, I decided to limit myself to nine categories based on three types and three carbon intensities:
- On-premise or data center server using high-carbon energy
- On-premise or data center server using average-carbon energy
- On-premise or data center server using low-carbon energy
- Outsourced data center server using high-carbon energy
- Outsourced data center server using average-carbon energy
- Outsourced data center server using low-carbon energy
- Cloud servers using high-carbon energy
- Cloud servers using medium-carbon energy
- Cloud servers using low-carbon energy
By low-carbon, we refer to fossil-free electricity, which does not contribute to GHG emissions and includes renewable energy such as wind, solar, geothermal, and nuclear energy. We have not taken into consideration the carbon footprint from the construction and maintenance of building these renewable energy sources or nuclear plants. We consider them to have a low-carbon emission impact. Also, as a side note, the effects of using nuclear energy can be debated, but for carbon emissions, compared to fossil fuels, their impact is negligible. Low carbon is anything below 200 grams/kWh, medium ranges between 200-500 grams/kWh, and high carbon is above 500 grams/kWh.
Now that these nine categories have been established, let us look at their scope impact. As illustrated in Table 10.1, we can see that only our own owned on-premise and data centers fall into Scopes 1 and 2. Any server running in an outsourced data center and cloud falls under Scope 3. This is a critical point to understand for your entire scope. For example, moving your workload from on-premise or your data center into the cloud impacts the dynamics of your entire value chain from Scopes 1 and 2 to Scope 3. They are equally important, but we must pull different levers to achieve our objectives:
|
Category |
Scope 1 |
Scope 2 |
Scope 3 |
|
Own on-premise or data center server |
√ |
√ | |
|
Outsourced data center server |
√ | ||
|
Cloud provider |
√ |
Table 10.1 – Scope impact per category
For the hardware-specific energy consumption calculation, we will use the same Dell PowerEdge R740 Server referenced in Chapter 6, IT Hardware Management (Dell 2019). We assume an expected lifetime of 4 years. According to Dell’s product carbon footprint calculation, leveraging the Product Attribute to Impact Algorithm (PAIA) developed in the Massachusetts Institute of Technology (MIT) Materials Systems Laboratory, the estimated product’s carbon footprint is 8,649 kgCO2e. 15.2% constitutes manufacturing, 0.4% from transportation, 0.1% from end-of-life, and the majority, 84.3%, is spent during the use phase.
According to Dell’s specifications, the yearly energy demand for the server is 1,760.3 kWh/year. In our calculation, we will consider whether the server is running on low- or high-carbon energy. In any instance, we will consider the emissions from hardware production.
Let us do some calculations to determine the carbon emission for different scenarios:
Yearly carbon emission from the production of servers:


Server virtualization rate in the global data center:
As stated in the Percentage of virtual CPUs section, we assume that only 75% of server capacity is needed when running in a global data center setup:


Server virtualization rate in the cloud:
As stated in the Percentage of virtual CPUs section, we assume that only 50% of server capacity is needed when running in a cloud hyper-scaler setup:


We have now calculated the yearly carbon emissions for manufacturing the server, which are as follows:
- On-premise server from manufacturing:

- Global data center server from manufacturing:

- Cloud server from manufacturing:

Now, let us calculate the yearly carbon emissions to power the server. We know the yearly energy demand for the server is 1,760.3 kWh/year. We assume a carbon intensity of 21 gCO2/kWh for powering the server in a low-carbon environment. For a high-carbon environment, we assume the IEA global average carbon intensity of electricity generated is 475 gCO2kWh. If the location of your servers is known, it might be a good idea to reference the carbon intensity from https://app.electricitymaps.com/.
On-premise server emission from power consumption:

Global data center server emission from power consumption:
As stated previously, we assume a 25% improvement in server utilization rate (CPU usage) for a cloud server and apply the factor to the formula:

Cloud server emission from power consumption:
As stated previously, we assume a 50% improvement in a cloud server’s server utilization rate (CPU usage) and apply the factor to the formula:
On-premise server emissions from low-carbon power consumption:

On-premise server emissions from average-carbon power consumption:

On-premise server emissions from high-carbon power consumption:

Global data center server emissions from low-carbon power consumption:

Global data center server emissions from average-carbon power consumption:

Global data center server emissions from high-carbon power consumption:

Cloud server emissions from low-carbon power consumption:

Cloud server emissions from average-carbon power consumption:

Cloud server emissions from high-carbon power consumption:

If we summarize all nine calculations, we get the following table:
|
Category (kgCO2/Year) |
Low-Carbon |
Average-Carbon |
High-Carbon |
|
Own on-premise or data center server |
37 |
836 |
1056 |
|
Global data center server |
27.7 |
627 |
792 |
|
Cloud provider |
18 |
418 |
528 |
Table 10.2 – Server emissions from power consumption
Now that we have calculated server emissions for yearly power consumption, we can conclude that there is a massive difference – a 22 times improvement between running in a low-carbon environment as opposed to running in an average-carbon environment and a 28.5 times improvement between running in a low-carbon environment as opposed to running in a high-carbon environment.
Finally, to calculate a server’s total emission per year, we need to add the embodied emissions from manufacturing (Scope 3) and your power consumption (Scope 2 or Scope 3) together to get the total emissions per year. Here, we assume that all servers have been manufactured with the global average carbon intensity of 475 gCO2/kWh.
The total server emission can be calculated as follows:
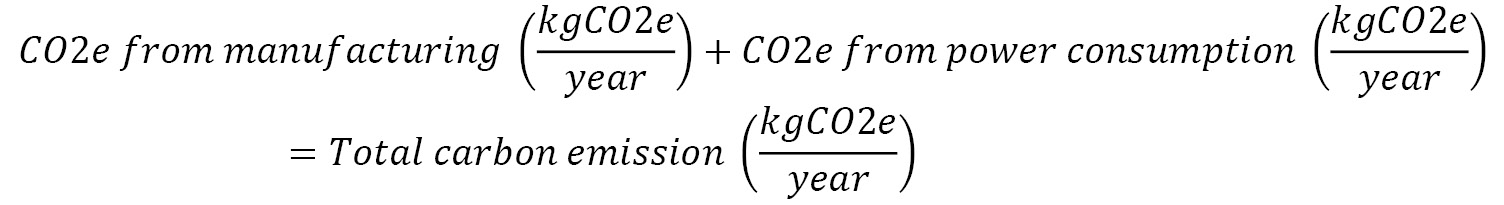
Note that from a carbon accounting perspective, it is essential to keep them separate; therefore, we must calculate our Scope 2 from power consumption and our Scope 3 embodied carbon separately:
Total on-premise emissions from low-carbon power consumption:

Total on-premise emissions from average-carbon power consumption:

Total on-premise emissions from high-carbon power consumption:

Total global data center emissions from low-carbon power consumption:

Total global data center emissions from average-carbon power consumption:

Total global data center emissions from high-carbon power consumption:

Total cloud emissions from low-carbon power consumption:

Total cloud emissions from average-carbon power consumption:

Total cloud emissions from high-carbon power consumption:

In the following table, these calculations have been sorted and categorized into the proper scope and summarized:
|
Server Emissions Table (kgCO2e/Year) |
Scope 1 |
Scope 2 |
Scope 3 |
Total |
|
On-premise emissions, low-carbon power consumption |
37 |
329 |
366 | |
|
On-premise emissions, average-carbon power consumption |
836 |
329 |
1,165 | |
|
On-premise emissions, high-carbon power consumption |
1,056 |
329 |
1,385 | |
|
Global DC emissions, low-carbon power consumption |
275 |
275 | ||
|
Global DC emissions, average-carbon power consumption |
874 |
874 | ||
|
Global DC emissions, high-carbon power consumption |
1,039 |
1,039 | ||
|
Cloud emissions from low-carbon power consumption |
183 |
183 | ||
|
Cloud emissions from average-carbon power consumption |
583 |
583 | ||
|
Cloud emissions from high-carbon power consumption |
693 |
693 |
Table 10.3 – Server emissions table
IT hardware
This category primarily focuses on an end user product procured from a vendor, which is your Scope 3 and is commonly referred to as embodied carbon. Since the energy from your end user products resides in Scope 2, I have decided to keep it separate for clarity. In Chapter 6, IT Hardware Management, we took a closer look at ways to limit your IT hardware, and we also looked closer at three specific end user products – a laptop, smartphone, and tablet – and their life cycle assessment (LCA) from three different vendors – Dell, Apple, and Microsoft. Since we covered where the emissions originate from in the different phases (make, transportation, use, and end-of-life) previously, we will not cover this in detail in this chapter. However, we will introduce additional end user products from some vendors that you can choose from when you establish your carbon emission baseline.
More details are also available on this book’s website: www.sustainableITplaybook.com. The list of products will be continuously updated as new data points become available.
Energy management
In this category, we cover anything related to energy management in your Scope 2. This category primarily focuses on end user devices such as computers, smartphones, tablets, monitors, printers, and more. As we learned in Chapter 7, Energy Resource Management, energy consumption is the most significant contributing factor to reducing your carbon emission over time. Therefore, it is essential to understand your energy usage from your IT assets and take remediating actions.
To retrieve the energy consumption for the devices and calculate carbon emission, we will use the energy consumption calculations from Chapter 7, Energy Resource Management, summarized in Table 7.2. Refer to the Data center and cloud section for server calculations:
|
ICT Device |
Energy Consumption (kWh) |
Carbon Emission Low-Carbon (kgCO2/Year) |
Carbon Emission High-Carbon (kgCO2/Year) |
|
Notebook (Low) |
110 kWh |
2.3 |
50 |
|
Notebook (High) |
220 kWh |
4.6 |
100 |
|
Desktop |
440 kWh |
9.2 |
210 |
Table 10.4 – Summary of yearly energy consumption and carbon emissions of ICT devices
To calculate the carbon emission for low-carbon and high-carbon, we have used the same reference points we used previously. There should be no surprise here either that there is roughly a factor of 20 between low-carbon and high-carbon.
IT asset disposition
The disposal of IT equipment poses a significant threat to the environment. The volume of e-waste generated worldwide in 2021 was roughly 57 million metric tons, equivalent to 125,000 jumbo jets or the weight of the entire Great Chinese Wall (Gill 2021). The United Nations refers to it as a “tsunami of e-waste” (Ryder and Houlin 2019). Unfortunately, e-waste has become the fastest worldwide waste stream, expected to grow to 75 million metric tonnes by 2030.
As we learned in Chapter 6, IT Hardware Management, a large proportion of discarded equipment is not wasted. For this reason, the ITAD industry was created, focusing on the acquisition, reuse, repair, and disposal of unwanted IT equipment, predominantly from commercial companies, in a safe and environmentally responsible way.
Essentially, the ITAD industry tries to address three critical environmental impacts:
- Avoid GHG emissions through responsible recycling
- Recycle critical metals and minerals
- Divert hazardous substances from landfills and improper dispersal
As an organization, besides properly managing your IT equipment at its end of use, turning your ITAD process from a cost center into a profit center is also an opportunity to do carbon savings from refurbishing and recycling. As we’ve already learned, once an IT asset has been born, the best way to minimize the manufacturing phase’s carbon footprint is to keep it in use for as long as possible. Extending the product life cycle does not only cut carbon emissions but can also significantly impact your bottom line by reducing costs.
Some ITAD vendors claim that you can receive 50% carbon emission savings for what has been released in the manufacturing phase. This, of course, varies depending on the age of the IT asset and whether it can be refurbished or recycled. Also, at the time of writing, there are no industry guidelines or benchmarks for carbon savings during the ITAD process. Some vendors even offer carbon credits. For example, CO2neutral, a Canadian-based company, offers Canadian Standards Association (CSA) verified carbon credits for your IT asset returns, but this is far from standard practice across the industry. Therefore, I prefer a more conservative approach to our calculations and set the carbon saving rate at 30%.
If we refer to our example from Chapter 6, IT Hardware Management, and the LCA example of the Dell Latitude 7420 notebook, which emits 341 kgCO2e ± 81 kgCO2e (Dell Latitude 7420 2021) over its expected 4-year lifespan, where the manufacturing represents 85.9% of total emissions, this equates to 292 kgCO2e of the total. With our assumptions about our carbon saving of returning the notebook to a reputable ITAD vendor, we would receive 87.6 kg CO2 equivalent in saving for a single unit.
Network traffic
As mentioned previously, we will not consider network traffic when establishing our baseline since it requires capturing the data transmission across our network. Also, with the increase of cloud applications, it is not an easy task to estimate with high certainty the network traffic that is transferred outside your corporate network.
There are several factors to be considered, including the following:
- Packet size
- Data volume
- Distance data must travel
- Number of jumps between network nodes (devices)
- Network device energy efficiency
- Region carbon intensity
- Network protocol
Once we have the energy consumption, we can calculate the carbon emissions. However, if you are interested in including carbon emissions from your network data, a study has been done by The Shift Project (https://theshiftproject.org/) where they proposed a 1-byte model for estimating how much energy is used when transmitting data. They have proposed a coefficient of 0.0023 multiplied by the total megabytes (MB) of data to get a kWh estimate.
That leaves us with the following formula:

To calculate the energy consumption of transferring 1 GB (1,024 MB), we can use the following formula:

To calculate the carbon emission for the network transmission, we can multiply the energy consumption with the IEA global average carbon intensity of 475 gCO2/kWh; here, we get the following:

The study also suggests that mobile network traffic over a mobile network consumes twice as much energy transferring the same amount of data. It also depends on the network: 2G, 3G, 4G, or 5G. Additionally, next-generation 6G networks will be substantially more energy-efficient. For example, Ericsson, a Swedish multinational networking and telecommunications company, is actively trying to create a future with carbon-neutral networks and zero-energy devices (Gomroki, Mowafy, and Dohler 2022).
With that, we have gone through the critical areas of data center and cloud, IT hardware, energy management, IT asset management, and network traffic and shown how we can capture the carbon emission for each area. In the next section, we will take a closer look at how we can pull everything together into an emission baseline and enable simulation of the target state.
Establishing your sustainable IT emission baseline
Now that we have established an emissions table, you are ready to create a sustainable IT emission baseline and simulate your target state. To do this, you need an accompanying book resource, Sustainable IT Playbook – Emissions Calculator.xslx, which can be downloaded from www.SustainableITPlaybook.com. It would help if you used this resource as a reference to establish your own sustainable IT emission and simulate your target state.
Establishing the emission baseline and simulating your target state follows a seven-step process. Each process step has a logical sequencing, so the recommendation is to follow along stepwise.
This process is outlined in the following diagram:

Figure 10.10 – Emission calculation – a seven-step process
Let us take a closer look at each step in the process in detail.
Introduction
This tool aims to help you get a rough estimation of your emissions and not an exact figure. Arriving at the GHG emission baseline and simulating the future state will be based on several assumptions, including the data quality of your IT assets and predictions going forward. You should use this tool to identify critical areas where it makes sense to start working on reducing your carbon emissions.
Once you are ready to create your baseline and target state simulation, you can either leverage the pre-populated template or start with an empty template. To walk you through the process, we will utilize a model company that you can use as a reference when you establish your baseline. The model company, just like in Chapter 6, IT Hardware Management, will be based on a global manufacturing company with 10,000 employees with business operations worldwide.
Parameters and assumptions
In this process step (the Parameters and assumptions tab), we input information about company identification, company overview, parameters such as year-on-year energy efficiency improvements or IT asset disposition CO2 emission recovery percentage, and assumptions.
In the first dialog box, Company identification, as shown in the following screenshot, fill in the Company name, Number of employees, and a brief Description of the company:

Figure 10.11 – Company identification
In the second dialog box, Company overview, fill in the Business objectives, Business sustainability ambition, IT overview, and Sustainable IT ambition areas. The UN Sustainable Development Goals (SDGs) or EU Taxonomy can provide good starting points for identifying potential ambition themes:

Figure 10.12 – Company overview
In the third dialog box, Parameter, fill in the starting Year, Energy efficiency improvement YoY, and ITAD CO2 emission recovery percentage areas or leave them as they were:

Figure 10.13 – Parameters
In the fourth dialog box, Assumptions, fill in assumptions for Data center and cloud, Application and data, IT hardware, Energy management, ITAD, and Network traffic:

Figure 10.14 – Assumptions
Now that we have filled out the Parameters and Assumptions tabs, we will review our emissions table.
Setting up the emissions table
In this process step, setting up an emissions table (the Emission table tab), we review the populated data and make any adjustments necessary, as shown in the following screenshot. The table is dynamic, so it is easy to add additional rows:
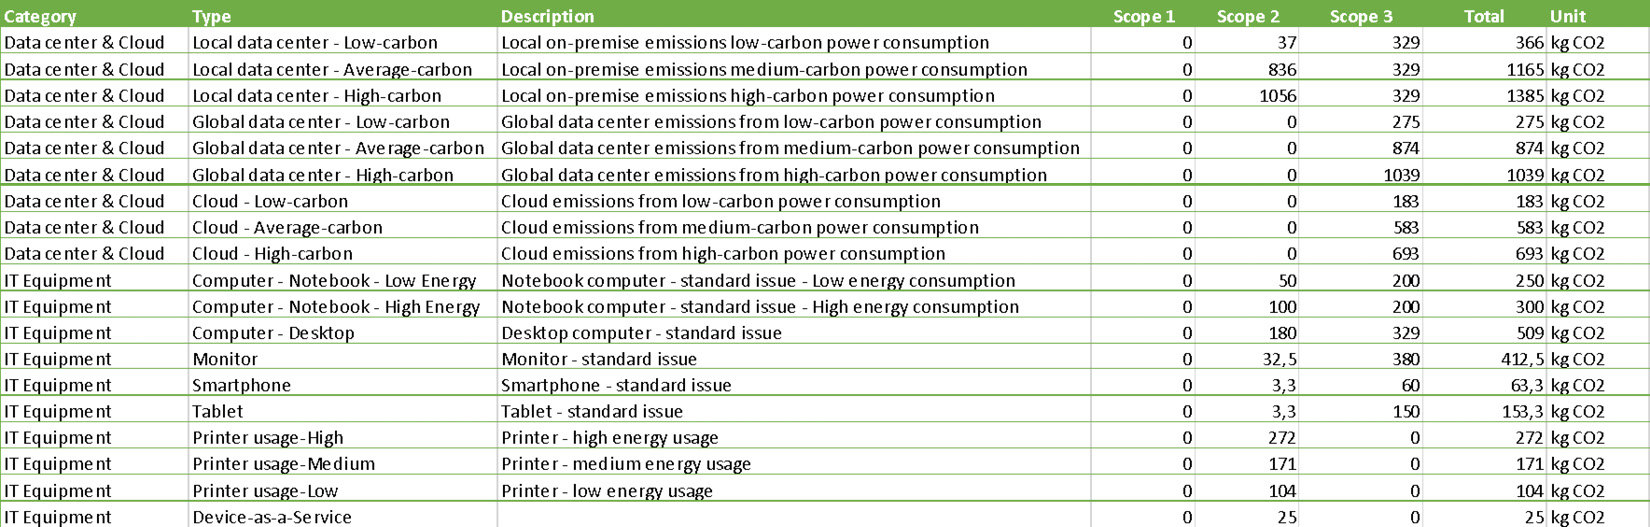
Figure 10.15 – Emission table
If you want to include specific emission data from your vendors, the product finder at TCO Certified (https://tcocertified.com/product-finder/) is an excellent place to start or search for product carbon footprints (PCFs) on your vendor websites.
It is worth noting that Scope 1 has been left empty, and the emission data is primarily populated in Scopes 2 and 3. Remember that Scope 2 is your direct emissions through energy (electricity, heating, and cooling) purchased, while Scope 3 is all other indirect emissions from your vendors, such as outsourcing data center, cloud, or manufacturing of IT hardware.
IT asset registry
In this step (the IT asset registry tab in the spreadsheet), we input the number of IT assets that we currently have per category in column E. Columns F to N are for making simulations to reach your target state emissions, as shown in the following screenshot:

Figure 10.16 – IT asset registry
For a company of 10,000 employees, we have made the following assumptions:
- The company has 3,000 servers, evenly split between on-premise, global data centers, and the cloud. They all reside in high-carbon regions, which is not uncommon. We assume that new data center equipment has been bought this year.
- Every employee has a company-issued computer and a smartphone. Every employee, on average, has been issued 1.5 monitors, and 3,000 have a company-issued tablet. The split between notebook versus desktop is 80/20. Currently, only high-energy notebooks are used.
- The refresh rate for IT hardware is currently 3 years for notebooks, 3 years for desktops, 4 years for monitors, 2 years for smartphones, and 3 years for tablets.
- The company has 120 locations around the world for its 10,000 employees. At every site, four high-energy printers, six medium-energy printers, and four low-energy printers exist.
- No formal IT asset disposition is done at this time, so we leave it blank.
- SaaS applications are not part of the calculation. It is possible to add SaaS applications to the calculation, but at the time of writing, unfortunately, the data is unavailable from the vendors. Several vendors I have spoken with are working on their calculations and looking to make it official, but GHG emission is not readily available.
Emission baseline single year
In this step, (the Emission baseline tab), we have established our single emission baseline, as shown in the following screenshot:

Figure 10.17 – Emission baseline
Here, we can see that, in total, our emission baseline emits 7,650,500 kgCO2e/year or 7,651 tonnes of CO2e/year. Out of the total, 3,117,000 kgCO2e/year stems from cloud and data center, 2,539,500 kgCO2e/year stems from new IT hardware purchases, and 1,994,000 kgCO2e/year stems from EUC energy management; we were unable to recover any carbon credits for ITAD at the time of writing.
To make our results a bit more presentable, the emission baseline is presented in an aggregated waterfall format in the following diagram:
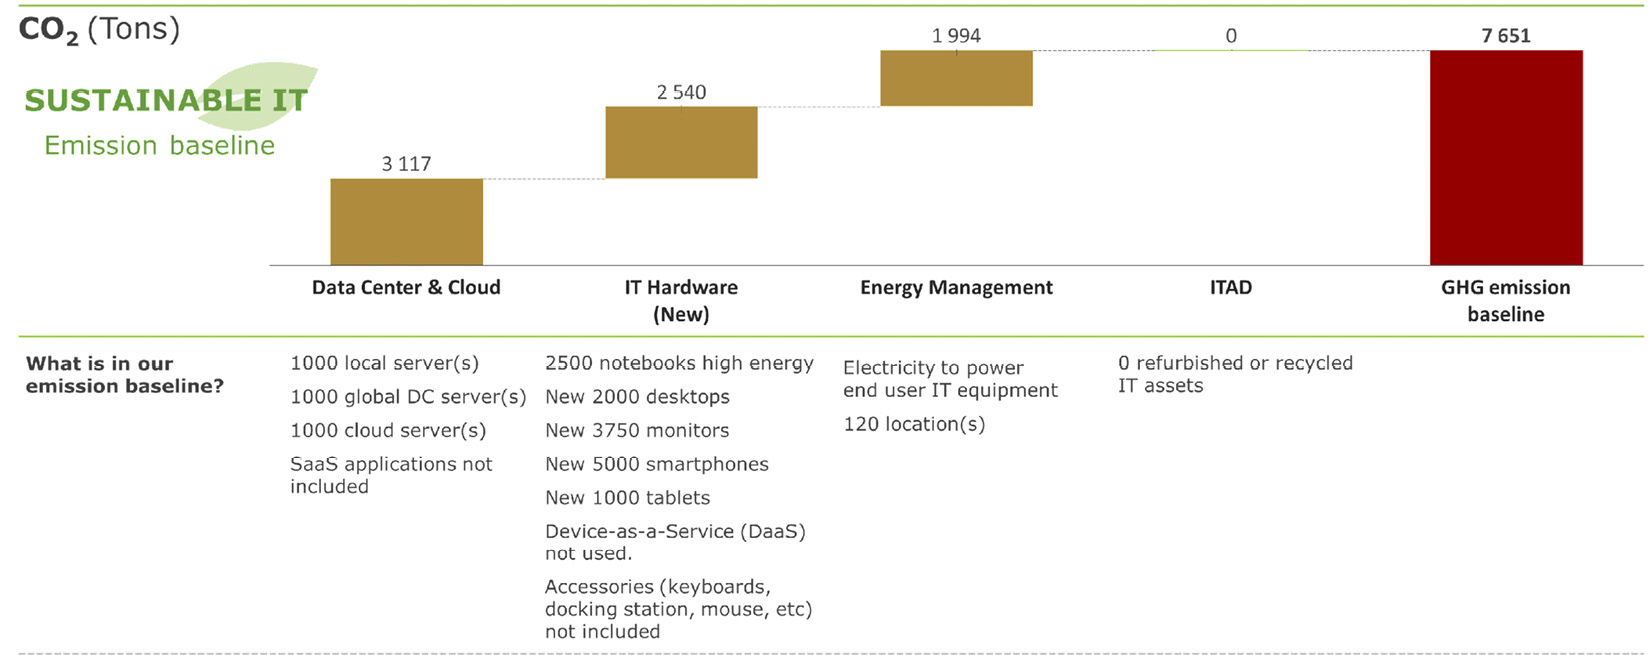
Figure 10.18 – Emission baseline aggregated view
Now that we have established a carbon emission baseline, we can start understanding what mitigating factors we can take to reduce our carbon emissions. As highlighted previously, the calculation is based on a global manufacturing model company with 10,000 employees. You will discover differences across industries and the business environment as you create your baseline. Let us look at a few examples. For example, there might be more custom-developed applications in the banking and finance industry than commercial off-the-shelf (COTS) software. Due to local or federal legislation, moving to the cloud may not be an option in the public sector. You won’t be burdened with any legacy data centers for a start-up company, and you can start with a green field implementation in the cloud. Across industries, there will also be commonalities regarding how you manage your energy consumption or how you procure and manage your IT hardware and dispose of it at end-of-use or end-of-life.
In the next section, we will set a plan to halve our emissions and make a year-on-year simulation on how to get there.
Simulating your target state
Now that we have established a carbon emission baseline, we can start setting our target direction for the next 10 years. We will use similar techniques to arrive at the carbon emission baseline. Still, to do a 10-year simulation, we need to consider a few more parameters over time, such as company growth, employee headcount, IT asset count, IT asset disposition refurbishment, energy mix, regulations such as EU Taxonomy or SEC climate disclosure rules, potential geopolitical implications, and recycling rates. To help you follow along, I have tried to make the assumptions as straightforward as possible. I encourage you to experiment with the model and make your own assumptions. Remember that your journey may look completely different than the one for the model company.
Our primary assumption follows the Science Based Target Initiative (SBTi) guidelines and the general research community’s recommendation to halve our emissions by 2030. Since our starting year was 2022 in our simulation, this means that we only have 8 years to complete the target. Fortunately, we will be able to use several levers that will enable us to reduce our carbon emissions much more sharply.
Let us take a closer look at the multi-year simulation.
Multi-year simulation
To start the multi-year simulation, let us go back to the process step IT asset registry (the IT asset registry tab). From what we did previously, we have the values filled in for the current year, which will formulate the basis for our simulation forward.
For the 10-year simulation, we have made the following assumptions:
- As mentioned previously, we need to halve our carbon emissions in 2030, which means we have 8 years to do this since our starting year was 2022. If your starting year is 2023, you only have 7 years to reach your target, and so forth.
- We assume the company is profitable and grows with 1,000 additional employees annually.
- Our goal for the cloud and data centers is to retire our local on-premise servers and move them to the cloud. We aim to move 200 local on-premise servers from high-carbon regions to a low-carbon cloud region and decommission 50 servers annually. We aim to move 200 global data center servers from a high-carbon region to a low-carbon cloud region and decommission 50 servers annually.
- We aim to gradually relocate servers running in a high-cloud region to a low-carbon region. Most global cloud hyper-scalers have committed that, by 2025, their cloud environment should be powered by 100% renewable energy, so migration is not needed in some cases.
- Software-as-a-Service (SaaS) applications are not part of the simulation. At this point, SaaS vendors are reluctant or unable to provide these data points.
- We upgraded our policy for hardware refresh for our IT hardware and extended each IT asset class by 1 year.
- We start shifting out high-energy IT assets to low-energy assets.
- We aim to shift a portion of our computers to Device-as-a-Service (DaaS) to reduce hardware and increase energy efficiency.
- We assume that energy efficiency increases year on year by 5%.
- We have started utilizing ITAD services to recover carbon credits. Our goal is that 80% of our assets should go through ITAD.
Now, let us look at what a 10-year IT asset registry (the IT asset registry tab) simulation can look like:

Figure 10.19 – Ten-year IT asset registry simulation
As per our assumptions, the employment growth is 1,000 per year. Our servers are moved gradually to a low-carbon cloud region in the cloud, and 100 servers are decommissioned annually. Due to the IT hardware refresh cycle and the annual increase in employees, the purchase of new IT hardware continues to increase year on year. For existing hardware, the asset count continues to increase due to employee growth. Finally, as per our assumption, ITAD continues to increase yearly.
Now that our 10-year IT asset registry simulation is complete, let us look at what the multi-year carbon emission simulation (the Multi-year simulation tab) looks like:
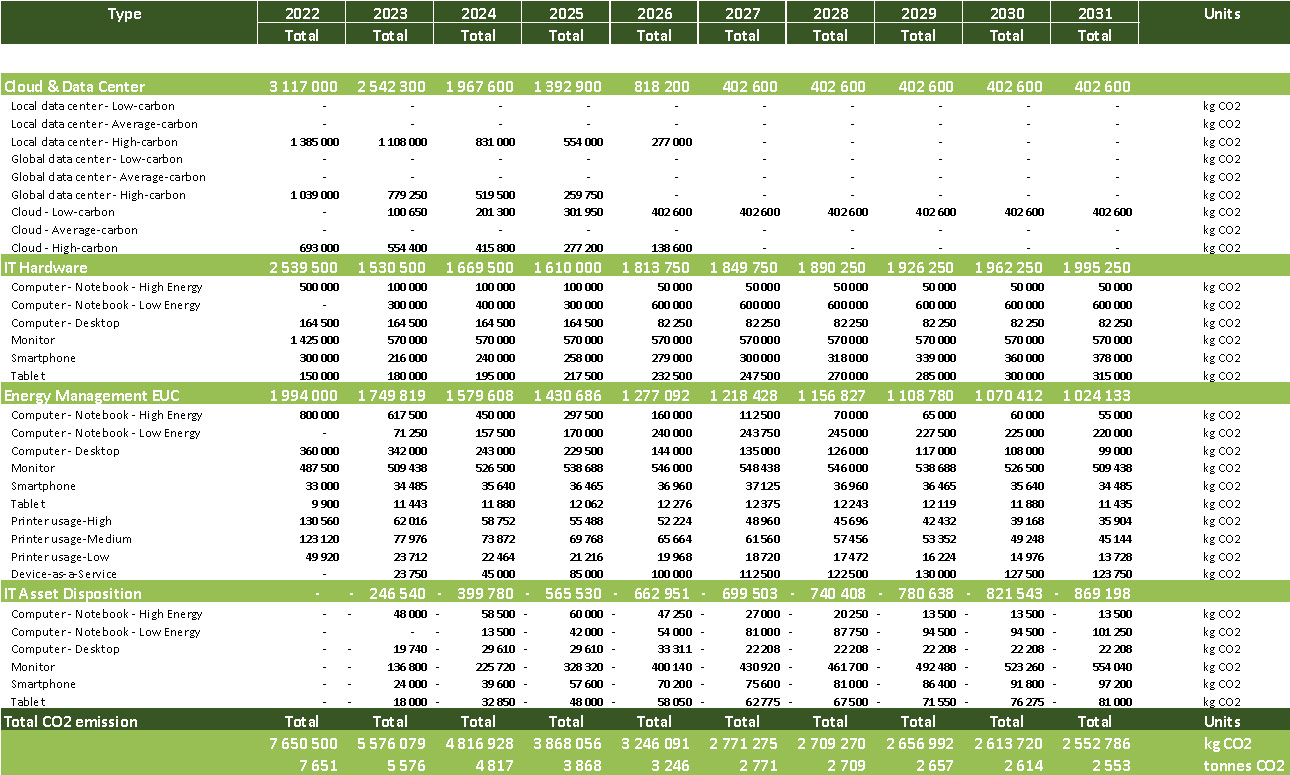
Figure 10.20 – Ten-year carbon emission simulation
Here, we can see that carbon emissions decrease steadily in all categories year on year. From the starting year, 2022, where the carbon emission was 7,651 tonnes CO2 emission, it has decreased by 67% in 2031 to 2,553 tonnes CO2 emissions despite almost doubling in employee count over 10 years. The following diagram shows a waterfall breakdown of how we moved from the 2022 carbon emission baseline to the 2031 target state:

Figure 10.21 – Ten-year carbon emission waterfall summary
Here, we can see that all four categories have decreased their emissions despite the projected employment growth. The category that has made the most significant impact is Cloud and Global Data Center, where we have been able to reduce our carbon emission by 2,714 tonnes of CO2 by decommissioning 800 servers but also moving the server workload from high-carbon regions to low-carbon regions. Energy Management has reduced its CO2 emissions in half, and ITAD significantly contributes to carbon reduction. Where we were unable to make any significant impact was within the purchase of IT Hardware (New), where we were unable to make a significant dent in the emission reduction. IT hardware is an area to explore further to find ways to reduce it by prolonging the IT hardware’s longevity, buying less carbon-intense IT equipment or refurbished equipment, and shifting to DaaS to eliminate the need for advanced processing power on the client side.
Here, I wanted to send you a key message that we can significantly impact today with existing technology. If we go about it systemically, we can significantly contribute to carbon emissions and reduction in e-waste. I am also confident that as the tech industry evolves, we will see improvements in all areas. I strongly encourage you to play around with the emissions calculator and explore different ways to make a sustainable impact. Every organization will be different, depending on your environment; your journey will look different. The most important thing is that you get started.
Summary
The main objectives of this chapter were to focus on pulling all the pieces together by first outlining a sustainable IT maturity model© to enable you to determine your current state and set out your future state ambitions. Secondly, we established our current state’s greenhouse gas (GHG)/carbon emission baseline. The baseline enables us to get valuable insights into our current state. The baseline guides us towards what action areas should be prioritized and what actions should be taken to simulate your GHG emission target state. Finally, we finished the chapter by analyzing the established baseline and started thinking about identifying key action areas to start formulating an actionable, sustainable IT strategy, which will follow in Chapter 11, Putting a Sustainable IT Strategy in Place.
Bibliography
- 451 Research. 2019. The Carbon Reduction Opportunity of Moving to Amazon Web Services. October. Accessed August 04, 2022. https://sustainability.aboutamazon.com/carbon-reduction-aws.pdf.
- Brady, G., N. Kapur, J. Summers, and H. M. Thomson. 2013. “A case study and critical assessment in calculating power usage effectiveness for a data centre.” Energy Conversion and Management 76 155–161.
- Delforge, Pierre, and Josh Whitney. 2014. Data Center Efficiency Assessment. August. Accessed August 04, 2022. https://www.nrdc.org/sites/default/files/data-center-efficiency-assessment-IP.pdf.
- 2021. Dell Latitude 7420. January. Accessed March 17, 2022. https://www.dell.com/sv-se/dt/corporate/social-impact/advancing-sustainability/sustainable-products-and-services/product-carbon-footprints.htm#tab0=1&pdf-overlay=//www.delltechnologies.com/asset/sv-se/products/laptops-and-2-in-1s/technical-support/latitud.
- Dell. 2019. “Life Cycle Assessment of Dell PowerEdge R740.” Dell.com. Junie. Accessed May 15, 2022. https://i.dell.com/sites/csdocuments/CorpComm_Docs/en/carbon-footprint-poweredge-r740.pdf.
- Gill, Victoria. 2021. “Waste electronics will weigh more than the Great Wall of China.” bbc.com. October 13. Accessed May 16, 2022. https://www.bbc.com/news/science-environment-58885143.
- IEA. 2019. Emissions. Accessed July 06, 2022. https://www.iea.org/reports/global-energy-co2-status-report-2019/emissions.
- Khaliq uz Zaman, Sardar, Atta ur Rehman Khan, Junaid Shuja, Tahir Maqsood, Faisal Rehman, and Saad Mustafa. January 2019. “A Systems Overview of Commercial Data Centers: Initial Energy and Cost Analysis.” International Journal of Information Technology and Web Engineering.
- Microsoft News Center. 2018. The Microsoft Cloud can save customers 93 percent and more in energy and carbon efficiency. Microsoft. May 17. Accessed January 27, 2022. https://news.microsoft.com/2018/05/17/the-microsoft-cloud-can-save-customers-93-percent-and-more-in-energy-and-carbon-efficiency/#:~:text=%E2%80%94%20May%2017%2C%202018%20%E2%80%94%20A,issued%20Thursday%20by%20Microsoft%20Corp.&text=These%20gains%2C%20as%.
- Ryder, Guy, and Zhao Houlin. 2019. The world’s e-waste is a huge problem. It’s also a golden opportunity. January 24. Accessed July 07, 2022. https://www.weforum.org/agenda/2019/01/how-a-circular-approach-can-turn-e-waste-into-a-golden-opportunity/.