5
Application and Data
In this chapter, you will learn how to optimize your entire application portfolio to a single application to run more sustainably, impacting energy consumption, resource consumption, and utilization, which will result in emitting less carbon.
The main objective of this chapter is to introduce you to achieving sustainability targets with Enterprise Architecture (EA), application portfolio management, and sustainable software development.
First, you will learn how to turn your sustainability strategy into action with EA. Then, you will learn what different considerations are available to optimize your application portfolio to simplify, modernize, and transform your entire application estate, which will result in a lower total cost of ownership (TCO) and Greenhouse Gas (GHG)/carbon emissions emissions. After that, we will introduce you to a single hypothetical application and how it can be optimized. Finally, you will learn how to measure your CO2 derived from cloud services.
In this chapter, we will cover the following topics:
- Transform Enterprise Architecture to help achieve sustainability targets
- Application Portfolio Management for sustainability
- Application Rationalization for sustainability
- Sustainable Software development
- Energy-efficient programming languages
- Emissions derived from cloud services
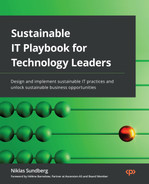
From the sustainable IT reference model perspective, in this chapter, we will primarily cover the top part, which is the responsibility of the sustainable IT enterprise. We will look at how the different capabilities play an integral part in building a sustainable application portfolio, starting with a solid EA for a software engineer optimizing a single application. We will touch on IT hardware life cycle management and the effect on embodied carbon, but primarily, this will be covered in Chapter 6, IT Hardware Management:
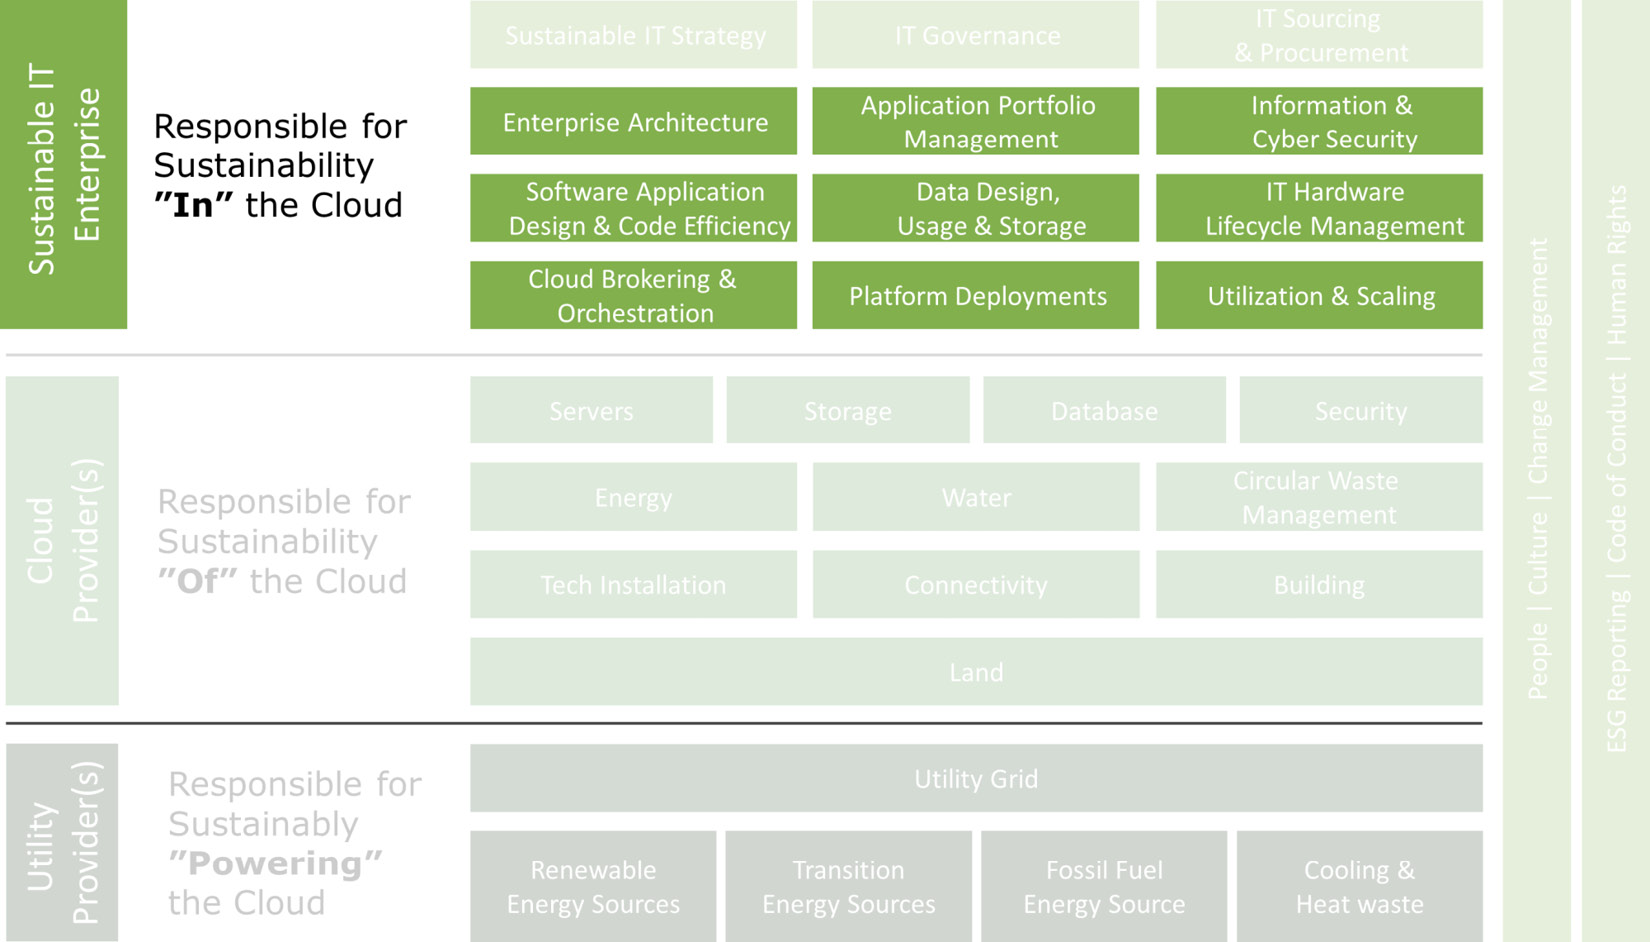
Figure 5.1 – Sustainable IT reference model – Chapter 5's focus
By the end of this chapter, you will have learned about application portfolio management and sustainable software development. You will hear from thought leaders such as André Christ, the CEO and cofounder of LeanIX, who has a critical EA role in sustainability enablement; Asim Hussain, Executive Director, Green Software Foundation, on sustainable software development; and Elsa Westin, Sustainability IT Lead at Scania, on their energy and carbon emission tracking tool. You will learn about the application rationalization process, application assessment criteria, and Tolerate, Invest, Migrate, and Eliminate (TIME). Furthermore, you will understand what opportunities exist within sustainable software development for a single application, from choosing an energy-efficient programming language to key considerations during each step of the software development life cycle (SDLC). Finally, you will learn what tools are available from the major cloud providers, including Amazon Web Services (AWS), Microsoft Azure, Google, and other cloud providers, to measure your carbon emissions in the cloud while taking a holistic approach and measuring your entire cloud estate.
The world runs on software
In an increasingly digitized world, we have come to rely more and more on software that runs in the background running our social media sites, search engines, news outlets, streaming services, online gaming, and eCommerce. The world runs on software; how these solutions operate can significantly impact the environment regarding energy consumption and carbon emissions. In the drive toward hyper-connectivity, people, places, and things are increasingly connected through next-generation networks such as 5G and the Internet of Things (IoT). Emerging exponential technologies such as artificial intelligence (AI), autonomous vehicles, augmented reality (AR) and virtual reality (VR), drones, 3D printing, digital manufacturing, and robotic process automation (RPA) increasingly require more computing and storage power through cloud computing and quantum computing (Carlsson 2021). All of these emerging technologies run and operate on software, which requires access to high-performance computing (HPC), elaborate storage, and increasingly more rapid data transfer options across the network. For example, AI with machine learning (ML) and deep learning (DL) techniques require large datasets, images, complex algorithms, and vast amounts of computing and storage to be effective.
In today’s rapidly changing business environment, having a flexible IT landscape is a crucial enabler in driving digital business transformation to enable a better customer experience and unlock internal operational efficiency opportunities. An EA insights report conducted by LeanIX, a SaaS-based Enterprise Architecture Tools company, suggests that legacy IT applications and security concerns impede digital transformations (LeanIX 2019). Corporations, organizations, and governments tend to work with hundreds of applications and even thousands for several reasons. The sheer number of applications is usually due to strategic business initiatives, the adoption of new technology, mergers and acquisitions, shadow IT initiatives, and organizational changes. It is not uncommon for organizations to have multiple Enterprise Resource Planning (ERP) systems, Customer Relationship Management (CRM), mainframe applications, integration platforms, and Business Intelligence (BI) platforms. Before we go any further, let us look at the definition of an application.
TechTarget (TechTarget 2021) defines an application as follows:
- An application software or application program is a piece of computer software that supports business processes, in whole or in part, for an end user or another application through a graphical interface or programmatically.
- An application is self-contained or part of a group of programs. It automates and optimizes a set of operations such as business functions, processes, tasks, and activities.
As these definitions suggest, applications come in many different shapes and forms, so it should come as no surprise that enterprises have an overwhelming amount of them. The LeanIX EA insights report suggests that 36% of billion-dollar enterprises now hold more than 1,000 applications in their portfolios. The following diagram illustrates the breakdown of applications based on company size and revenue:

Figure 5.2 – Breakdown of the number of applications per enterprise size
Not surprisingly, a sizable chunk of the IT budget is directed toward developing, maintaining, and operating applications. Some research suggests that spending in certain sectors such as the Financial Service sector can amount to as much as 75% to 80% of total IT spending (Grotty and Horrocks 2017). There is a huge savings potential in rationalizing your application portfolio from a digital transformation cost perspective, and radically reducing your emissions. A report from Infosys suggests that as much as $2 million can be generated in cost savings due to application rationalization (Infosys 2018).
Managing your application portfolio is a complex endeavor, from prioritizing hundreds or thousands of applications for the solution architecture and managing the efficiency and effectiveness of a single application. There are also significant benefits in introducing sustainable software development practices for a single application to reduce resource consumption, overhaul data architecture and data life cycle management, and optimize chatty interfaces to remove excessive data transfers. In the following subsections of this chapter, we will explore application portfolio management and sustainable software development.
Transforming Enterprise Architecture to help achieve sustainability targets
In this section, we will hear from André Christ, CEO and cofounder of LeanIX, on how to achieve sustainability targets with EA.
Turning a sustainability strategy into action with Enterprise Architecture
Over the last 10 years, EAs have increasingly played a role in driving the digital transformation agenda. Their holistic view of the organization, supported by well-developed methodologies and comprehensive access to IT and business portfolio data, puts them in an ideal position to translate a business strategy into execution. Among other things, this perspective allows them to uncover gaps in the required business and IT capabilities and design the roadmaps required to close these gaps.
So far, however, EAs have played a marginal role when it comes to helping companies achieve their sustainability goals. This is the case even though 52% of survey respondents (LeanIX 2022) state that their IT organization is currently pursuing at least one sustainability initiative. The good news is that enterprise architects can have a meaningful impact on these initiatives and they do not need to start from scratch. There are several powerful frameworks they can leverage to define meaningful sustainability targets and plan a course of action to tackle them. These frameworks include, for example, the United Nations Sustainable Development Goals (SDGs), the Amazon Web Services (AWS) Well-Architected Framework, and the Microsoft Azure Well-Architected Framework. AWS has added a sustainability pillar to its Well-Architected framework, which is something that Microsoft is lacking at the time of writing. These frameworks are well suited to driving sustainability initiatives in the areas of business, application, data, and technical architecture.
Transforming business architecture with the UN’s SDGs
Over the years, interest in the 17 SDGs established by the UN has grown, along with a sense of urgency around achieving them. This interest goes well beyond government institutions and non-profit organizations. The UN SDGs were established in 2012 to build a blueprint for a more sustainable future for all worldwide by 2030. These SDGs have been adopted by 193 countries. The 17 SDGs are broken down into 169 SDG targets. Two hundred and thirty-two unique indicators are used to track progress toward these targets. Many of these indicators can be explored interactively (https://sdg-tracker.org/) and organizations can use publicly available data to set sustainability targets:

Figure 5.3 – Breakdown of the number of applications per enterprise size
As achieving meaningful results becomes increasingly important not only for shareholders but also for customers and employees, organizations must do more than simply commit to the SDG goals (MSCI 2022). Above all, they need to measure their actual progress toward achieving them.
Unfortunately, this progress has been slow. A recent study conducted of the 8,550 companies in the MSCI All Country World Index showed that roughly 38% were “aligned” while almost 55% were either “misaligned” or “neutral” with the UN SDGs. Only 0.2% of the companies were “strongly aligned” (MSCI 2022). These results show that companies have a long way to go if they want to avoid being accused of greenwashing or rainbow-washing – that is, committing publicly but not delivering on it.
Regardless of industry, EA plays a critical role in executing strategic plans and provides a valuable framework for analysis and decision-making across the enterprise. For this reason, it is an excellent tool for both planning targets and ensuring the achievement of SDGs by tracking organizational execution efforts. EAs can drive this process with the following four steps:
- Determine the alignment with SDG goals and demonstrate commitment: To start, organization leaders should familiarize themselves with the SDGs and identify those most relevant to what their organization, functions, and employees do. Relevance not only helps define appropriate actions but also motivates people to act. For example, an organization from the manufacturing sector may want to track progress toward SDG #12 – Ensure sustainable consumption and production patterns – by measuring the efficient usage of natural resources and waste reduction. An organization from the energy sector may want to track progress toward SDG #7 – Ensure access to affordable, reliable, sustainable, and modern energy for all – for instance, by increasing the percentage of renewable energy in the global energy mix.
- Make the SDGs traceable in the business capability landscape: Once the organization’s SDG targets have been agreed on, they should be mapped to the business capabilities. Business capabilities are used to describe the abilities of an enterprise – that is, what it can do, independent from implementation. By exploring which business capability can contribute to achieving a sustainability target, the high-level strategy is turned into execution, and accountability is established by involving the business owners for each business capability. The systematic dialog between EAs and business owners in the context of the SDG targets will spark ideas and reveal how to measure improvements in your operations, such as the manufacturing and supply chain, while leveraging IoT devices to track assets through their life cycle to improve predictive and prescriptive maintenance. This step resembles the Objective and Key Results (OKR) methodology, in which the targets and the measurements are front and center to define the direction and establish a way to track progress. Ideally, the SDG target setting is integrated into the OKR process of the organization.
- Translate the SDG objectives into an aligned project portfolio and budget: The next step is about identifying the initiatives, skills, and roles that are needed to achieve the SDG targets. Here, all potential projects, workstreams, and tasks will be captured and estimated in terms of their impact and budget. As all these initiatives will affect processes, technology, and people, the contribution of EA is highly beneficial. EAs understand the relationships of the current landscape, or they can facilitate the conversation between the stakeholders and help translate between them to optimize your value streams such as order-to-cash, service-to-cash, plan-to-produce, and schedule-to-ship. Finally, the portfolio of initiatives can be prioritized, decided, and budget allocated.
- Measure the results and provide transparency on the achievement: First and foremost, it is crucial to establish a carbon emission baseline of your as-is state and track the progress from the as-is state, the baseline, to the to-be state, understanding if improvements in sustainability have been achieved. In this step, EAs can assist in creating the necessary systems and applications to help measure the baseline and model the expected target state – from a capability, process, technology, and people perspective – and continuously track if the sustainability initiatives are converging toward the desired target state or if an adjustment is needed. This ensures a solid feedback loop, which also creates the insights to report back to leadership.
Optimizing application and data architectures in the cloud using best practice frameworks
Cloud computing made it possible to scale computing resources and data storage in a disruptive way, giving businesses more flexibility and allowing them to better measure the total cost of ownership of their IT. As we learned in Chapter 4, Data Center and the Cloud, there are significant environmental benefits in leveraging the cloud, from greenhouse gas (GHG) emission reduction, lower energy consumption, choosing locations with access to renewable energy sources, to decreased waste. A joint study by Microsoft Corporation and WSP Global Inc. suggests that cloud computing can contribute to as much as 98% lower GHG emissions and a 93% reduction in energy consumption than traditional on-premises data centers (https://www.microsoft.com/en-us/sustainability/azure). This means organizations can contribute to the UN’s SDGs by shifting workloads running in on-premise data centers to the cloud. Many public cloud providers today also offer tools to analyze the organization’s carbon footprint in the cloud, such as the Emissions Impact Dashboard from Azure (https://www.microsoft.com/en-us/sustainability/emissions-impact-dashboard). We will explore these tools in detail later in this chapter.
However, just as automating inefficient processes doesn’t make them any less inefficient, moving energy-inefficient workloads into the cloud doesn’t make them suddenly energy efficient. That’s why public cloud providers such as AWS have adopted a shared responsibility model in which the cloud provider is responsible for the sustainability of the cloud and the customer is responsible for sustainability in the cloud. Cloud providers also apply similar shared responsibility models to areas such as security. According to this model, companies need to invest in the application, data, and technical architectures that achieve a high level of efficiency in the cloud. Following cloud-native architectures, focusing on the optimal use of offered cloud services provides one proven method for accomplishing this:

Figure 5.4 – Shared responsibility model for sustainable cloud computing
For both new and existing solutions, optimizing application and data architecture depends on the following best practices. Sources for such best practices include the AWS Well-Architected Framework Sustainability Pillar (https://docs.aws.amazon.com/wellarchitected/latest/sustainability-pillar/sustainability-pillar.html) and the Microsoft Azure Well-Architected Framework (https://docs.microsoft.com/en-us/azure/architecture/framework/). While these frameworks reference the cloud services and tools unique to each vendor’s platform, the underlying principles are universal. Since they can be applied across public cloud providers, application and data architects should follow them when assessing the current cloud portfolio. The following example questions help assess the different architecture layers:
- Application architecture:
- Is the region of the cloud services best aligned with the location of the users?
- Is the software architecture optimized for asynchronous and scheduled jobs to minimize the average resources required?
- Are application programming interfaces (APIs) optimized for minimal network traffic needed for the consumers and devices (that is, the GraphQL APIs allow the consumer to define which data is needed)?
- Data architecture:
- Are data retention policies in place to delete unnecessary data?
- Are technologies used to best support storage and data access while minimizing the resource footprint (that is, SSD disks are more time-consuming than magnetic drives)?
- Is data only backed up when it is difficult to recreate or needed for compliance reasons?
- Technical architecture:
- Are newer, more efficient instance types being used (that is, cloud providers regularly introduce new hardware for their computing instances)? What happens to the old hardware after its end of use? Is it refurbished and resold on the market?
- Are managed services (for instance, databases) used in favor of self-hosted services on virtual machines to leverage optimization by the cloud provider?
- Are high-power consumption graphics processing units (GPUs) only used when needed and scaled down automatically?
Now, let us look at how to take a pragmatic approach to sustainability tracking by leveraging EA.
A pragmatic Enterprise Architecture framework for sustainability tracking
To effectively assess the different architectural layers and achieve sustainability targets, a single source of truth is recommended. The following exemplary EA framework allows you to manage sustainability targets across all the layers, from strategy and transformation to technical architecture. It demonstrates which types of data about the organization’s enterprise architecture are needed to track the improvement of the UN’s SDGs (list items 1 to 3) and which data is needed to apply the cloud Well-Architected Frameworks (list items 4 to 8). EA tools with a focus on ease of use and simplicity facilitate the collaborative work on sustainability targets. Such tools allow leadership and experts from different functions to work together, easily extract insights, and make decisions in a data-driven way.

Figure 5.5 – Tracking sustainability targets in an EA framework
Now that we have the basic framework in place for tracking sustainability targets, let us take a closer look at how application portfolio management (APM) can be leveraged not only to drive sustainability benefits but also to reduce complexity and lower cost.
Application portfolio management
In today’s complex IT landscapes, several challenges must be managed, such as the following:
- The rapid rise of cloud computing, hyperconnectivity, and exponential technologies
- A flexible workforce working from anywhere
- A heterogeneous device landscape with computers, tablets, smartphones, sensors, and IoT devices
- Complex regulations such as the EU Corporate Sustainability Reporting Directive (CSRD), GDPR, invalidation of the Privacy Shield agreement, and emerging legislation of Consumer Privacy Acts are being enacted on both national and local levels
- Increased cyber threats from state-sponsored actors and cybercrime syndicates
- The increased risk of climate failure, which is our biggest humanitarian challenge to date
Managing your portfolio of applications over its lifetime should be a strategic imperative for any organization with many applications. As we saw in the previous section, if you are working in a company with a revenue of $100 million or more, your enterprise environment most likely consists of hundreds or even thousands of applications. Therefore, APM is an integral part of how an organization responds to measuring business value, cost performance, and managing risk. It is essential to set clear application portfolio optimization objectives to simplify, modernize, and transform:

Figure 5.6 – Application portfolio optimization objectives
Once you have identified your application portfolio objectives, you can make a case to rationalize your application portfolio and unlock several benefits, such as increased business agility, reduced IT costs, reduced IT complexity, and an improved risk profile. It is best practice to include application rationalization within your application portfolio management. Through application rationalization, there are several other vital cost-saving and sustainability opportunities to be uncovered, including the following:
- Software license optimization
- Eliminate and migrate applications
- Simplify technology stack by moving workload from on-premise to the cloud
- Reduced maintenance, support, and operations costs
- Virtualization optimization
- Reduction of data storage, including backup and recovery
- Reduce complexity by eliminating redundancies
- Higher energy efficiencies and lower hardware utilization
- Platform standardization and next-generation architecture
Since APM and application rationalization are well-established practices, it should be no surprise that the cost base could be significantly reduced by embarking on an application rationalization journey. However, let us look at some strategic planning assumptions (LeanIX 2019) that you should have when you build your business case:
- License costs can be reduced by 30% through license optimization
- A minimum of 20% of applications are unused and can be eliminated or migrated
- Reduce infrastructure costs by 45% through virtualization of hardware, databases, and shared storage
- 20% of operational support can be reduced
- A minimum of 10% of projects can be avoided
- Reducing the number of vendors can improve the TCO by 22% to 28%
- Reducing carbon emissions by 70% to 90% by moving workloads from on-premise to the cloud
The following diagram illustrates how a cost case could be transitioned from a current to a target state, including financing the rationalization efforts:

Figure 5.7 – Application rationalization before and after cost benefits comparison
However, what might be surprising are the environmental effects that can be unlocked by avoiding emissions through retired applications, improved energy efficiency, and asset utilization by moving from on-premise to the cloud, and moving workloads running on fossil fuel to renewable energy sources. Research suggests that carbon emissions can be reduced by between 70% to 90%, depending on different studies (IDC 2021) (Microsoft News Center 2018) (Lacy, et al. 2020). Even though there is a compelling cost case, the environmental benefits are even more significant in carbon emission reduction, as shown in the following diagram:

Figure 5.8 – Application rationalization before and after carbon emission reduction comparison
Application rationalization makes a compelling case from a sustainability perspective, along with the usual benefits. Now that we have learned about both the objectives and benefits from a traditional and sustainability perspective, let us look at the application rationalization process from start to finish.
Application rationalization process
There are several commercially and publicly available application rationalization frameworks to choose from when you decide to embark on an application rationalization journey. Since this book is centered on how you can build your sustainable IT enterprise and evaluate different methods to get there, I will not go to great lengths to explain all the application rationalization processes. I will stay at a high level and point out some of the critical sustainable IT choices that you can make along the way. However, I will point you in the right direction to explore the topic further since application rationalization is a powerful tool to have in your sustainable IT toolbox.
Most frameworks look the same and follow a five to six-step process. However, the ones that I have reviewed that are publicly available or from large global consulting firms lack sustainability criteria, and those have been embedded into this model.
This six-step, well-proven process, which will be outlined further here, is an iterative approach to application rationalization. It allows you to both unlock traditional and sustainability benefits. Please modify the model as you see fit to align with your business strategy, unique requirements, operating model, and organizational setup. If run efficiently with the right stakeholder engagement, you should be able to run a full process within 4 to 6 weeks, depending on the scope and the size of the organization.
Here, you must determine objective and key results, scope, and governance:
- Identify key stakeholders: Work with primary and secondary stakeholders to ensure scalability and speed, determine OKRs, determine the scope, establish governance, identify requirements, including sustainability requirements, and develop or refine a business capability map.
- Distribute data collection: Identify applications through manual or automatic discovery, map business capabilities to applications, identify application attributes, develop questionnaire templates, including sustainability-related questions, send a questionnaire to stakeholders (system owners, system managers, system architects, data protection managers, information security, and more), and validate the data collection.
- Conduct a value assessment: For each application in the application inventory, review business value, functional fit, technical fit, and sustainability fit. The assessment criteria are described in detail in the Application assessment criteria section. Review application scores, identify dependencies, identify duplicates, and highlight carbon-intensive applications. Finally, review the data’s quality.
- Target analysis: Conduct a target state TIME analysis and identify replacement candidates. Confirm the current-state total cost of ownership (TCO) and identify cost outliers. Confirm current-state carbon emissions, identify sustainable alternatives for carbon-intensive applications, and calculate Return on Sustainable Investment (ROSI).
- Implementation roadmap: Identify clusters by function or application type, analyze hosting alternatives, embed sustainability by design into your decision model, and develop a migration strategy.
- Execute and manage the application portfolio: The final step is to execute the implementation roadmap, establish a sleeper service to manage your application as an intermediary step toward retirement, and optimize and decommission applications. Recalibrate your application portfolio continuously and track target state objectives such as TCO, ROSI, and carbon emission. There are EA application portfolio systems on the market that enable you to establish a single repository and automate a lot of the process.

Figure 5.9 – Sustainable IT application rationalization six-step process
The preceding diagram illustrates the sustainable IT application rationalization process, which is an upgrade of the application rationalization playbook to cater to sustainability throughout the process (U.S. Federal CIO Council 2020). It is a six-step process with an infinite loop. Once you have gone through the process and uncovered your objectives and key results, the process should be executed continuously. A recommendation is to start small with a small set of applications with similar characteristics. It is essential to get buy-in for this process and show some early wins early on.
Let us start with the application assessment criteria. As stated earlier, I will not describe the application rationalization process in detail. Still, I would like to introduce you to how you can embed sustainability requirements into application assessment criteria and use the TIME quadrant to illustrate application cost, carbon emissions, and carbon cost.
Application assessment criteria
Your application criteria should be developed in step 2 to assess your application fit. There are six key categories that I recommend that you include in your application assessment criteria. These six categories are strategic value, functional fit, technical fit, costs, data and data protection, and sustainability. The critical attributes for each category are illustrated in the following diagram:

Figure 5.10 – Application assessment criteria
Let us look at each category in more detail:
- Strategic value: From a strategic value perspective, you should assess the overall macro trends and how they align with the business strategy. You should ask yourself what impact the application has on the business KPIs and what organizational dependencies exist.
- Functional fit: When assessing the functional fit, you should assess the business criticality of the application. I use four categories to describe business criticality: mission-critical, business-critical, business-operational, and administrative service. You should ask yourself what business capabilities are supported, such as finance, supply chain, sales and marketing, research and development (R&D), and so on. You should also consider what processes are supported, such as order to cash, procure to pay, forecast to plan, plan to produce, and record to report. You also need to consider what the functional fit of the application is: Does it fit the functional needs perfectly, or is the functional fit insufficient or even unreasonable? From a user experience perspective, you should assess the usability and accessibility of the application.
Based on the functional fit criteria, a sample application registry could look as follows:

Table 5.1 – Application registry – functional fit
- Technical fit: From a technical perspective, you should assess the technical fit of the application – that is, if it fulfills the needs or not. You should assess if the architecture type of the application is a client-server, n-tier, platform application, or web-based, and what platform it is running on, from an application server, database, or storage to on-premise, Infrastructure-as-a-Service (IaaS), Platform-as-a-Service (PaaS), or Software-as-a-Service (SaaS). Consider questions such as: What programming language is it running on? Is it an energy-efficient programming language? What is the scalability, maintainability, and reusability of the application? What is the security posture of the application? Is it connected to single-sign-on (SSO) or multi-factor authentication? Has it been penetration-tested? Does it have any underlying vulnerabilities in any of the components in the application stack? How well does the application integrate with other applications? Does it rely on Open Database Connectivity (ODBC)? What connections, stored procedures, message queues, or more modern APIs does it require?
Based on the technical fit criteria, a sample application registry could look as follows:

Table 5.2 – Application registry – technical fit
- Costs: For each application, it is essential to assess your cost base, including your carbon emission cost. It would help if you tried to understand your licensing, development, maintenance, support, operations, carbon cost, and training costs for each application. Later in this chapter, you will see that when we assess the TIME quadrant, the cost criteria, including the cost of carbon emissions, can be vital in assessing whether you should invest in, tolerate, migrate, or eliminate your application.
- Risk and compliance: Managing your governance, risk management, and compliance requirements such as the Corporate Sustainability Reporting Directive (CSRD), GDPR (General Data Protection Regulation), and national and local data protection legislation is critical. For example, for GDPR, you should assess what data objects reside within your application, what information classification it has, and whether they contain any GDPR classified data. Based on the information classification, what are the information security requirements, such as access control and data portability? What interfaces are provided to consume or provide data to and from the application?
- Data and data protection: Managing your master data is a strategic imperative to reduce time to market, deliver operational efficiency, and improve customer experience. It is also important from the sense of meeting governance, risk management, and compliance requirements such as GDPR and national and local data protection legislation. You should assess what data objects reside within your application, what information classification it has, and whether they contain any GDPR classified data. Based on the information classification, what are the information security requirements, such as access control and data portability? What interfaces are provided to consume or provide data to and from the application?
- Sustainability: Finally, the sustainability criteria should be assessed. You should ask yourself, what is the carbon intensity of the application, energy efficiency, share of renewable energy, hardware efficiency, and the embedded carbon from manufacturing the IT hardware? In the next section, Sustainable software development, we will look into how to determine the application’s carbon intensity and energy efficiency. What is your supplier fit? Is it a strategic or tactical vendor or a vendor that you would like to discontinue working with? Has the supplier signed your code of conduct and how transparent are they in their business practices? How well do your suppliers fulfill your ESG requirements? What net-zero targets have they made? What type of sustainability metrics does your vendor report on? If your vendors do not meet your sustainability requirements, do you cut them loose or do you engage with them to help them improve? In Chapter 8, Leveraging your Buying Power, we will look further into what ESG requirements you can impose on your supplier base.
Based on the sustainability criteria, a sample application registry could look like this:
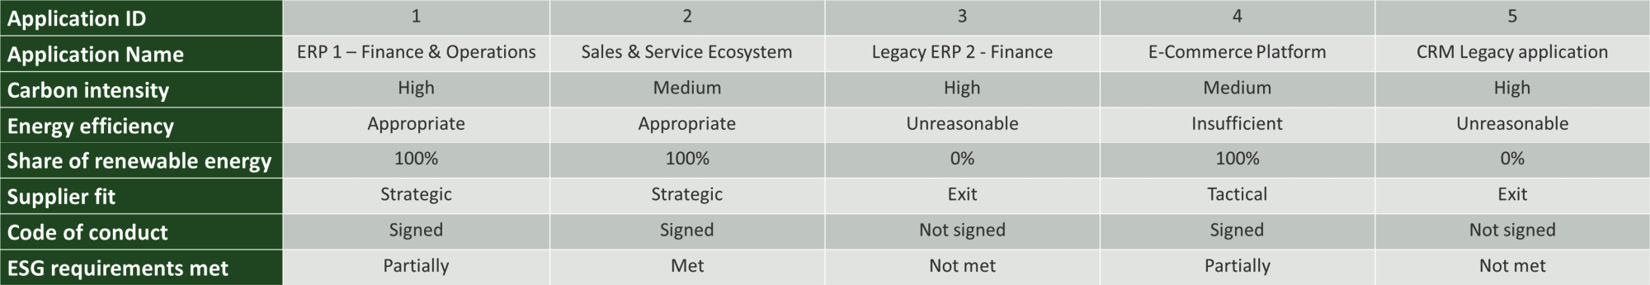
Table 5.3 – Application registry – sustainability
The application assessment criteria outlined earlier should give you a good idea of how you could construct your assessment criteria to be included in your questionnaire to be sent out to key stakeholders. Once the receipts have been collected, they should be documented in an application registry either in an Excel sheet or an EA application. A simple application registry template is available at www.sustainableitplaybook.com, which you can download.
Now that we have outlined the application assessment criteria from several different categories, we need to bring everything together to be able to make decisions on our future state application portfolio. In the next section, we will look more closely at how TIME analysis can be leveraged to enable you to make data-driven decisions based on several different decision criteria.
TIME analysis
Once you have your application registry in place, a powerful tool to make your APM analysis come to life is to use TIME analysis. It is a robust methodology to help you identify transformation alternatives and make data-driven decisions regarding TIME applications. There are many alternatives to set on the X and Y axes. Some put the business fit on the X-axis and risk on the Y-axis. I prefer setting business value on the Y-axis and the technical fit on the X-axis. Each quadrant represents a decision criterion to tolerate, invest in, migrate, or eliminate the application:

Figure 5.11 – TIME analysis quadrant
Tolerate systems that deliver business value with acceptable technical risk and cost efficiency and meet the sustainability criteria and quality.
Invest in or innovate applications that increase business processes’ effectiveness and value, deliver sustainability outcomes, or leverage cross-application stovepipes, service levels, or data volumes that preclude conversion.
Migrate system applications that are critical to providing value to the business but at high risk and high cost, including high sustainability-related costs to maintain them.
Eliminate systems that no longer deliver business value with acceptable technical risk, cost efficiency, or risk and don’t meet the sustainability criteria and quality.
For each of the bubbles representing the application, I tend to use a variety of alternatives to evaluate the size of the application cost, carbon intensity, and carbon cost. Figure 5.12, Figure 5.13, and Figure 5.14 show different views with the same hypothetical dataset:

Figure 5.12 – TIME analysis application cost
In the preceding diagram, we can see that four applications end up in the eliminate and migrate quadrant out of the 10 applications. Four applications have been deemed to continue investing in, while two applications are being tolerated for the time being. The bubbles in the following diagram illustrate the size of the application cost. High cost does not necessarily mean that it should be migrated or eliminated. The application might be of high strategic value, perfect functional fit, and good technical fit and may justify the high cost:

Figure 5.13 – TIME analysis of carbon emissions
We have now replaced the application costs in our hypothetical dataset with carbon emissions. The business value and the technical fit are the same. We can see that six out of the 10 applications emit more than five metric tons of CO2 annually. Three applications emit less than five metric tons of CO2 emissions. Only one application emits less than one metric ton per year, which can be considered acceptable in the green or sustainable zone. Since nine bubbles are in the tolerate or invest quadrant, we should reassess the hosting options to ensure that the carbon emissions are substantially lowered. The four applications that sit within the migrate or eliminate quadrant should be taken care of. Once they have been retired or migrated, they should positively impact your carbon emission baseline:

Figure 5.14 – TIME analysis of carbon costs
In the preceding diagram, we have replaced the application costs with carbon emission costs. The business value and the technical fit are the same. For simplicity’s sake, we have set the carbon emission cost to €100 per metric ton of carbon dioxide emission in this example. Hence, carbon emissions per application are multiplied by the carbon emission tax.
Just like in Figure 5.12, we can see that six out of the 10 applications have a carbon emission cost greater than €500 per year per application. Three applications have a carbon emission cost of less than €500 but more than €100 per year per application. Only one application has a carbon emission cost of less than €100. Ten applications in this example may not look like as much cost. Still, if you are a large organization with hundreds or even thousands of applications, this will add to accumulated costs due to your carbon dioxide emissions. If your company has put a policy in place that your carbon emission tax will increase year over year, this will cost a lot of money. In Chapter 10, Get Started Today, we will cover how you calculate your emission baseline for your full IT environment. .
What is a carbon fee?
You should think of a carbon fee as a form of a carbon tax. For every metric ton of carbon dioxide emitted, you must pay a fixed fee that gradually increases year on year. Carbon dioxide tax can be applied to anyone – individuals, enterprises, organizations, and even countries. More and more companies are starting to charge an internal carbon fee to accelerate emissions reduction and match the underlying costs of carbon abatement. In 2022, Microsoft raised its internal carbon fee from $15 to $100 (Willmott 2022).
Now that you have learned how you can work with your application portfolio to identify different transformative alternatives, both from a strategic value and from a sustainable IT perspective, let us take a look at how you can calculate the carbon emission and carbon intensity for a single application. We will also dig into some of the concepts that you can apply to make your software development more sustainable.
Sustainable software development
In the early days of software development, memory resources and processing power was scarce, and each line of code had to be carefully considered. This changed rapidly, though. As we saw in Chapter 1, Our Most Significant Challenge Ahead, based on Moore’s law principle, the number of transistors in a dense integrated circuit (IC) has doubled roughly every 2 years since the 1970s. Due to this development, the need to write memory and process efficient code shifted to increase software engineering productivity and produce faster programs. As the sentiment is now changing toward becoming more sustainable, carbon-efficient, and energy-efficient, software development has a vital role in this journey.
To conserve battery time, especially mobile phone end users tend to turn off resource-intense applications, and there is a constant demand for manufacturers to produce more battery-efficient products. The demand is not from the software community itself but hardware manufacturers and end users demanding more energy-efficient products. EPEAT, Energy Star, and TCO Certified are world-leading organizations that certify IT products from a sustainability perspective to drive environmental and social change by setting strict certification requirements. These criteria get more challenging every year, which puts pressure on the IT hardware manufacturers to improve to stay within the game continuously. In Chapter 6, IT Hardware Management, we will look further into IT hardware, but for now, let us turn our focus back to sustainable software development.
Let us look at the definition of sustainable or green software commonly used interchangeably. However, the concept of sustainability is a bit wider and encompasses the social aspects and not only the environmental ones. In the simplest form, sustainable software is the practice of considering environmental and social aspects and carrying out the development, operations, and maintenance of software in a sustainable manner producing a sustainable software product (Calero and Piattini, 2015). Building sustainable software should reduce GHG emissions by being carbon-efficient and energy-efficient. To be considered sustainable software, three abstract characteristics (Taina 2011) need to be fulfilled:
- Throughout the SDLC, the aim should be to save resources and reduce waste, from development, operations, and maintenance to end-of-life
- Software execution should aim to maximize output while minimizing resources and waste
- Sustainable software development practices should be promoted and leveraged throughout the entire life cycle, from inception to retirement
Let us look at some of these characteristics in more detail.
Choosing energy-efficient programming languages
As we saw earlier, the demand for more sustainable, carbon-efficient, and energy-efficient software originated within IT hardware manufacturers but has quickly gained traction within the software community. Comparing efficiencies by different programming languages might be different since it relies on several factors, such as development frameworks, software patterns, and code quality. Outside factors can also impact the execution time and the energy efficiency by the quality of the compiler, virtual machine, and network latency (Elizabeth 2017).
However, a team of researchers in Portugal studied the effects of 27 programming languages to study the effects between speed and efficiency. Three performance variables were analyzed: energy consumption, memory consumption, and execution time (Pereira, et al. 2017). These 27 programming languages are divided into four programming language paradigms – imperative, object-oriented, functional, and scripting:

Figure 5.15 – Programming language paradigms (Pereira, et al. 2017)
The study found that in terms of programming language paradigms, the category that requires the least memory is imperative languages, followed by object-oriented, functional, and scripting languages. Compiled languages such as ADA, C, and C++ are more energy-efficient, whereas scripting languages such as Ruby, Python, and Pearl, which are interpreted at runtime, are the least efficient. The most energy-efficient object-oriented programming language turned out to be Java.
Furthermore, the research investigated combining energy, time, and memory usage in four different combinations – time and memory, energy and time, energy and memory, and all three – that is, energy, time, and memory. In all four cases, the imperative programming language came out on top. The programming languages that did not fare too well in the test were some of the more popular programming languages from the scripting paradigm – that is, JRuby, Ruby, Pearl, PHP, JavaScript, and Python. The complete list can be seen here:

Figure 5.16 – Program language efficiency based on variable combinations (Pereira, et al. 2017)
This study’s results allow programmers to become more energy-aware when choosing a programming language for their applications, functions, or modules. It is also important to understand that you can write very efficient code using a scripting language and very inefficient code using an imperative language. Today, most development projects do not start from scratch, and several associated libraries are usually imported. If not careful, these imported libraries can have a significant impact on the performance of your software, so it is important to assess and choose carefully before importing them. As we will see in the next section, several other variables within the SDLC, such as the need for upgrades, can significantly impact your application’s carbon intensity.
Sustainable SDLC
An SDLC consists of several critical steps: plan, code, build, test, release, deploy, operate, and monitor. A sustainable software development life cycle (SSDL) has sustainability by design embedded every step of the way. In traditional software development, this process tended to follow a linear waterfall method, but in the last 10 to 15 years, DevOps has become increasingly popular. DevOps combines software development and IT operations into a continuous cycle, as illustrated in the following diagram. DevOps originally sprung out of the agile software development discipline. Whether your development methodology follows a linear or circular pattern, your aim should be to preserve resources throughout the entire SDLC:

Figure 5.17 – DevOps life cycle
Several sustainable best practices can be considered throughout the process. The aim should be to build as many carbon-efficient and energy-efficient applications as possible. The method of calculating your carbon emissions and carbon intensity will be covered in detail in Chapter 10, Getting Started Today. Let us look at what key considerations can be assessed during the planning, software design and development, and software operations and maintenance phases before learning how to engage your employees and teams.
Plan
The planning phase lays the foundation for your application and makes it easier to embed sustainability in the design from the start through proper planning and awareness. There are several key considerations to be considered during the planning phase:
- Decide on a carbon budget or carbon intensity for your application. It may not be the easiest thing to do from the start, but you should be able to set some ballpark figures such as 0.2 metric tons of carbon emissions per year for your carbon budget or 2 grams of carbon emissions per page load for your carbon intensity. The important thing is to set a goal, and hopefully, that goal can be lowered as you progress through the SDLC.
- Leverage cloud technologies that can bring you several sustainable benefits energy efficiencies, hardware efficiency, compute utilization, cloud-native application architecture, and access to renewable/carbon-free energy. Remember from Chapter 4, Data Center and Cloud, where you learned how you host your software and the way you leverage cloud technologies can significantly impact your CO2 emissions.
- Choose a provider that can power your application with renewable energy, not just through carbon offsets, and provide energy-efficient configuration, monitoring, and optimization capabilities.
- Design modern architectures such as serverless architecture, Functions-as-a-Service (FaaS), and microservices for energy efficiency.
- Design for a multi-cloud setup where workflows can be moved across cloud regions (location-based optimization) and even between different vendors (vendor-based optimization) to optimize your carbon intensity or utilization of renewable energy.
- If you are working with an incumbent application, explore alternative application modernization approaches such as encapsulate, rehost, replatform, refactor, rearchitect, rebuild, and replace.
- Consolidate virtual machines and containers to improve hardware efficiency and resource utilization.
- Leverage automation and Infrastructure as Code (IaC) to reduce manual labor and efficient management of the underlying infrastructure.
- Design for efficient hyperscaling to maximize hardware efficiency.
- Design for carbon-aware time-based optimization, such as deployments, testing, backups, and more to ensure that non-time critical operations are executed when the carbon intensity is low.
These are some of the considerations that you should have in mind during the planning phase.
Software design and development
Several external and internal factors will determine your design and development approach:
- Choose a carbon-friendly programming language (C, C++, Ada, and Java are more energy-efficient than JavaScript, PHP, Ruby, and Python). For more details on carbon-friendly development languages, refer to the section later in this chapter.
- Choose energy-efficient software development frameworks based on your programming language(s).
- Work with energy-efficient software design patterns such as Abstract Factory, Builder, Prototype, Singleton, and so forth.
- Aim to reuse energy-efficient software to decrease custom-made development efforts.
- While setting up your software integrated development environment (IDE), consider an environment that is the most energy efficient. Hosting it in the public cloud versus on-premise in a private cloud can play a significant role in resource efficiency and consumption.
- Leverage automation such as continuous integration/continuous deployment (CI/CD) to improve SDLC efficiency.
- Understand the energy efficiency of third-party libraries/APIs during the selection process.
- Minimize data amounts and multiple data stores wherever possible.
- Leverage carbon-aware/energy-efficient techniques for shaping your demand. For example, run backups or heavily automated test scripts on off-hours.
- Continuously measure and optimize the energy consumption of your development, test, and training environment.
These are some of the techniques that you can leverage within design and development. Regardless of what techniques you choose to apply, it is important to understand how your carbon intensity is impacted by different design and development considerations.
Manage the life cycle of data
Data is the new oil of the digital economy. It is an immensely untapped valuable asset. For those who manage to extract and monetize data, the rewards can be huge. As the wealth of data is created exponentially, by 2025, the amount of data will double every 12 hours (Libert and Beck 2019). On the other hand, research shows that over 70% of the data painstakingly collected and stored by companies goes unused, and what is utilized is often misused (Barrett 2018). From a sustainability perspective, this is a huge cause for concern. We keep adding storage rapidly and uncontrollably, but we lack adequate processes for deleting data.
“More data will be created over the next 3 years than over the history of mankind. The rate of data growth and the environmental cost of data makes it a big concern for sustainability,” says Jedidiah Yueh, Delphix founder and CEO, and cofounder of SustainableIT.org. “It’s critical for companies to apply the rules of DevOps to data, to automate the setup and teardown of data environments used for development, testing, analytics, and AI/ML model training. By enabling ephemeral test runs, companies can reduce the environmental cost of application and data environments by over 90%.”
“There’s also a tension between the speed of innovation and governing consumer data privacy,” Yueh added. “Zero trust is the new standard for data governance. It requires the automation of data discovery, masking, and delivery to all the places where companies need to use their data. Companies should no longer trust administrators, developers, and analysts with access to personally identifiable consumer data. The risk of breach from compromised personnel is simply too high.” Governance is one of the three pillars of sustainability, along with environmental and societal, altogether referred to as ESG.
When designing your systems or application, data quality needs to be top of mind to ensure that the data is up to the mark. Several factors contribute to the quality of data, such as accuracy, completeness, relevancy, validity, timeliness, and consistency, which should be considered. As time goes on, your data quality will start to disintegrate. Similarly, you should automate the setup of your production, test, and development environments to ensure accurate data supply chain flows. In your test environments, you want to use anonymized production data, which can be a time-consuming task if done manually. Having an automated supply chain of quality anonymized data in your test environments that also meets data privacy standards is a must.
Software operations and maintenance
Managing your application over its life cycle is the phase where we will most likely have the most impact. Therefore, it is important to have a long-term perspective and make sustainable decisions on how you operate and maintain your application:
- Ensure your environment runs on renewable energy sources.
- Continuously measure and optimize the energy consumption of your production environment. Measure the carbon intensity on applications with high change frequency.
- On the network, minimize the amount of data and the distance it must travel.
- Deploy code close to the edge to minimize network latency and minimize data transfer.
- Leverage demand shaping with built-in carbon-aware mechanisms to run batch jobs, deployments, back-ups, and automated test scripts during off-hours.
- Shut down non-production environments (user acceptance testing (UAT), training, integration testing, development, and so on) when not in use. For example, at nighttime, at weekends, on holidays, or when change frequency is low.
- Continuously optimize and refactor applications and APIs to run more efficiently and reduce unused code or feature sets.
- Measure and optimize the carbon intensity of test suites.
- Rationalize applications that are not in use or can be migrated. See the section above in this chapter on application rationalization.
- Leverage automation and AI/ML (AIOps) to continuously optimize utilization, workload, power consumption, and memory size.
It is important to be able to measure your carbon intensity over time and understand the variable change. Applying some of these techniques should help minimize the carbon emission impact over time.
Windows updates become carbon-aware
Recently, Microsoft announced that their Windows update for Windows 11 users would become carbon-aware and let administrators and users install updates when the carbon intensity is low. This means that the Windows Update function will schedule updates when many renewable energy sources are available. The option will initially only be available in locations where carbon intensity measurements are performed. The feature is in insider preview currently, but when it gets released into the mainstream market, it has the opportunity in the long term to impact 1.4 to 1.5 billion computers worldwide running Windows 11.
Employee and team engagement
On the road to becoming more sustainable, culture and change management are integral parts, and your software engineers are no different. It is essential to promote and raise awareness and make sustainable software development part of the fabric of every development team, project, or product:
- Raise awareness about sustainable software practices both internally and externally.
- Appoint sustainability champions to reinforce the message and train and empower your team members.
- Promote and reward the use of sustainable software development practices.
- Establish a carbon emission baseline and determine carbon intensity for each application. Set collective goals to reduce your carbon emission footprint against your carbon budget radically. Some companies use internal carbon taxes and link compensation packages directly to sustainability parameters.
- Promote the use of efficient and effective collaboration tools to reduce business travel and office commuting.
Activating and engaging are critical factors to change the culture and the mindset of the organization. Bringing people onto the journey and making them part of the change will enable you to collectively create a positive force within the organization.
How can you get involved with your peers?
If you want to get involved with your peers outside your company on the topic of Green Software, the Green Software Foundation (GSF) is an excellent place to start. The GSF is a non-profit organization under the Linux Foundation with organizations and individuals involved in several working groups to further the mission of building a trusted ecosystem of people, standards, tooling, and best practices for Green Software. Steering members include Accenture, Avande, BCG GAMMA, GitHub, Globant, Intel, Microsoft, NTT Data, Thoughtworks, and UBS. You can read more at https://greensoftware.foundation/.
In this section, we will hear from Asim Hussain, one of the founders and chairperson of the GSF and Director of Green Software and Ecosystems at Intel.
The GSF has a theory of change where they define the desired outcome as a future where there are zero harmful environmental effects from software, and for that outcome to materialize, the following need to occur:
- We need changes in tech culture so that the environmental effects of software are made a priority.
- We need changes in knowledge so that the environmental effects of software are studied, taught, and understood
- We need changes in tooling so that the environmental effects from software are easy to act upon
Adopting green software practices will not be easy or free; everything will involve some investment, which means there will always be resistance to adoption. All three pillars of the Theory of Change work together to accelerate the adoption of green software practices.
Changing tech culture so that sustainability becomes a core priority reduces the resistance to change. It does not make adopting green software practices any easier; it changes people, so they are more willing to invest. Tooling makes adopting green software practices easier; it reduces the investment that needs to be made. Knowledge is core to everything; people working in tech need an understanding of the environmental impacts of software, as well as how to eliminate them.
At the time of writing, we define green software as carbon-efficient software that emits the fewest GHGs possible. In the future, we will move beyond carbon to include other environmental effects such as water and waste, but currently, our focus is carbon. Our position is that there are only three ways an application can eliminate its carbon emissions:
- Energy efficiency: Use the least amount of energy possible
- Hardware efficiency: Use the least amount of embodied carbon possible
- Carbon awareness: Do more when the electricity is clean and less when it is dirty
As part of our mission to increase knowledge, we have created Green Software Practitioner Training and Certification (https://grnsft.org/practitioner). In addition, as part of our mission to change the tech culture, we are growing a global community (https://meetup.com/pro/gsf) of green software advocates. Finally, as part of our mission for tooling, we are creating standards for measuring software emissions (https://grnsft.org/sci) and tooling (https://github.com/Green-Software-Foundation/) to help green software practitioners eliminate their emissions.
The foundation also provides some excellent resources that I recommend you look further into, including Awesome green software (https://github.com/Green-Software-Foundation/awesome-green-software) and Principles of Green Software Engineering (https://principles.green/):
Sustainable software engineering summary – the 3Rs principles
As outlined previously, there are several things that you can do throughout the SDLC to create more environmentally efficient IT systems. If you were to remember only three things that you can do as a software engineer, they should be the 3Rs principles – relocate, right-size, and rearchitect:
- Relocate: As we learned previously, not all energy is created equal. Where you place your workload can have a massive impact on your carbon intensity. The global carbon intensity average of electricity generated is 475 gCO2/kWh. In Norway and Sweden, which use a large share of renewable energy, the carbon intensity drops to 25 gCO2/kWh, which is an improvement factor of 19 compared to the global average. With the flexibility that hyperscalers offer, it is easy to choose a low-carbon location that can also meet your information security and data privacy requirements. electricitymap.org is a great resource to find out in near-real-time what the carbon intensity is within a country or region. We will look closer at https://www.electricitymaps.com/ in Chapter 7, Energy Resource Management.
- Right-size: Right-sizing your application means you make efficient use of computing resources to translate business requirements into hardware requirements and hardware usage into a carbon footprint. It is about finding the right balance between end-to-end user experience, response time, throughput, and economical/sustainable resource consumption. Considering time-sifting daily, weekly, or monthly variations by running heavy workloads such as batch jobs at night when the carbon intensity is typically lower is also an important factor to consider. Right-sizing your applications typically require servers with less power that are usually cheaper to acquire and lighter, which means they require less raw material and are more operationally efficient to run since they consume less energy.
- Rearchitect: Managing your technical debt is one of the most important things you must do to ensure the longevity of any application from a performance, security, and end user experience perspective. Unfortunately, managing your technical backlog is often overlooked in favor of functional requirements but if it is not managed properly, it can easily mount up and introduce significant technology risks such as slow performance, unplanned downtime, data loss, or even security breaches. Not all applications are suitable to be rearchitected but where the opportunity exists, it is important to explore more energy-efficient programming languages (as mentioned previously) and use SaaS or FaaS over servers where possible.
In the next section, we will take a closer look at how to measure CO2 spending in the cloud using the hyperscaler’s tools and what other alternatives are available on the market.
Measuring your CO2 spend in the cloud
As we saw in Chapter 4, Data Center and the Cloud, the three most dominant cloud hyperscalers – Amazon Web Services (AWS), Microsoft Azure, and Google – heavily emphasize their commitment to sustainability. All three vendors now provide a solution to understand carbon emissions and provide tools or recommendations to reduce the carbon footprint. The methodology varies between the three vendors in terms of GHG scope completeness, calculation approach, and coverage of services, which questions the comparability. There are also other vendors on the market that provide the same capability and this space is far from standardized and mature.
It is essential to have a holistic view of your landscape as a company, but so far, limited integration capabilities between the vendors have been observed. Therefore, you must look elsewhere to find a combined representation of your cloud estate. Toward the end of this section, we will look at a case study from Gaia Generation, which provides an analytical solution that visualizes the CO2 emissions footprint across your cloud estate. There is also an open source alternative from Thoughtworks called Cloud Carbon Footprint (CCF) that provides similar capabilities to measure, monitor, and reduce your cloud carbon emissions. You can read more at http://www.cloudcarbonfootprint.org/.
First, let us look at what tools are available from the three cloud hyperscalers. In the following comparison table, they square up against each other:

Table 5.4 – Cloud provider carbon footprint tool comparison
As you can see, AWS and Microsoft Azure’s carbon footprint tool is generally available, but Google’s carbon footprint tool is currently in public preview. The positive thing is that if you are utilizing one or more of these cloud providers, you will be able to measure your carbon emissions and provide recommendations on how they can be reduced further. A word of caution on the methodology: AWS only measures Scope 1 and 2, Google measures Scope 2, and Microsoft Azure aims to provide an accurate view across Scope 1, 2, and 3. It is also essential to understand that this type of reporting is best suited to report on your carbon footprint monthly, quarterly, or yearly. However, it is not a suitable tool for applications with a high rate of change, and where you continuously want to measure your carbon intensity. How you calculate the carbon intensity for a specific application will be covered in detail in Chapter 10, Getting Started Today.
If you want to have an aggregate view of the CO2 emissions of all your cloud vendors, you will have to combine them by yourself. The following is a sample dashboard with emissions per vendor, combined, and emission intensity per account. Please note that this is sample data and should not be used to benchmark or compare carbon emissions for any vendors:

Figure 5.18 – Cloud provider CO2 emission sample report
As this dashboard must be aggregated manually by extracting source data from three different tools, it can quickly become a cumbersome task. If you are a large organization, you probably have a handful of more sizable vendors where you need to extract and aggregate emission data to have an accurate view.
As mentioned previously, solutions on the market are starting to emerge, and one example is Gaia Generation, an intrapreneurial start-up initiative financed by Scania CV AB. Scania is one of the largest commercial vehicle manufacturers in the world. They primarily focus on heavy lorries, trucks, and buses, with increased focus on electrified transport. Sustainability is at the core of Scania’s business strategy, and it is committed to making a shift toward a sustainable transport system. The company has set science-based targets related to decarbonization and is committed to increased use of renewable fuels and electrified vehicles to reach its science-based targets.
As the software share is exponentially increasing in their commercial vehicle product portfolio, Scania felt the need to better visualize their carbon emission from their IT landscape; hence, Gaia Generation was born. Elsa Westin is the IT Sustainability Lead at Scania and the cofounder of Gaia Generation. Her mission was to “create an analytic solution that visualizes the CO2e footprint of IT systems used daily by the world’s largest and most innovative enterprises, seeking to make IT systems as environmentally efficient as possible while maximizing business value.” The plan is to connect all three major cloud vendors – AWS, Microsoft Azure, and Google – to deliver a holistic dashboard for developers to target optimization opportunities daily. The following is a sample dashboard with estimated historical CO2 emissions (per gram) and energy (Wh) during a 30-day cycle. It’s interesting to see that CO2 emissions can vary between 3,200 grams and 9,000 grams on a given day:
Figure 5.19 – Gaia Generation emission dashboard (image courtesy of Gaia Generation)
The product is now commercially available, and you can read more about it in the Further reading section of this chapter.
Summary
In this chapter, you learned how to optimize your entire application portfolio and a single application to run more sustainably and emit less carbon. You learned about benefits, cost, and emission opportunities as an introduction to application portfolio management. By now, you should have a good understanding of the application rationalization process, application assessment criteria, and TIME analysis from a cost, carbon emission, and carbon cost perspective.
Furthermore, you should understand what opportunities exist within sustainable software development, from choosing an energy-efficient programming language to key considerations during each step of the way in the SDLC.
Finally, it would help if you gained some insight into what tools are available from the major cloud providers – AWS, Microsoft Azure, and Google – to measure your carbon emissions in the cloud, take a holistic approach, and measure your entire cloud estate.
- Here are some key recommendations for you:
- Energy efficiency:
- Start shifting out resource-intense and inefficient legacy applications in your application portfolio to enterprise cloud solutions that can power your ERP, CRM, SCM, and e-commerce ventures.
- Monitor energy consumption down to the application level. Use the least amount of energy possible.
- Utilize or shift to energy-efficient application architectures such as serverless computing or FaaS.
- Minimize data amounts and multiple data stores wherever possible.
- Hardware efficiency:
- Choose hardware wisely. Use the least amount of embodied carbon possible.
- Carbon awareness:
- Utilize or shift your application portfolio to providers utilizing low-carbon grids
- Explore time, location, and vendor-based demand shaping
- Move workflows across cloud regions, depending on low-carbon availability
- Energy efficiency:
Now that you have reached the end of this chapter, you should understand how you can start to optimize your entire application portfolio and optimize a single application. Both topics are pretty broad, and if you see a significant opportunity to reduce carbon emission within your application portfolio or a single application, I recommend studying the concept further and downloading the book resources from www.sustainableitplaybook.com or exploring the Further reading section.
In the next chapter, we will look at how we can tackle embodied carbon and manage our IT hardware more circularly.
Further reading
To learn more about the topics that were covered in this chapter, take a look at the following resources:
- The Application Rationalization Playbook: https://www.cio.gov/assets/files/Application-Rationalization-Playbook.pdf.
- Awesome green software – research, tools, code, libraries, and training for building applications that emit less carbon into our atmosphere: https://github.com/Green-Software-Foundation/awesome-green-software.
- Cloud Carbon Footprint, an emissions measurement and analysis tool. Free and open source: http://www.cloudcarbonfootprint.org/.
- Computer benchmark game: https://benchmarksgame-team.pages.debian.net/benchmarksgame/index.html.
- The Green Software Foundation: https://greensoftware.foundation/
- Gaia Generation: https://www.gaiagen.eu/
- AWS Carbon Footprint tool: https://docs.aws.amazon.com/awsaccountbilling/latest/aboutv2/what-is-ccft.html
- Microsoft Azure Emissions Impact Dashboard: https://www.microsoft.com/en-us/sustainability/emissions-impact-dashboard?activetab=pivot_2:primaryr12
- Google Cloud Carbon Footprint: https://cloud.google.com/carbon-footprint
Bibliography
- Calero, Coral, and Mario Piattini. 2015. Introduction to Green Software Engineering. Springer International Publishing.
- Carlsson, Rebecka. 2021. Exponentiell klimatomställning. Stockholm: Lava förlag.
- Elizabeth, Jane. 2017. Java is one the most energy efficient languages, Python among the least energy efficient. September 18. Accessed May 05, 2022. https://jaxenter.com/energy-efficient-programming-languages-137264.html#:~:text=However%2C%20Java%20is%20one%20of,majority%20of%20the%20energy%20consumed.
- Gartner. n.d. “Glossary.” Gartner. Accessed April 30, 2022. https://www.gartner.com/en/information-technology/glossary/application-program.
- Grotty, James, and Ivan Horrocks. 2017. “Managing legacy system costs: A case study of a meta-assessment model to identify solutions in a large financial services company.” Applied Computing and Informatics 13 (2): 175-183. Accessed April 05, 2022.
- IDC. 2021. Cloud Computing Could Eliminate a Billion Metric Tons of CO2 Emission Over the Next Four Years, and Possibly More, According to a New IDC Forecast. IDC. March 08. Accessed January 31, 2022. https://www.idc.com/getdoc.jsp?spm=a2c65.11461447.0.0.964e28 c6a8EcQ2andcontainerId=prUS47513321.
- IEA. 2019. Emissions. Accessed July 06, 2022. https://www.iea.org/reports/global-energy-co2-status-report-2019/emissions.
- Infosys. 2018. “Case study: SAP success stories life sciences.” Infosys. Accessed April 05, 2022. https://www.infosys.com/industries/life-sciences/case-studies/Documents/SAP-success-stories-life-sciences.pdf.
- Lacy, Peter, Paul Daugherty, Pavel Ponomarev, and Kishore Durg. 2020. The green behind the cloud. Accenture. September 22. Accessed January 31, 2022. https://www.accenture.com/_acnmedia/PDF-135/Accenture-Strategy-Green-Behind-Cloud-POV.pdf.
- LeanIX. 2022. “Enterprise Architects on IT Priorities for 2022.” Leanix.net. Accessed June 01, 2022. https://www.leanix.net/en/download/enterprise-architects-on-it-priorities-2022.
- —. 2019. “Enterprise Architecture Insights Report.” Accessed March 24, 2022. https://www.leanix.net/en/download/enterprise-architecture-insights-report-2019.
- —. 2019. “How Application Rationalization Contributes to the Bottom Line - and a Guide to Do it.” LeanIX. February 19. Accessed April 30, 2022. https://www.leanix.net/en/blog/how-application-rationalization-contributes-to-the-bottom-line-part-one.
- Microsoft News Center. 2018. The Microsoft Cloud can save customers 93 percent and more in energy and carbon efficiency. Microsoft. May 17. Accessed January 27, 2022. https://news.microsoft.com/2018/05/17/the-microsoft-cloud-can-save-customers-93-percent-and-more-in-energy-and-carbon-efficiency/#:~:text=%E2%80%94%20May%2017%2C%202018%20%E2%80%94%20A,issued%20Thursday%20by%20Microsoft%20Corp.andtext=These%20gains%2C%20as%.
- MSCI. 2022. Who cares about the UN Sustainable Development Goals? Accessed July 06, 2022. https://www.msci.com/who-cares-about-the-un-sustainable-development-goals.
- Pereira, Rui, Marco Couto, Francisco Ribeiro, Jácome Cunha, Joâo Paulo Fernandes, and João Saraiva. 2017. “Energy Efficiency across Programming Languages - How Does Energy, Time, and Memory Relate?” https://greenlab.di.uminho.pt. September. Accessed May 05, 2022. https://greenlab.di.uminho.pt/wp-content/uploads/2017/09/paperSLE.pdf.
- Taina, Juha. 2011. Good, Bad, and Beautiful Software - In search of Green Software Quality Factors. CEPIS UPGRADE.
- U.S. Federal CIO Council. 2020. “The Application Rationalization Playbook - An Agency Guide to Portfolio Management.” cio.gov. Accessed April 30, 2022. https://www.cio.gov/assets/files/Application-Rationalization-Playbook.pdf.