
Chapter 4: Implementing Microsoft Defender for Identity
Now that we've covered the deployment process of Microsoft Defender for Endpoint (MDE), it's time to move on to Microsoft Defender for Identity (MDI). This tool, in my opinion, is perhaps one of the best, if not the best, tools in the Microsoft 365 security stack. We can talk all day long about how the cloud is everything right now, but the reality is that most businesses have an on-premises presence, and that almost always means Active Directory. With Active Directory being at the core of operations as the hierarchal structure of your computer and user accounts within an environment, it's critical we keep it protected by monitoring its signals.
Firstly, its previous name is Azure Advanced Threat Protection (AATP), and no – it's not the same as Advanced Threat Analytics (ATA). I'll explain why. I always hear confusion about ATA, AATP, and MDI, with people asking whether MDI is an improvement over ATA or just a rebrand. First, ATA is still ATA, which is an on-premises-only product. It used a network parsing engine to digest the network traffic that it gathered. Since it was on-premises only, it was collected by either a port-mirroring method or from an ATA gateway installed on the domain controllers that sends data to the ATA center, which is where the behavioral machine learning happened to detect threats. ATA has since been deprecated, with mainstream support ending on January 12, 2021, and extended support continuing until January 2026.
Let's spend a little time talking about MDI and all the wonderful things it can do. For clarification, AATP became MDI, and that was to align with the Defender nomenclature. I generally get annoyed with rebrands, but this one made sense. MDI is a cloud-based solution that takes signals from Active Directory and analyzes them to help detect and identify threats, compromised accounts, or even insider activities. Let's look at a few things to highlight that:
- Monitor user behavior and activities: MDI monitors user activity and information as it traverses the network, things such as permission and group changes, and tries to create what's normal for this user?, and this acts as a baseline to compare future anomalies when determining malicious behavior.
- Protect your user identities' attack surface: With information being analyzed by MDI, it can give you insights into your posture and where improvements can be made. One such area where you can see these suggestions is the Identity Security Posture page within the Cloud App Security portal. An example of this can be seen in Figure 4.1.
- Identify activities and attacks across the kill chain: MDI will help identify attacks launched against any monitored entity such as low-privileged users, where an attacker then moves to more sensitive assets such as domain admin or sensitive data repositories. When it comes to the kill chain, we're looking at areas such as the following:
a. Reconnaissance: Being able to identify rogue users or threat actors trying to acquire information by searching around for details on user accounts, group memberships, and IP addresses
b. Compromised credentials: Picking up on brute-force attacks, failed authentications, or odd group membership changes.
c. Lateral movement: Detecting pass the ticket, pass the hash, or overpass the hash attacks so that threat actors can move laterally to gain more sensitive access
d. Domain dominance: Observing behaviors that highlight that a domain has been compromised; such activities include DCSync attacks, Golden Ticket usage, or remote code execution attempts.
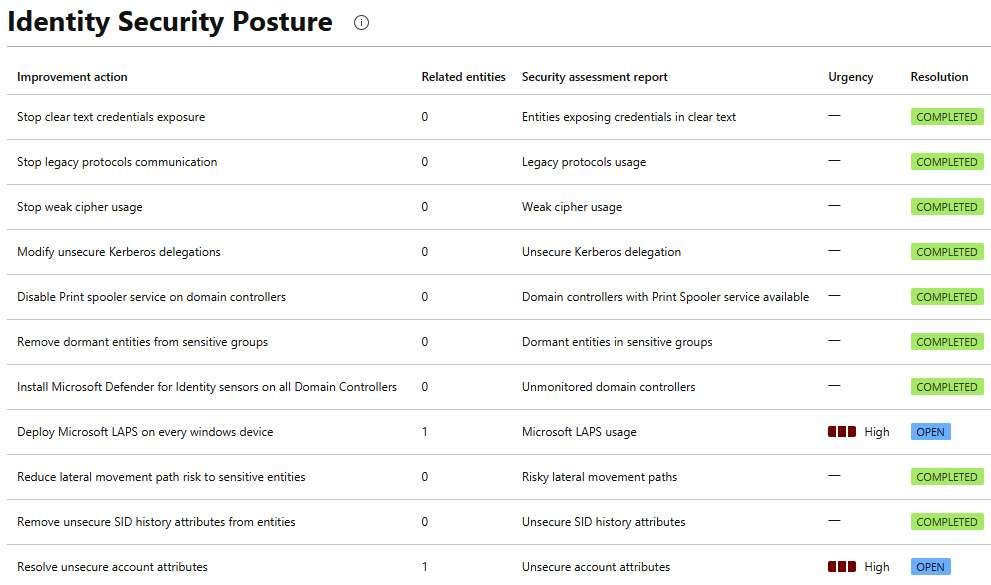
Figure 4.1 – An example of the Identity Security Posture report
To add to its capabilities, you can integrate MDI with MDE to provide another layer of detection details to give a complete picture of a potential threat.
Now that we've talked a little bit about what MDI is, let's dive into the chapter. Following a similar structure to Chapter 3, Implementing Microsoft Defender for Endpoint, we're going to cover the following main topics:
- Understanding the prerequisites
- Deployment options
- A troubleshooting guide
- Service status and verification
Technical requirements
Just like the last chapter, we'll talk about a few technical requirements that will make some of this easier, as well as allow you to explore further if you wish to:
- Basic executable installations
- Command Prompt
- A basic networking knowledge
- Microsoft Endpoint Configuration Manager (optional – you'll see why later)
Understanding the prerequisites
While the prerequisites for MDI are a lot less complex than MDE, there are still some newer concepts that can be tricky for some, but don't worry – we'll cover most of them. However, before we get into that, I wanted to go over the architecture of the MDI sensor and service so that you can conceptually understand the data flow.
Next, in Figure 4.2, we have a nice diagram that's provided to us by Microsoft, which can be found on the MDI architecture docs page (https://docs.microsoft.com/en-us/defender-for-identity/architecture). It shows how sensors installed on the domain controllers or Active Directory Federation Services (AD FS) servers send the captured data, which has been nicely parsed, to the MDI backend. From there, the activities and alerts are presented in the Microsoft Defender for Cloud Apps (MDCA) portal. Alerts pertaining to MDI are now also in the security.microsoft.com portal. Time will tell whether the sole resting place for alerts will be there; it certainly seems like a single pane of glass is the goal.
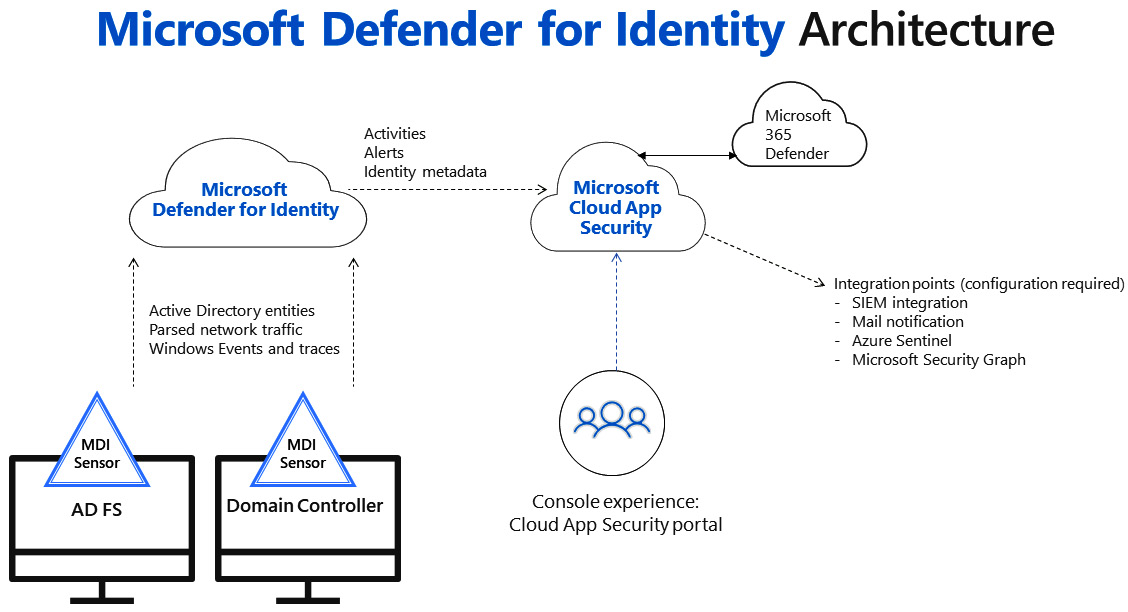
Figure 4.2 – Microsoft Defender for Identity Architecture
Okay, let's move on to some of the prerequisites. We'll approach this logically, and by that, I mean that we'll quickly talk about getting your MDI instance created and connected to Active Directory and then on to the prerequisites for domain controllers or AD FS services due to get the sensor. For the full list, refer to these docs: https://docs.microsoft.com/en-us/defender-for-identity/prerequisites.
First things first – head over to https://portal.atp.azure.com/ and get your instance created simply by clicking on Create, as shown in Figure 4.3. At the time of writing, the MDI portal is in the process of moving to security.microsoft.com. From there, go to Settings > Identities.
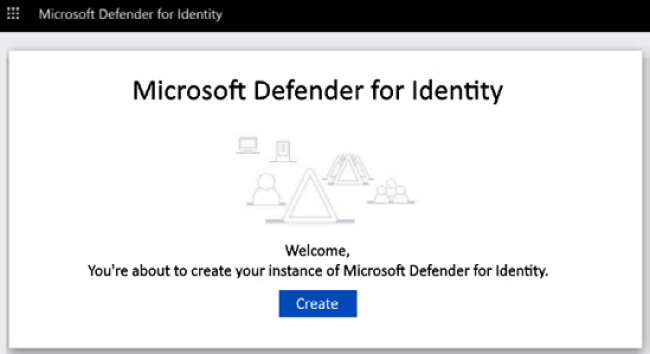
Figure 4.3 – Microsoft Defender for Identity
After the instance gets created, we'll have a few steps to perform. Figure 4.4 is an example of what you'll see:
- Provide a username and password to connect to your Active Directory forest
- Download Sensor Setup and install the first Sensor
- Configure the first Sensor
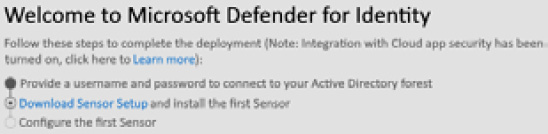
Figure 4.4 – Microsoft Defender for Identity architecture
Now, let's talk about some of the things that your devices and environment will need to have for a successful sensor installation and how to get them. This will be for the sensors installed on domain controllers; we'll cover the standalone sensor following this list:
- Microsoft .NET Framework 4.7 or later: If this is not installed on the targeted machines, the sensor setup package will install it for you, as it's included. Keep in mind that installing .NET may require a reboot, so if you're planning a large deployment, I suggest scoping out the .net flavors ahead of time.
- As of now, you should know that Npcap is the recommendation and can be deployed ahead of time. At the time of writing, when you download the aatp sensor package, it includes the OEM version that allows you to install silently, which is nice. Maybe, someday, the installation will take care of it – who knows?
- AD FS servers: While we won't cover this much at all, there are a few things you'll want to do ahead of time:
a. Configure the auditing level to Verbose: https://docs.microsoft.com/en-us/defender-for-identity/prerequisites#windows-event-logs.
b. If using Structured Query Language (SQL) and not Windows Internal Database (WID), the SQL server needs to allow the directory service account to connect, log in, read, and select permissions in the AdfsConfiguration database. Go to Configuration > Directory services > Username.
The MDI sensor needs a minimum of the following ports, and in case this changes, here's the docs page: https://docs.microsoft.com/en-us/defender-for-identity/prerequisites#ports.
The following is the table:
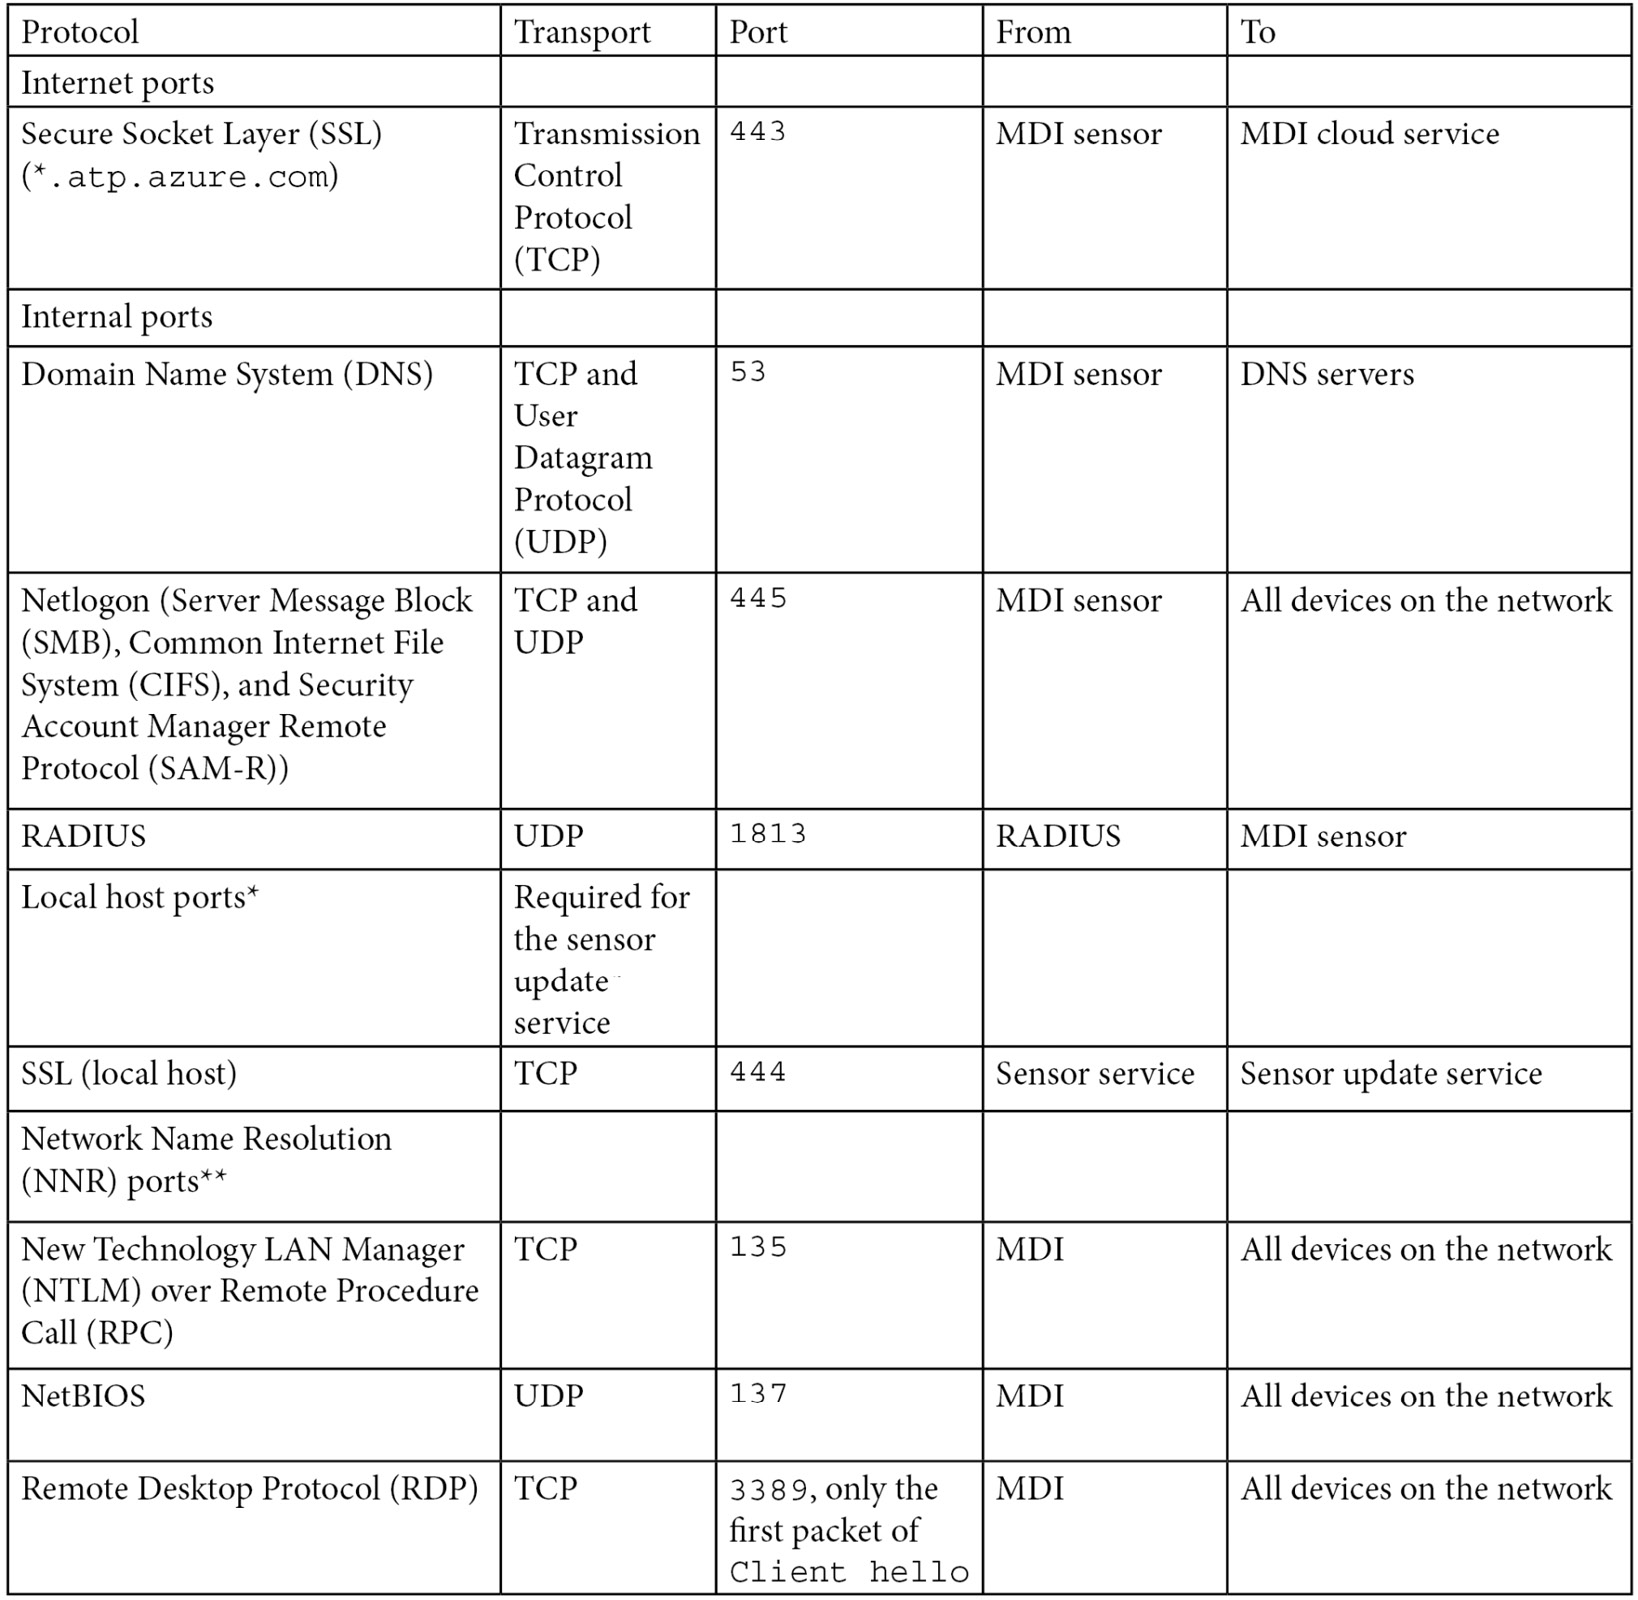
Table 4.1 – The MDI sensor port requirements
Another consideration is the service account you'll be using. Microsoft recommends that you use a group Managed Service Account (gMSA) for its improved security and automatic password management, not to mention administrative overhead. However, that recommendation comes with some caveats, as follows:
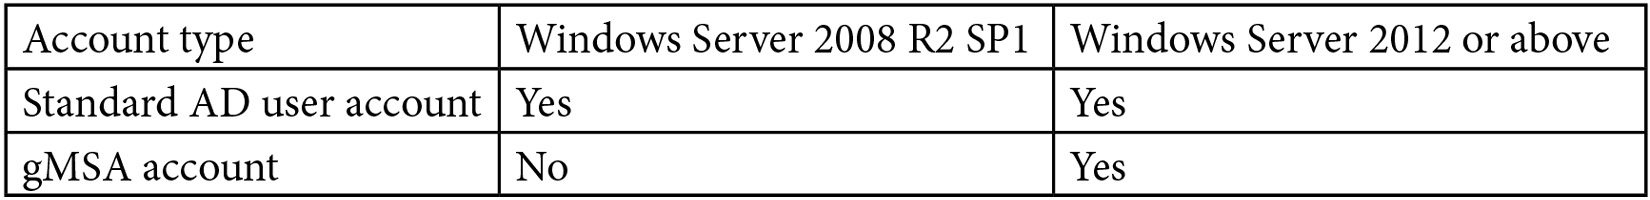
Table 4.2 – Service account considerations
Now, let's talk about the prerequisites for the standalone sensor, which is where you will likely have a scenario where the domain controllers are so locked down that they cannot talk out over the internet. In this case, the sensor is installed on a member server. Before listing what we need to be wary of, let's first list some of the missing features versus the domain controller installation. A full list and additional setup details can be found at the following docs page: https://docs.microsoft.com/en-us/defender-for-identity/prerequisites#defender-for-identity-standalone-sensor-requirements:
- It does not support the collection of Event Tracing for Windows (ETW).
- It requires at least one management adapter and at least one capture adapter.
- The following ports need to be open: https://docs.microsoft.com/en-us/defender-for-identity/prerequisites#ports-1.
One last consideration is the operating systems that we can install MDI on, which we can see in Table 4.3:
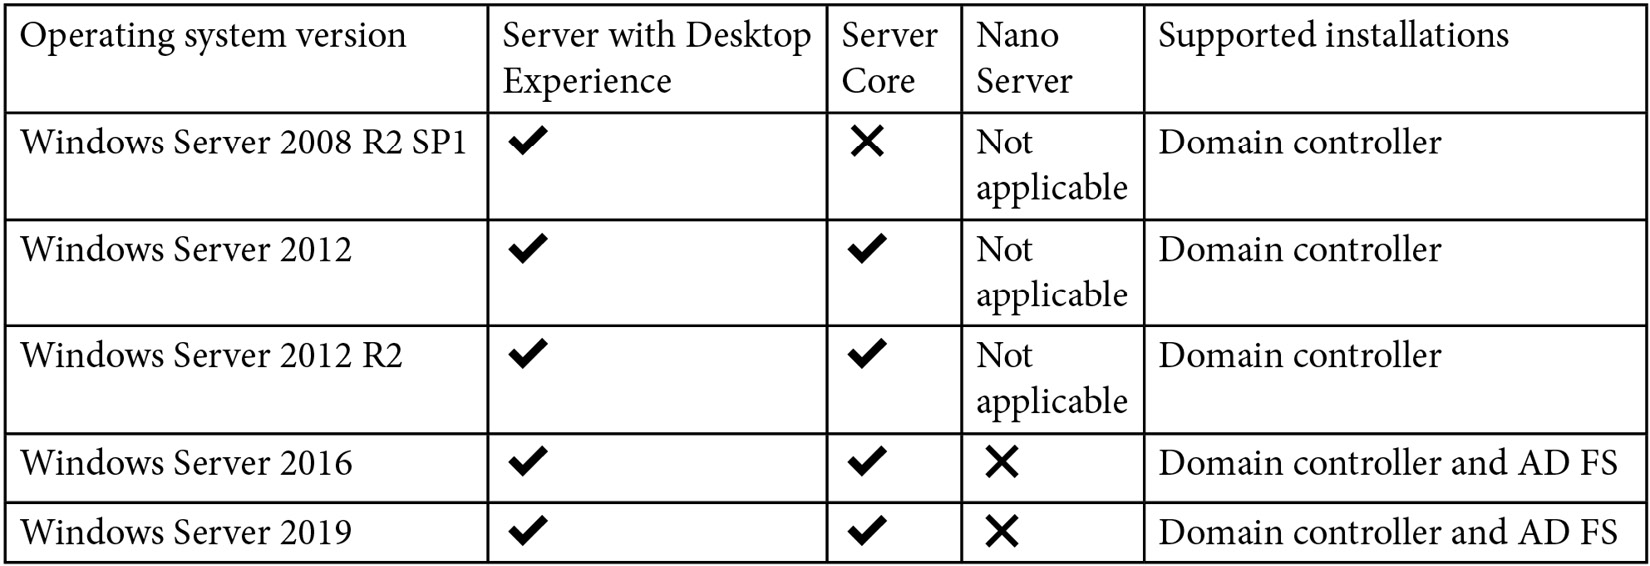
Table 4.3 – The MDI sensor operating system support
Now that we have gone through most of the prerequisites to get our tenant ready, and our devices and environment prepped, we'll want to do one last thing – run the capacity planner. This should only apply to larger environments where you may not know the hardware specs for all of your domain controllers and need to assess whether they're capable or not. Before we start with that, let's look at the minimum hardware requirements:
- A minimum of two cores
- 6 GB of RAM
- Power Option set to High Performance
For a full set of requirements, refer to the following URL: https://docs.microsoft.com/en-us/defender-for-identity/capacity-planning.
When you download the capacity tool, which is called TriSizingTool, you'll see the following contents:
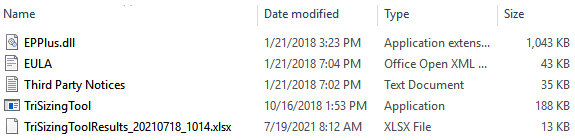
Figure 4.5 – TriSizingTool for capacity planning
Once you initiate TriSizingTool.exe from an admin command prompt, you'll see something like the following snippet, where we can see some Windows Management Instrumentation (WMI) queries being run on the domain controllers to get some basic information on the machines, and eventually, you'll see it start collecting performance counter samples. Ideally, you'll let this run for 24 hours to ensure you capture the peak hours:

Figure 4.6 – A TriSizingTool command prompt example
Once complete or once you exit the command from running, you'll get an Excel file, as shown previously in Figure 4.5. Inside the Excel files will be a status on each Domain Controller (DC) that was queried, along with some stats on them and any recommendations for hardware changes. Refer to the following as an example:
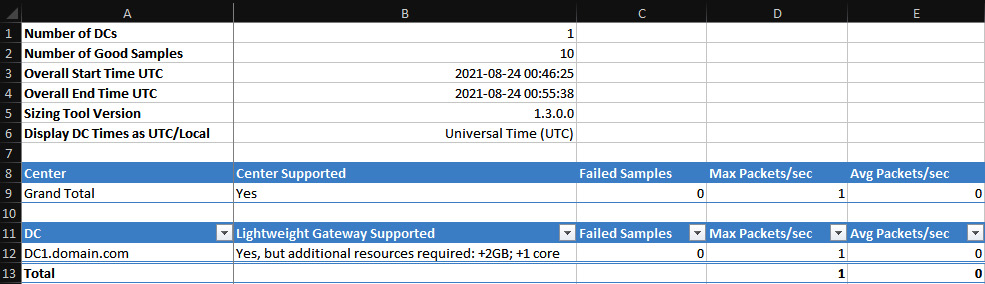
Figure 4.7 – A TriSizingTool output example
That's it as far as considerations for prepping our domain for sensor installations go; now, we can focus on the deployment options. Oddly enough, we'll cover what you can consider as prerequisites when we cover troubleshooting. By that, I mean that you can easily script out some checks for other things you run into when troubleshooting larger deployments so that they can be handled at scale. You'll understand what I mean later on when we get to troubleshooting.
Deployment options
When it comes to deployment options for MDI, it appears limited from a documentation standpoint, as it only talks in the context of manual installations. I don't believe the word deployment is even included in the documentation. So, let's list what we're going to cover in terms of options:
- A manual installation using the graphical user interface (GUI)
- A manual, silent installation
- Microsoft Endpoint Configuration Manager
Most installations will likely be manual, and I say that solely based on experience. I've seen large global companies install it manually on hundreds of domain controllers. Those instances were that way largely because they had the personnel and time and, overall, wanted to be delicate considering the application. It's up to the customer to decide whether they want to deploy it.
With that said, let's cover what manual GUI installation looks like. When you download the sensor package from the portal, you'll see the files shown in Figure 4.8:
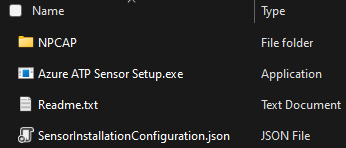
Figure 4.8 – The contents of Azure ATP Sensor Setup.zip
In Figure 4.9, you'll see a json file example, which contains the information that the executable will use for configuration:
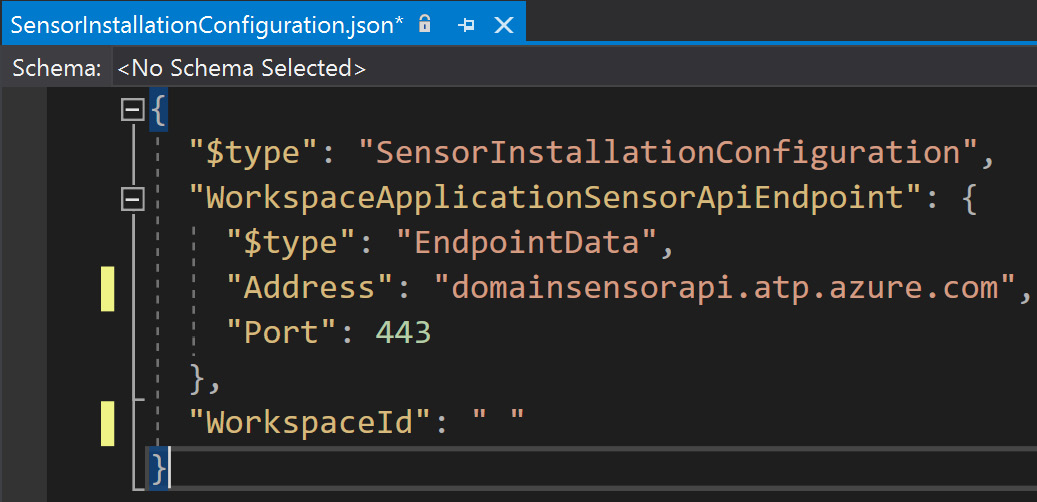
Figure 4.9 – An example of SensorInstallationConfiguration.json
As we can see in the ZIP file, we get a few things, such as Npcap, the sensor executable, a README file, and a JSON file. First up is Npcap, a packet capture library that allows Windows to capture network traffic, which we'll want to install first. Next is Azure ATP Sensor Setup.exe, which is the executable for the sensor itself, which uses the json file for its configuration details, containing useful things such as the address to the specific api URL, the port, and the workspace ID.
Let's go ahead and kick off the executable with admin rights. We'll see the following three screens, shown in Figure 4.10, Figure 4.11, and Figure 4.12 in succession:
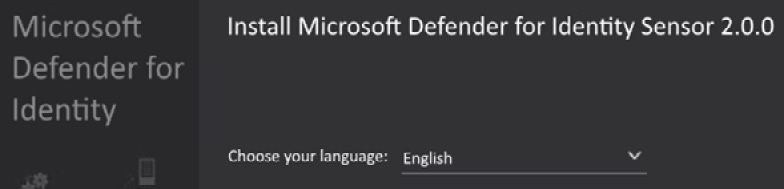
Figure 4.10 – The MDI sensor installation GUI
Here, we can see that it automatically senses what it's being installed on.
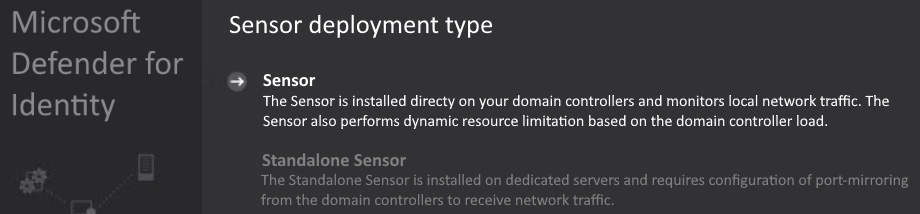
Figure 4.11 – The MDI sensor installation GUI
Lastly, enter the access key that you copied from the portal when you downloaded the sensor package.
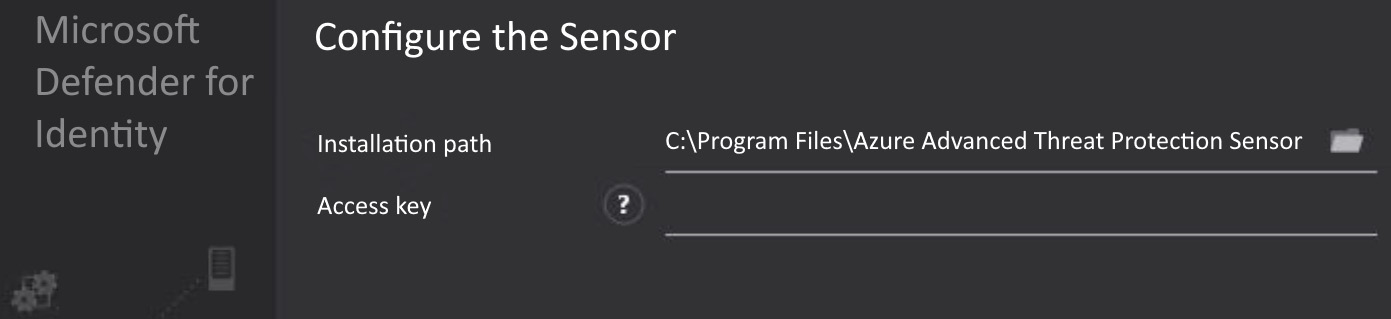
Figure 4.12 – The MDI sensor installation GUI
That's it! The service will go through a few cycles of starting and running now, but that's completely normal. Give a quick check of the services in Figure 4.13 to see that they're running and you can move on to the next one:
Figure 4.13 – MDI sensor services
MDI portal URL: https://security.microsoft.com/settings/identities?tabid=sensor.
By this point, you'll see the device in the portal as well, as shown in Figure 4.14, where you'll see things such as Version, Service status, and Health status:
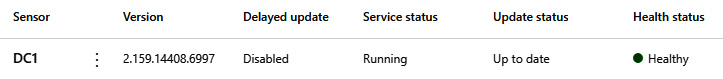
Figure 4.14 – The MDI sensor in the portal
Next, let's talk about the silent installation. The following is an example of the command line that we'd use:
"Azure ATP sensor Setup.exe" /quiet NetFrameworkComma"dLineArguments="/q" AccessKey"Key" ProxyUrl=http://proxy.domain.com:8080
See Table 4.4 for a breakdown of the different parameters that are being used or that can be used:
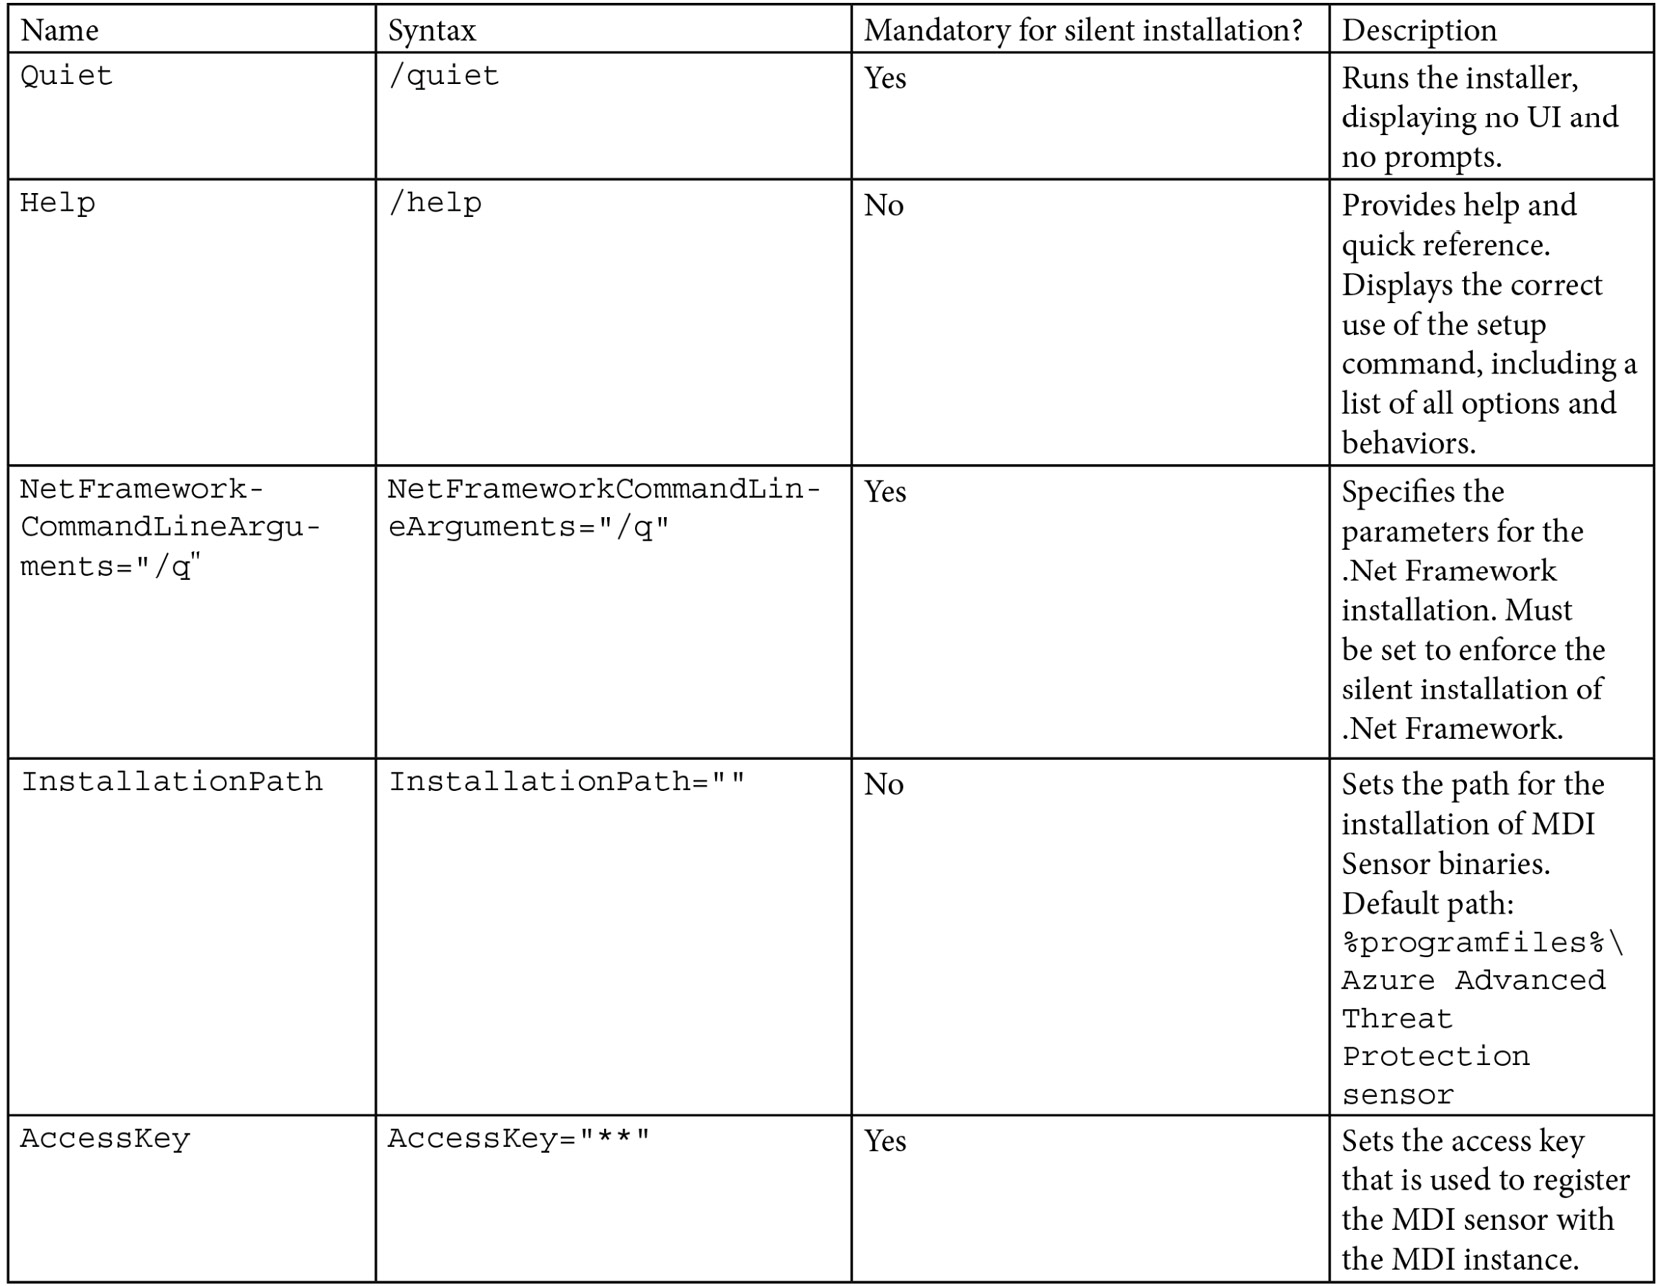
Table 4.4 – MDI sensor silent install parameters
Again, that's it! The service will go through a few cycles of starting and running. Another quick check of the services and we're all set. Like before, this device will show up in the portal as well.
Figure 4.15 – The MDI sensor services
MDI portal URL: https://security.microsoft.com/settings/identities?tabid=sensor.
You can see the current device status within the security portal link provided below, where we get the full health status of the sensor. Refer to Figure 4.16 as an example.
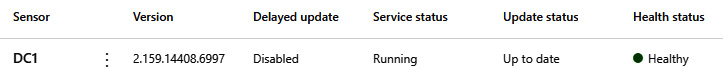
Figure 4.16 – The MDI sensor in the portal
Another installation method that I have been using lately is Microsoft Endpoint Configuration Manager (MECM), provided the customer has it, which most seem to these days. This is a simple standard program, with a command line calling the sensor executable and any switches needed. Let's look at what this looks like as we go through the process.
As I mentioned in the prerequisites, Npcap is a recommendation and can be deployed ahead of time, and we'll do exactly that. In Figure 4.17, I have started creating a standard program and have set the source folder as the Npcap folder that came with the MDI sensor download that we talked about earlier. Of course, I have copied that to a software distribution share that I have in my lab.
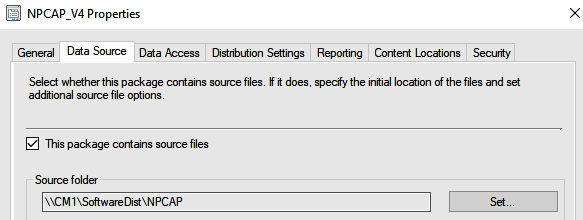
Figure 4.17 – The NPCAP data source in MECM
Next, we set what we want to run as the program, and as you can see in Figure 4.18, I have npcap-1.00-oem.exe with some parameters. The parameters we use are the following:
- /S – silent install and Npcap OEM only
- /loopback_support=no
- /winpcap_mode=yes
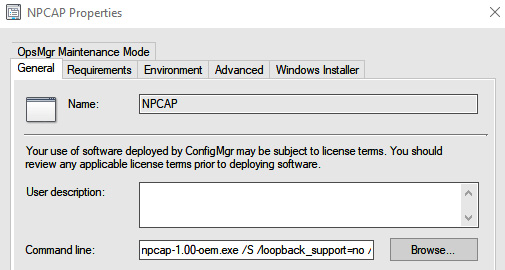
Figure 4.18 – The NPCAP command line in MECM
Rinse and repeat, create another package for the MDI sensor, and give it the source folder where Azure ATP sensor Setup.exe resides.
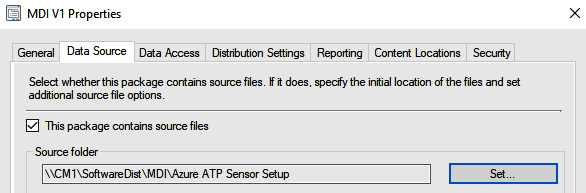
Figure 4.19 – The MDI data source in MECM
Here, we're using the exact same command line that we discussed earlier in the chapter, so revisit that if you need it.
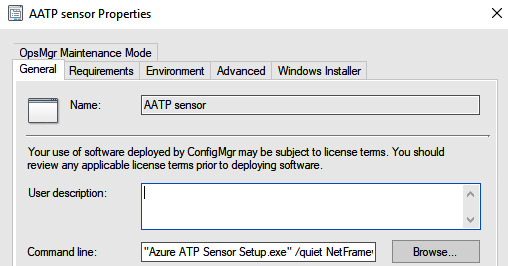
Figure 4.20 – The MDI command line in MECM
Lastly, we'll check the Run another program first box so that we can ensure it installs Npcap ahead of installing the MDI sensor. Of course, you don't have to do this and it's completely optional; however, this is a simple way to accomplish your goal. You may have machines in your environment where you need to uninstall WinPcap first as another prerequisite before doing this as well.
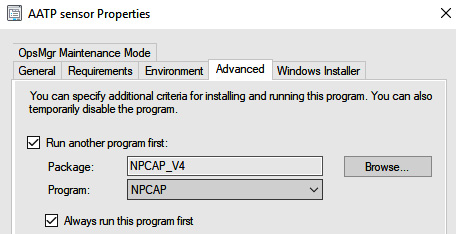
Figure 4.21 – The MDI child program (NPCAP)
We're done! Distribute your content and deploy the package. This is a super-straightforward approach to deploying MDI en masse; just leverage your maintenance windows to handle reboots for domain controllers needing .NET Framework 4.7.
Now that we have wrapped up some basic deployment methods, such as manual installations, silent manual installations, and MECM deployments, we can now move on to troubleshooting and some known issues.
A troubleshooting guide
First things first – I suggest you visit this documentation and read it; it's the currently known issues list for MDI: https://docs.microsoft.com/en-us/defender-for-identity/troubleshooting-known-issues.
Moving along, let's cover some of the known issues that are most common when troubleshooting MDI installations that I've come across. I'd have to ballpark the number of domain controllers I've onboarded to be over 5,000, so I think I've seen most of the wonky issues that will arise.
We'll start with the most common in a bullet-point list, with some information on each:
- The sensor failed to connect to service: If you see this when installing, check for the needed root certificates. This can be done by running the following Get-ChildItem cmdlets. It's likely one of them is missing, and if they are, the links to get them are in the URL provided previously for troubleshooting known issues:
# Certificate for all customers
Get-ChildItem -Path "Cert:LocalMachineRoot" | where { $_.Thumbprint -eq "D4DE20D05E66FC53FE1A50882C78DB2852CAE474"} | fl
# Certificate for commercial customers
Get-ChildItem -Path "Cert:LocalMachineRoot" | where { $_.Thumbprint -eq "df3c24f9bfd666761b268073fe06d1cc8d4f82a4"} | fl
# Certificate for US Government GCC High customers
Get-ChildItem -Path "Cert:LocalMachineRoot" | where { $_.Thumbprint -eq "a8985d3a65e5e5c4b2d7d66d40c6dd2fb19c5436"} | fl
- If you're using Network Interface Card (NIC) teaming on any network adapters, it's necessary to install the Npcap driver before installation. You'll see an error regarding that during installation as well.
- The GMSA password could not be retrieved: This will present itself in Microsoft.Tri.Sensor.Updater.log, and the entry will look like following the example shown next. With this error, you really need to ensure that you typed in the name of the account correctly and that you set the PrincipalsAllowedToRetrieveManagedPassword parameter of New-ADServiceAccount to the proper group (the local security group that you can create and to which you can add all built-in domain controller groups, even ones from domains with two-way trust) that contains the domain controllers. Another thing to check is whether you have Log on as a service configured in Group Policy, and if you do, you'll need to add this new gMSA account:
2020-02-17 14:02:19.6258 Warn GroupManagedServiceAccountImpersonationHelper GetGroupManagedServiceAccountAccessTokenAsync failed GMSA password could not be retrieved [errorCode=AccessDenied AccountName=account_name DomainDnsName=domain1.test.local]
Warn DirectoryServicesClient CreateLdapConnectionAsync failed to retrieve group managed service account password. [DomainControllerDnsName=DC1.CONTOSO.LOCAL Domain=contoso.local UserName=AATP_gMSA]
- Proxy: If you have a proxy in place, make sure you're running the installer with the proxy parameter. If the sensor can't communicate externally, it's going to fail.
If you put in the work ahead of time, you shouldn't run into a ton of issues while installing, and when you do, it's almost always one of the items shown previously. Get familiar with the logs, which you can find at the following URL. Get used to what entries are in each so that you know where to go if something goes wrong. Feel free to contact me on Twitter (@trk_rdy) too with any issues; I'll always try to answer when I'm free: https://docs.microsoft.com/en-us/defender-for-identity/troubleshooting-using-logs.
With that said, let's move on to the final part of this chapter – service status and verification!
Service status and verification
Alright, so we've made it to the final part of the chapter. I wish there was a lot more to talk about, but it's quite easy to verify whether the service is running; however, we'll cover them all. First off, we'll check the local services, via services.msc or however you like to launch it. Both the sensor and updater should be running. Of course, right after installation, they'll cycle a few times until they are settled on the credentials they can use, as well as some other self-checks. Once that settles, you'll see a steady Running state in the following portal:
Figure 4.22 – The MDI sensor services
We can check the senor in the portal as well; here, we see it Healthy and in a Running state. The health status is what you want to look at for any communication issues.
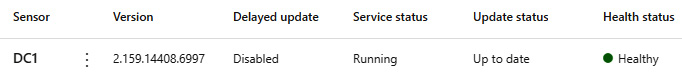
Figure 4.23 – The MDI sensor in the portal
Summary
Alright, so, MDI – what a cool product, and easy to install, right? We'll talk so much more about it in terms of how it works from a threat-hunting standpoint in Chapter 7, Microsoft Defender for Identity: Alerts and Incidents where we will discuss alerts, incidents, evidence, and timelines. We just had to get through the setup first to make sure that we set ourselves up for success. So, what did we learn in this chapter? Let's recap together:
- Understanding prerequisites: We talked about all the work we need to put in ahead of time to ensure that our deployments are successful and that our environment is in optimal shape.
- Deployment options: Here, we talked about the various ways to install, whether that was by manual GUI installation, silent installation, or even an MECM deployment option.
- Troubleshooting guide: In this section, we touched on the more common issues you'll run into and what we can do to address them. I also provided the known issues link for you to become familiar with as it updates.
- Service status and verification: Lastly, we talked about how we can ensure that our sensors are up and running, reporting in, and keeping us protected.
I look forward to talking more about these subjects in later chapters! Speaking of chapters, next up is Chapter 5, Understanding and Implementing Microsoft Defender for Cloud (Microsoft Defender for Cloud Standard Tier) in which you'll be learning about Defender for Cloud.
|
Protocol |
Transport |
Port |
From |
To |
|
Internet ports | ||||
|
Secure Socket Layer (SSL) (*.atp.azure.com) |
Transmission Control Protocol (TCP) |
443 |
MDI sensor |
MDI cloud service |
|
Internal ports | ||||
|
Domain Name System (DNS) |
TCP and User Datagram Protocol (UDP) |
53 |
MDI sensor |
DNS servers |
|
Netlogon (Server Message Block (SMB), Common Internet File System (CIFS), and Security Account Manager Remote Protocol (SAM-R)) |
TCP and UDP |
445 |
MDI sensor |
All devices on the network |
|
RADIUS |
UDP |
1813 |
RADIUS |
MDI sensor |
|
Local host ports* |
Required for the sensor update service | |||
|
SSL (local host) |
TCP |
444 |
Sensor service |
Sensor updater service |
|
Network Name Resolution (NNR) ports** | ||||
|
New Technology LAN Manager (NTLM) over Remote Procedure Call (RPC) |
TCP |
135 |
MDI |
All devices on the network |
|
NetBIOS |
UDP |
137 |
MDI |
All devices on the network |
|
Remote Desktop Protocol (RDP) |
TCP |
3389, only the first packet of Client hello |
MDI |
All devices on the network |