
Chapter 7: Microsoft Defender for Identity, What Happened, Alerts, and Incidents
Alright, folks, it's time. We're going deep, deep into Microsoft Defender for Identity (MDI). As I've stated before, MDI is one of or if not my favorite tool in the M365 security stack. It provides so much rich information on your Active Directory environment, including network traffic to and from domain controllers, security logs, sites and subnets, and entity information. All of that is taken in and used to identify indicators of attack. It can also create alerts if an actual attack is detected, as well as providing your Security Operations Center (SOC) with threat signals from the network for you to go and investigate. We won't touch on this much, but MDI also supports RADIUS logs for VPN services. Of course, by adding RADIUS logs to your MDI tenant, you get added user information that includes any VPN connection information for that user. Details such as IP address and location with origination – these types of things can help with deeper investigations.
Taking that into consideration, let's look at what we'll cover in this chapter. We're going to cover the following core topics:
- MDI concepts
- Understanding and investigating alerts
- Triaging and responding to alerts
I'm very excited to get into the thick of MDI, covering several key concepts, such as navigating the portal as it relates to MDI, different alert types and activities that are monitored, entity profiles, and Lateral Movement Paths (LMPs), and understanding fundamentally how MDI uses Network Name Resolution (NNR). From there on, we'll get into investigating alerts, drilling into the users or devices in question to learn about what might have happened. After that, we'll dive into triaging and responding to alerts, where we'll cover the recommendations M365 Defender presents as items to focus on and prioritize, or even what it has automated for you.
Technical requirements
As we move into the later chapters, the technical requirements will start to increase in difficulty for some, but stay with it, we're here to learn together! Let's outline this chapter's requirements with the following:
- Familiarity navigating Security.Microsoft.com
- Familiarity with the MITRE ATT&CK framework
- Basic understanding of lateral movement
- Fundamental understanding of Active Directory and authentication methods
MDI concepts
In the next few sections of this chapter, we're going to talk through a handful of core concepts of MDI, from navigating the portal to understanding some of the different monitored activities and how it uses NNR to learn more about entities.
Having these concepts down will give you the information to understand how MDI works and what it's looking for once installed in your environments. Let's keep it moving and start things off by navigating the portal.
Navigating the portal
First things first, let's head over to the Security.Microsoft.com portal. From the home page, we're going to scroll down to the bottom and on the lower left-hand side, we'll see Settings, as shown in Figure 7.1. Go ahead and click that:

Figure 7.1 – Security portal – Settings location
Important Note
There will be many things in this chapter that you might find confusing to find in your lab. This is because, at the time of writing this book, Microsoft is migrating MDI from the domain.atp.azure portal to the security.microsoft.com portal. The docs can sometimes refer to something in the older portal, where it's changed or enhanced in the new one.
We should now be at the Settings menu, as shown in Figure 7.2, for each segment within the M365 security stack, starting with Security center. Depending on what licensing you have, you may not see all the options; however, if you're running an E5 demo like me, you'll get the whole kit and caboodle:

Figure 7.2 – Settings menu in the security portal
If we think back to the old portal for a second, domain.atp.azure.com, the attack timeline was the landing page (see Figure 7.3), so you'd see any alerts right away and from there navigate into your settings. In the new portal, we get a single page to view all of our alerts and the settings are in a dedicated spot for all services:

Figure 7.3 – Legacy portal landing page
Getting back to the Settings menu, let's cover what we see in Figure 7.4 from top to bottom so we're comfortable finding what we need:

Figure 7.4 – MDI settings menu
First up, under General, we have Sensors (Figure 7.5). If we remember from the onboarding part of the book, back in Chapter 4, Implementing Microsoft Defender for Identity, we know this is where we'll see all the domain controllers or AD FS servers we onboarded. You'll get all the details of each server, including its name, type, sensor version, update status, service status, and health status. If there are any health issues with a particular server, select it, and the pop-out pane will show, as we see in Figure 7.6. We also have Global health issues in the upper right-hand corner of Figure 7.5, where we can view the alerts on one page for all sensors:

Figure 7.5 – Sensors page
Figure 7.6 shows the popout when you click on Global health issues; it shows all sensor issues in the tenant:
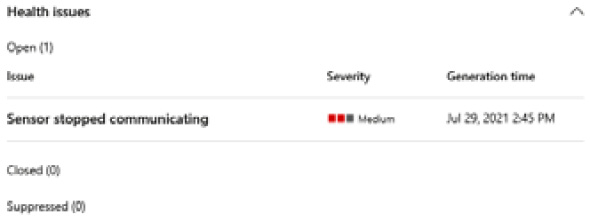
Figure 7.6 – Domain controller page
Moving on to the next settings page, we have Directory services accounts (Figure 7.7). This is where we will manage the service accounts used for our sensors to query to Active Directory. These are read-only accounts that you would have created just for this service to use. Depending on how many domains you have, you can add one set of credentials for each. If you have two-way trust between your domains, you can add one account. It's recommended to use a gMSA account for a few reasons: it's more secure and there's no password management – the Windows operating system manages the password for the account instead of the administrator. When adding a gMSA account, remember to check the Group managed service account box (see Figure 7.8). If you need help creating one, see this doc – https://docs.microsoft.com/en-us/windows-server/security/group-managed-service-accounts/getting-started-with-group-managed-service-accounts:

Figure 7.7 – Directory services accounts page
When adding a gMSA account, check the box, as you can see in Figure 7.7:

Figure 7.8 – Selected service account page
Integrating VPN accounting information from select VPN solutions is another setting that's available to configure. Here, you can pick up additional information from a user's profile page that will include additional information from their VPN connection, such as the originating location and IP address. This can, of course, be useful for investigations as it provides additional information on user activity as well as unusual VPN connections:
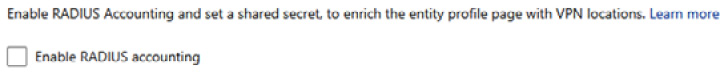
Figure 7.9 – VPN settings page – RADIUS account logs
Moving on, the next section within the MDI settings is Entity tags. Under that, the first setting is the sensitive accounts page. This is where you identify and tag high-value accounts in your environment, such as executives or other business decision-makers. Any entity, user, or machine that falls into the following groups will be added for you:
- Administrators
- Power Users
- Account Operators
- Server Operators
- Print Operators
- Backup Operators
- Replicators
- Network Configuration Operators
- Incoming Forest Trust Builders
- Domain Admins
- Domain Controllers
- Group Policy Creator Owners
- Read-only Domain Controllers
- Enterprise Read-only Domain Controllers
- Schema Admins
- Enterprise Admins
- Microsoft Exchange Servers
See Figure 7.10 for an example of the Users page of the sensitive accounts section. As you can see, the two administrator accounts in my lab were automatically added:

Figure 7.10 – Sensitive accounts page
Next, we have honeytoken accounts, which can be used as bait for threat actors. These accounts usually sit inactive but when used will throw specific alerts about honeytoken use. I went ahead and tagged one of the user accounts I don't use often as a honeytoken account as an example. See Figure 7.11:
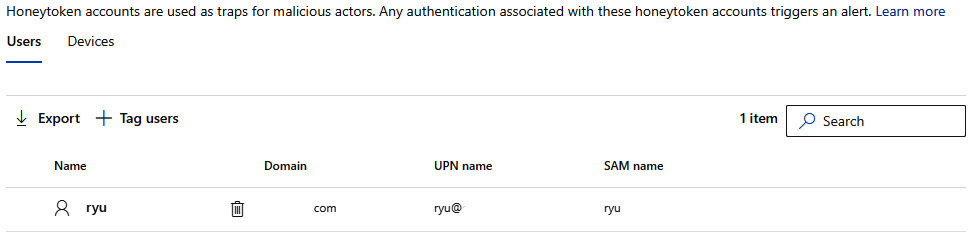
Figure 7.11 – Honeytoken accounts page
Next up after the Entity tags section is Excluded entities. Here, you can define global excludes, such as users, domains, devices, and IP addresses. This would be used for things such as security scanners that might use DNS for their use. This can help reduce some of the noise and alert fatigue for SOC analysts. Figure 7.12 shows an example of the exclusion page and the different fields laid out previously:
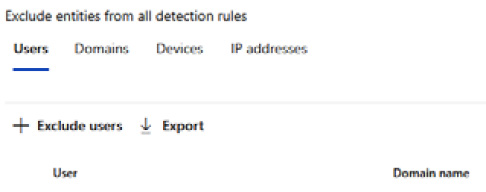
Figure 7.12 – Globally excluded entities page
Another aspect of exclusions is that you can add exclusions explicitly by detection rule. So, if you wanted to omit alerts for certain entities for something such as suspected NTLM authentication tampering or suspicious VPN connection, you could do so. See Figure 7.13 for a sample of a few detection rules:

Figure 7.13 – Excluded entities, exclusions by detection rule
The last section under the settings for MDI is Notifications, which should be pretty self-explanatory: you're setting the users or distribution groups for which you want to get alerts for health issues or alerts. There is a section called Syslog notifications that would be of use for some teams. Here, you can actually configure one of your sensors to send suspicious activity alerts related to security and health to a Syslog server. Figure 7.14 shows how easy that setup is:

Figure 7.14 – Syslog service configuration page
That's all for the settings aspect of MDI; we've covered all pages at a high level so that you're familiar with where to go as you start building this out. In terms of navigating the portal, beyond configuration settings, it's really just looking at alerts. We won't go deep into that quite yet as we'll cover it in more depth later in the chapter.
At a quick glance, you can either view all the alerts at once or filter specifically on Microsoft Defender for Identity for the service source, as shown in Figure 7.15:

Figure 7.15 – Alerts page, filtered to Microsoft Defender for Identity
Alrighty, that was a pivotal moment here as we started the journey into the goods of MDI. We've covered preparing for and deploying MDI and we've navigated the portal, covering the configuration settings there. Now it's time we talk about what MDI can do!
MDI alert categories and phases
MDI breaks down alerts into different categories, such as reconnaissance, compromised credentials, lateral movement, domain dominance, and exfiltration, that align with the typical phases seen in the Cyber Kill Chain framework. In this next section, we'll go into those phases and explain some of the activities MDI detects for it on the network, which will highlight the actors and machines associated with the alert being raised.
Reconnaissance
So, what is reconnaissance? Plainly put, it's the process of looking for and gathering information that will be useful for a potential attack. Most of the time, this is the longest phase as intelligent threat actors will take their time doing their due diligence finding out everything they can about networks, systems on the network, applications in the environment, as well as the users interacting with everything. The more time they spend, the more success they're likely to have. This phase can go far outside of just the network itself, including things such as social media, websites, blogs, or general search engine results.
Looking at what typically happens on entry for cyber-attacks, it's the low-hanging fruit that gets exploited. Low-privileged accounts are the starting point; from there, they move laterally until they reach something of value. This can be privileged accounts that have access to sensitive data, which could be an assortment of administrator accounts present on machines due to poor Active Directory habits.
One such method for finding low-hanging fruit during reconnaissance would be account enumeration, where they use tools that try to find valid usernames. One such tool is KrbGuess, which makes a Ticket-Granting Ticket (TGT) request to the Key Distribution Service (KDC) and then looks at the response it gets back. It looks for a response of Preauthentication required being returned instead of Security principal unknown. The former response means it matched a valid username. Figure 7.15 shows an example of what that might look like as an alert within MDI:
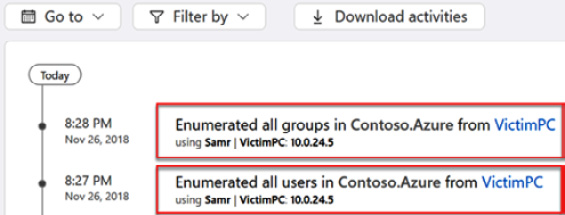
Figure 7.16 – Reconnaissance, account enumeration example
I would recommend you take this a step further and read the following documentation to learn about more attack types for MDI, how to understand them, remediation, and steps to prevent them.
The following link and list will help you learn about reconnaissance phase alerts, Microsoft Docs: https://docs.microsoft.com/en-us/defender-for-identity/reconnaissance-alerts.
- Account enumeration reconnaissance (external ID 2003)
- Active Directory attributes reconnaissance (LDAP) (external ID 2210)
- Network mapping reconnaissance (DNS) (external ID 2007)
- Security principal reconnaissance (LDAP) (external ID 2038)
- User and Group membership reconnaissance (SAMR) (external ID 2021)
- User and IP address reconnaissance (SMB) (external ID 2012)
Compromised credentials
When we talk about the compromised credentials phase and alerting, we're looking at things such as activity with honeytoken accounts, brute-force attacks, or detecting tooling known to aid in account compromise. The theme is you're looking for activity in accounts that is out of the ordinary or malicious. Let's cover the previous examples in a little more detail.
Honeytoken accounts, as we mentioned when covering the portal, are decoy accounts used to expose a threat actor. They're accounts created and tagged as honeytoken accounts, not used for anything other than alerting. They're generally given a name of interest to a threat actor to tempt them, which if taken will alert immediately and give them away.
Another alert type you'll see in the compromised credentials phase is an array of brute-force attack types, whether it's with Kerberos, NTLM, LDAP, or SMB. These are attacks where a threat actor tries authenticating with a long list of passwords against a few accounts or a few passwords against a long list of accounts. Eventually, they get a match and can then start logging in with that account and look to move laterally:

Figure 7.17 – Compromised credentials, Mimikatz, credential theft example
As recommended in the Reconnaissance section, you should read the documentation on this phase to learn about additional attack types that MDI alerts for in this phase.
The following link and list will help you learn about compromised credentials phase alerts, Microsoft Docs: https://docs.microsoft.com/en-us/defender-for-identity/compromised-credentials-alerts#suspected-wannacry-ransomware-attack-external-id-2035
- Honeytoken activity (external ID 2014)
- Suspected brute-force attack (Kerberos, NTLM) (external ID 2023)
- Suspected brute-force attack (LDAP) (external ID 2004)
- Suspected brute-force attack (SMB) (external ID 2033)
- Suspected Kerberos SPN exposure (external ID 2410)
- Suspected Netlogon privilege elevation attempt (CVE-2020-1472 exploitation) (external ID 2411)
- Suspected AS-REP roasting attack (external ID 2412)
- Suspected WannaCry ransomware attack (external ID 2035)
- Suspected use of Metasploit hacking framework (external ID 2034)
- Suspicious VPN connection (external ID 2025)
Lateral movement
Protecting against lateral movement goes beyond having complex passwords or password rotations, hardened machines, or securely stored data. Threat actors can still exploit instances where an account with sensitive privileges logs in to a device where the non-sensitive user that the device belongs to has local rights. They'll start with the low-hanging fruit, then move laterally, gaining credentials for the sensitive account.
There are several methods by which this can be accomplished. Using techniques such as pass the hash, overpass the hash, or pass the ticket, threat actors can use credentials to move around laterally in the environment until they get where they need to perform further initiatives, such as domain dominance, and eventually to exfiltration.
In Figure 7.18 and Figure 7.19, you'll see examples of MDI information when it discovers new activities on an account where an LMP has been discovered:

Figure 7.18 – Lateral movement, user profile lateral movement activity
Figure 7.19 shows the path of lateral movement from the user's page:

Figure 7.19 – Lateral movement, user profile LMP
Continuing the recommendations of additional documentation to read for more information on alert types for lateral movement, see the following:
Note
The following link and list will help you learn about lateral movement phase alerts – https://docs.microsoft.com/en-us/defender-for-identity/lateral-movement-alerts.
- Suspected exploitation attempt on Windows Print Spooler service (external ID 2415)
- Remote code execution over DNS (external ID 2036)
- Suspected identity theft (pass-the-hash) (external ID 2017)
- Suspected identity theft (pass-the-ticket) (external ID 2018)
- Suspected NTLM authentication tampering (external ID 2039)
- Suspected NTLM relay attack (Exchange account) (external ID 2037)
- Suspected overpass-the-hash attack (Kerberos) (external ID 2002)
- Suspected rogue Kerberos certificate usage (external ID 2047)
- Suspected SMB packet manipulation (CVE-2020-0796 exploitation) (external ID 2406)
- Suspicious network connection over Encrypting File System Remote Protocol (external ID 2416)
- Exchange Server Remote Code Execution (CVE-2021-26855) (external ID 2414)
Domain dominance
Domain dominance alerts are ones that generally start to elevate your heart rate if you're unfamiliar with them, especially when you start reading the MITRE ATT&CK technique links provided in the alert. If we're looking at the Cyber Kill Chain framework, this step represents the fact the threat actor has obtained a level of privilege that gives them access to your domain controllers. This level of access means they can do just about anything they want. This is the stage where highly sophisticated attackers will start planting backup persistence so that if their initial entry is found and terminated, they're still in business.
Some examples of these would be the dreaded golden ticket alert, a suspected skeleton key attack where encryption downgrades are offered, DCSync, or DCShadow attacks:

Figure 7.20 – Domain dominance, DCSync attack example
Let's move on to the last phase of alerts for MDI, exfiltration. At this stage, the attacker is on their last step: they've come in, snooped around, and gained a foothold. They then found what they were looking for and staged it to be uploaded out of the environment, in what we call exfiltration. This is typically the NTDS.dit file that resides on each domain controller, which stores all Active Directory information in it. We're talking all user accounts and their password hashes, the goodies! In this stage, the attacker will often compress and encrypt the files and send it out a Command and Control (C2) they have open. Depending on what you know about the timeline at this point, it may be difficult to understand exactly what has been exfiltrated; however, following the alerts should give you some direction for further analysis.
At this point, we've covered a lot: the portal itself and how to get some additional configurations in place. We talked about the different phases and alerts that MDI presents for you and now we'll dive into some of the more granular things, such as entity profiles, followed by the main functional component of MDI, NNR.
Entity profiles
When we talk about entities, or mention entity, we're referring to the array of users, devices, or computers and resources those users and devices can access, as well as the history of them as they move around.
Figure 7.21 provides an example of a user entity page. On this page, the left-hand pane provides some high-level Active Directory information, such as contact information, some information regarding exposure, such as first/last seen, on what devices and what logon types, and any groups they're a part of. What MDI does in the background is bring all this information together to build an activity timeline of up to 6 months of data of interesting events or alerts, which is presented on the right-hand side of the page:

Figure 7.21 – User entity page
To get to a page like you see in Figure 7.21, you can search for a particular entity, or you can click any entity hyperlink on the incidents or alert pages, as we see highlighted in red in Figure 7.22. See the following URL for updates as the transition to the new portal continues – https://docs.microsoft.com/en-us/defender-for-identity/entity-profiles:
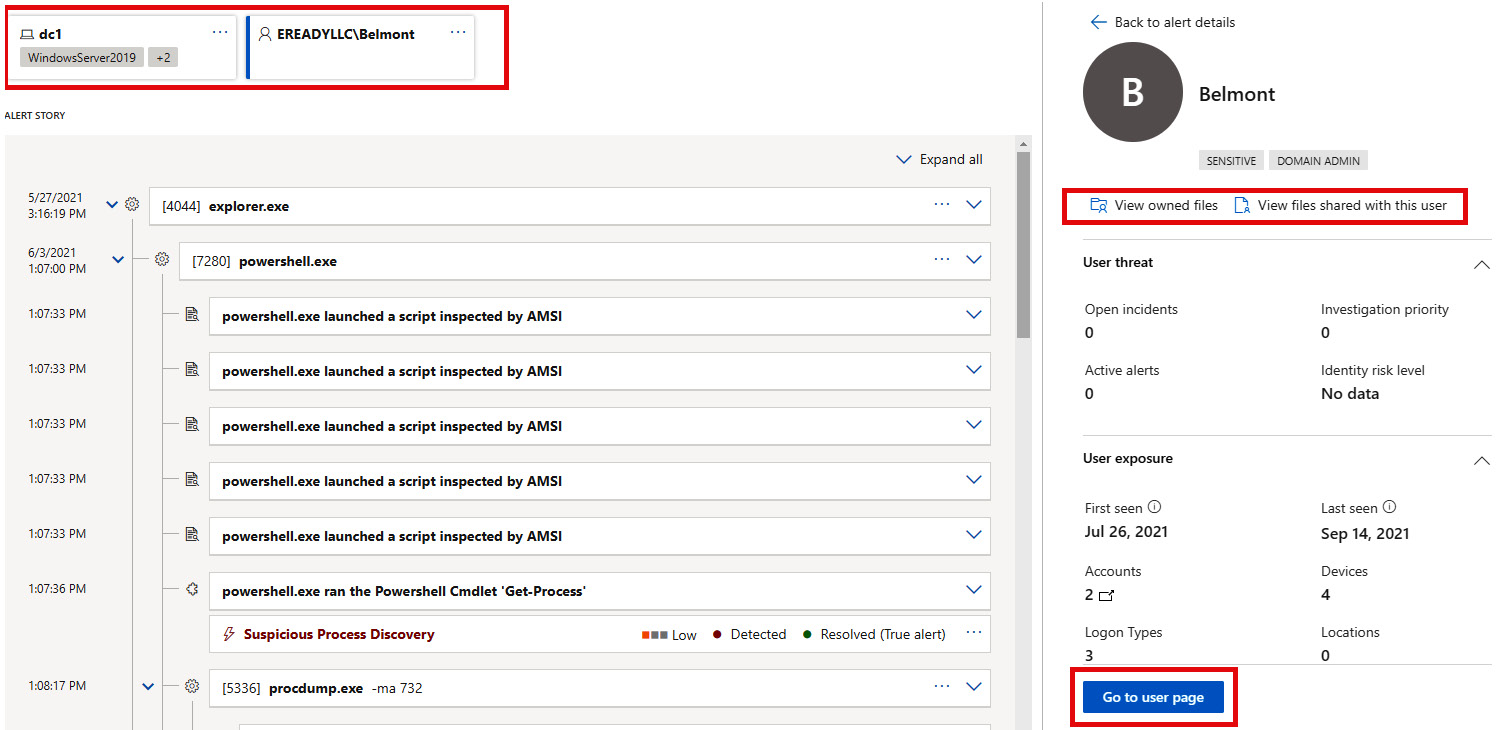
Figure 7.22 – Entities in alerts
Before we get into NNR, let's talk about some of the monitored activities.
Monitored activities
We won't cover all of them as there are a ton, but we'll cover what monitored activities are and some examples. See the following URL to get a complete list: https://docs.microsoft.com/en-us/defender-for-identity/monitored-activities.
First, let's break these down into the following categories:
- User account Active Directory attribute changes
- Active Directory security principal operations
- Domain controller-based user operations
- Login operations
- Machine account activities
As you can imagine, with each of these comes very specific changes that are typically, in some way, associated with malicious behavior. Watching for changes in these areas on your domain controllers helps add activities and events to alerts.
Network name resolution
Moving into the last section of core concepts, we are going to cover something called NNR. This component is what aids MDI in capturing activities based on network traffic as well as Windows events and Event Tracing for Windows (ETW). Since these things generally contain IP data, using NNR, Defender for Identity will correlate the activities in the raw data with the computers involved. It's able to get these computer names by using NNR to resolve the IP addresses inside the data captured.
There are three primary methods and one secondary method NNR uses to do this. The primary methods are as follows:
- NTLM over RPC (TCP port 135)
- NetBIOS (UDP port 137)
- RDP (TCP port 3389) – only the first packet of client hello
The secondary method is it queries the DNS server using reverse DNS lookup of the IP address (UDP port 53).
See Table 7.1 for the prerequisites:
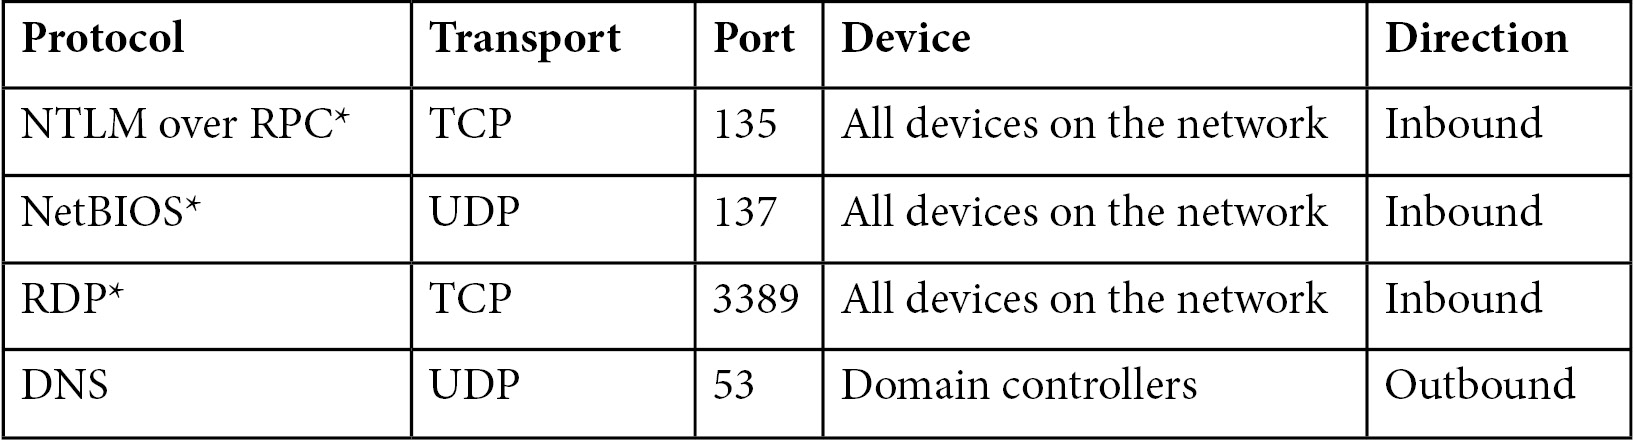
Table 7.1 – NNR table – protocols and port information
If you are working in a hardened environment where some, or all, of the primary methods are blocked, reverse DNS lookups of the IP address are performed, but it's recommended that at least one primary is used.
The MDI sensor will throw an alert if it detects that the resolution status has a low success rate due to too many methods and nothing working properly. See Figure 7.23 for an example:

Figure 7.23 – Low success rate MDI sensor error
The process of correlating IP addresses and computer objects goes like this: MDI will analyze the network traffic to determine machine names. From there, the sensor checks Active Directory, comparing what TCP fingerprints it has, to see whether it correlates to an object with the same name. This process helps find machines that are registered to Active Directory as well as ones that are not, providing more accurate information in alerts and investigations. This information is crucial for threats such as the following:
- Suspected identity theft (pass the ticket)
- Suspected DCSync attack (replication of directory services)
- Network mapping reconnaissance (DNS)
Some final configuration recommendations, which can be found at https://docs.microsoft.com/en-us/defender-for-identity/nnr-policy#configuration-recommendations, are listed as follows:
- NTLM over RPC:
- Check that TCP port 135 is open for inbound communication from MDI sensors on all computers in the environment.
- Check all network configurations (firewalls), as this can prevent communication to the relevant ports.
- NetBIOS:
- Check that UDP port 137 is open for inbound communication from MDI sensors on all computers in the environment.
- Check all network configuration (firewalls), as this can prevent communication to the relevant ports.
- RDP:
- Check that TCP port 3389 is open for inbound communication from MDI sensors on all computers in the environment.
- Check all network configurations (firewalls), as this can prevent communication to the relevant ports.
- Reverse DNS:
- Check that the sensor can reach the DNS server and that reverse lookup zones are enabled.
Alright, now that we have covered most of the core concepts, let's switch over to understanding more about alerts so you can make sense of what's in them. Next up is understanding and investigating alerts.
Understanding and investigating alerts
I feel like we're at the cusp of what we've all been waiting for, and that's digging into alerts to see what's going on and what we can do about it. But before we do that, there's one last thing I want to cover and that's ensuring we know all aspects of the alert itself.
When it comes to the structure of the alert, we're presented with What happened on the left-hand side of the page, and it reads sort of like a timeline. On the right-hand side of the page, we get more of the details, such as detection source, activity timestamps, description, and entity types involved. You'll often see a link to a docs page that tells you more about that alert type.
Another thing you'll notice is if the alert is a part of an incident, there are mentions of the entities involved. See Figure 7.24 as an example:

Figure 7.24 – Alert structure example
Starting with a breakdown of the right-hand side, you'll see at the top that it's not classified. This is because you'll set that after your initial investigation. Figure 7.25 shows an example of the alert state and default state of the alert:

Figure 7.25 – Managing an alert
The following figure is what you're presented with when you set it as a true alert, with a list of options for determination:
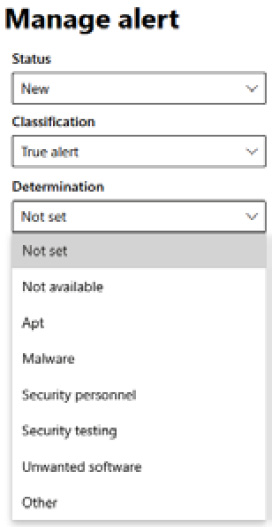
Figure 7.26 – Managing an alert
The next section on the right pane is Alert details. This gives us information such as the category of the alert, what MITRE ATT&CK technique it aligns with, along with a link that takes you to the MITRE ATT&CK framework page to learn more. Here is where we'll see what detected the alert: MDI, MDE, Defender Antivirus, and so on. See Figure 7.27 for an example:
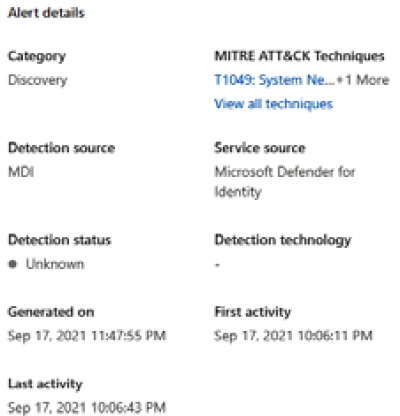
Figure 7.27 – Alert details
Moving on to the next segment on the right, we have some more alert information, such as a link to the docs page that gives you more information about the alert and some suggestions as well as remediations to help give you direction. See Figure 7.28 for an example:

Figure 7.28 – Alert information
After the alert information, we'll see more information about the incident it's a part of as well as its severity. You'll also get a link to that incident so you can quickly see the larger picture. Below that information is a breakdown of the entities included in the incident, as well as how those items may be linked. See Figure 7.29 for an example:

Figure 7.29 – Incident details
Wrapping up the right-hand alert pane, we have information about the automated investigation, such as status, when it started, and when it ended. Below that, you get another look at the assets impacted in the investigation and its current risk score. Lastly, you get a comment section, where you can add notes from things you've looked at or something you want other analysts to read. Let's also not forget any enrichment data from Defender for Endpoint should you have that integration enabled:

Figure 7.30 – Investigation information and assets involved
Moving into the last section of the chapter, let's update and talk about what we just learned. We talked about several of the key concepts of MDI and we covered what an MDI alert looks like, including a breakdown of the alert itself, what information is presented, and how to deal with it. Now we'll take all of that and start looking at sample alerts and how we might respond to them. Let's go!
Triaging and responding to alerts
Triaging and responding to alerts is one of if not the most important part of this whole process. No matter how many security products you have, no matter how well you have them configured, threat actors will always find a way if they have to. This is why responding to and accurately assessing alerts is crucial. Being able to contain a breach quickly and confidently can make or break a company. In this section of the chapter, we'll cover some alerts around the reconnaissance phase. From there, we'll piece together what's happening and how we can respond.
Let's start with some alerts we might see as an attack ensues, and what they might mean. In Figure 7.30, we see the beginning of some reconnaissance. Network mapping reconnaissance, for example, is a method to map out the environment and build out a knowledge base for later use. In the following example, we see srv2012r2 appears to be requesting some suspicious DNS queries from DC1:

Figure 7.31 – MDI alert, network mapping
Take a look at the evidence at the bottom of the alert in Figure 7.31 for more details. We get details about the entities involved and what stood out:

Figure 7.32 – MDI alert, network mapping
Now, if we remember from the previous section, we know that we should see some information in the alert details that tells us more about the detection, such as the service source (MDI). Right below that, we see Alert information and a link that says Learn more about this alert type. If we click that link, we'll be taken to a docs page that gives us a description and information from the MITRE framework on the tactic and technique it relates to. See Figure 7.33 for an example:
Important Note
Alert doc – https://docs.microsoft.com/en-us/defender-for-identity/reconnaissance-alerts#network-mapping-reconnaissance-dns-external-id-2007:

Figure 7.33 – Alert details
There are a few things these articles help with, such as helping you decide whether it's a legitimate alert or not. So, in this instance, the first step would be to decide whether the source machine in the alert is a domain controller or not. If it is, we can mark this as a false alert as would be expected. It's worth considering the learning period for this alert, which is provided in the docs, to help you decide as well. Anything within that learning period can lead to false alerts as the sensor is still defining what normal behavior in the environment is.
After deciding that, next we see we should be checking for any security scanners or applications that would be generating DNS queries. If that's the case, you can mark it as a true alert but benign. Beyond that, we get some recommendations for remediation and prevention; see Figure 7.33 for an example:

Figure 7.34 – Example remediation and prevention
Let's look quickly at how we could help mitigate this reconnaissance attempt with a zone transfer restriction. If you head over to the domain controller in our lab and open DNS manager, you'll be able to see the Zone Transfer tab in the properties on either your forward lookup zones or reverse lookup zones. You'll have the following options, as shown in Figure 7.35:
- To disable zone transfers, clear the Allow zone transfers checkbox and then click OK.
- To allow zone transfers, select the Allow zone transfers checkbox, and then do one of the following:
- To allow zone transfers to any server, select To any server and then click OK.
- To allow zone transfers only to the DNS servers that are listed on the Name Servers tab, select Only to servers listed on the Name Servers tab and then click OK.
- To allow zone transfers only to specific DNS servers, select Only to the following servers, add the IP address of one or more DNS servers, and then click OK.
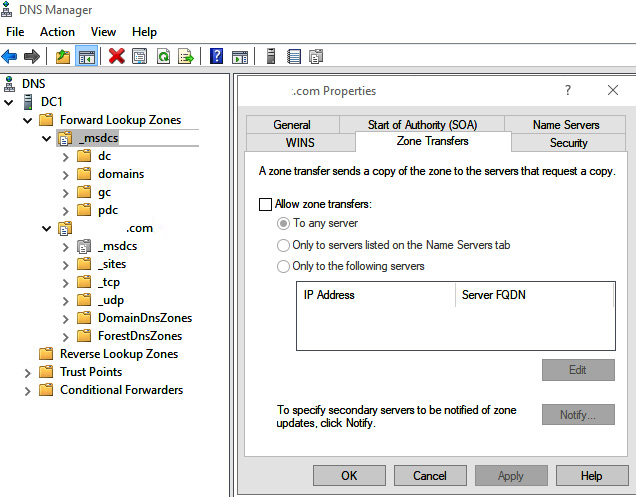
Figure 7.35 – Securing zone transfers
As a test, I tried to transfer the zone to another test box, and I got the following error in Figure 7.36 showing that's not allowed:

Figure 7.36 – Securing zone transfers
This is just one example of triaging alerts and evaluating remediations based on the alert type. There are three really good alert labs that you can go through just like this one, as we followed the reconnaissance workflow automation in this example. See the following docs page to get your lab configured with the accounts and tools so that you can follow along and start learning: Alert lab workflow automation – https://docs.microsoft.com/en-us/defender-for-identity/playbook-lab-overview.
Summary
Looking back on this chapter, we learned a ton! We covered everything from how to navigate the portal regarding MDI, what all the different settings mean, and why we'd configure them. We talked about a bunch of the core concepts surrounding MDI, the types of activities it tracks, and how the sensor itself looks at that traffic. Then, we dove into what an alert is, the breakdown of it, and everything included in it. After that, we started triaging actual alerts and looking into what they mean and how we can respond to them, from a remediation and prevention standpoint.
Take some time before moving into the next chapter to go through some of the workflow automations that Microsoft provides, so that you can start creating alerts on your own to see how that looks from an offensive and defensive perspective. Learn how those attacks work and what you can do to prevent them or at least make it difficult. You'll learn a ton about your own environment and its posture when you go through these, learning where your gaps in coverage are.
I hope you enjoyed this chapter as much as I did. We could have gone into so much more and deeper into what we did cover, but we must move forward. I'm looking forward to sharing more on Defender for Office in Chapter 8, Microsoft Defender for Office: Threats to Productivity. See you there!