
3
Data Preparation with Tableau Prep Builder
Tableau Prep Builder is Tableau’s product for preparing data and creating simple to complicated data models. Tableau Prep Builder extracts data via data connectors and allows the user to transform the data through several different functions and load the data on Tableau Server, Tableau Online, and other destinations. Tableau Prep Builder, first released in 2018, is different than Tableau Desktop in that it is solely focused on preparing data for analysis.
Tableau Prep Builder can be used via a downloadable software client that you install on your local computer. It is available for both Windows and Mac. Tableau Prep Builder is also available as a web client on Tableau Server and Tableau Cloud for individuals with a Creator license. Tableau Prep Builder will create an object called a flow. The term flow is used because it describes how data flows from originating data sources through a data transformation process, ending with the transformed data being stored via an output step.
This chapter is focused on the Tableau Prep Builder user interface, the process of connecting to data, and the first step in any data preparation process – the clean step. The chapter will also focus on row-level calculations, including optimizing string fields. The functions in this chapter are the most foundational data preparation functions to master. With the foundation you build in this chapter, you will be able to create your first data models in Tableau Prep Builder and gain the knowledge required to master the more complex modeling functions that we explore in Chapter 4 and Chapter 5.
In this chapter, we’re going to cover the following main topics:
- Using Tableau Prep Builder to connect to data
- Profiling, cleaning, and grouping data
- Row-level calculations and hiding and removing fields
- Recommendations and changes
To view the software requirements for this chapter, please see the Technical requirements section in Chapter 1.
All the exercises and images in this chapter will be described using the Tableau Prep Builder client software, except where noted. You can also recreate all the exercises in this chapter using the Tableau Prep Builder web client, which has a near-identical experience to the installed client. There are also very minor differences in the look and feel of the user interface between macOS and Microsoft Windows. The images in this and future chapters that come from the client software are created on macOS. The images from the web client are generated from Chrome on macOS.
Using Tableau Prep Builder to connect to data
To run the exercises in this chapter, we will need the following downloaded files:
- Bad Measures.xlsx
- Mobile Phone Plans.xlsx
- Product Database.xlsx
- Sales Argentina.csv
- Sales Chile.csv
- Sales Colombia.csv
- Sales Targets.xlsx
- Superstore Sales Orders - Canada.xlsx
- Superstore Sales Orders - US.xlsx
We are using these files as they give us a good representation of the types of data cleaning that we typically run into in our daily jobs and they align well with Tableau Prep Builder features. When possible, they also include data related to Tableau’s sample data, Superstore.
Let’s open Tableau Prep Builder and explore the user interface. If you are using the installed client, please open the program. If you are using the web client, you can launch it by creating a new flow. You can create a new flow from the home page on Tableau Server or Tableau Cloud, as shown in Figure 3.1:
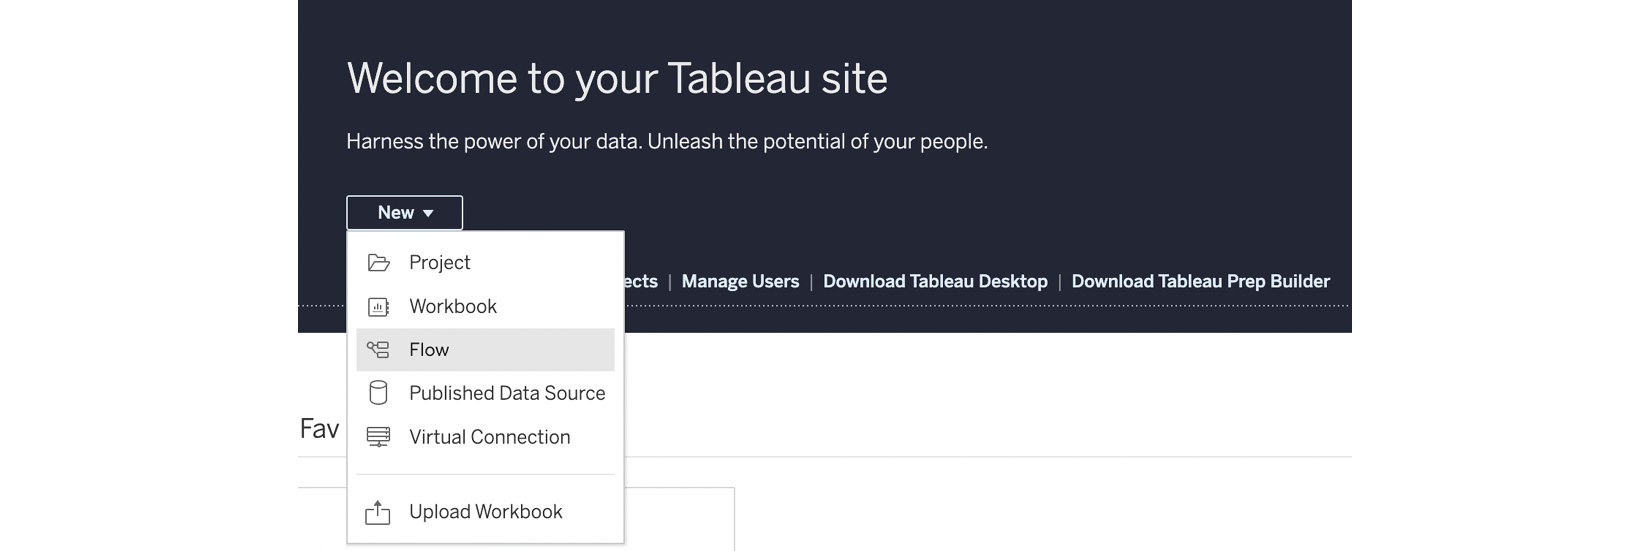
Figure 3.1 – Create a new flow
We will now start the process of creating our first Tableau flow:
- Open the Tableau Prep Builder client or begin a new flow from your browser, as shown in Figure 3.1. You will be presented with the screen shown in Figure 3.2 from the client, or Figure 3.3 if you’re using your browser:
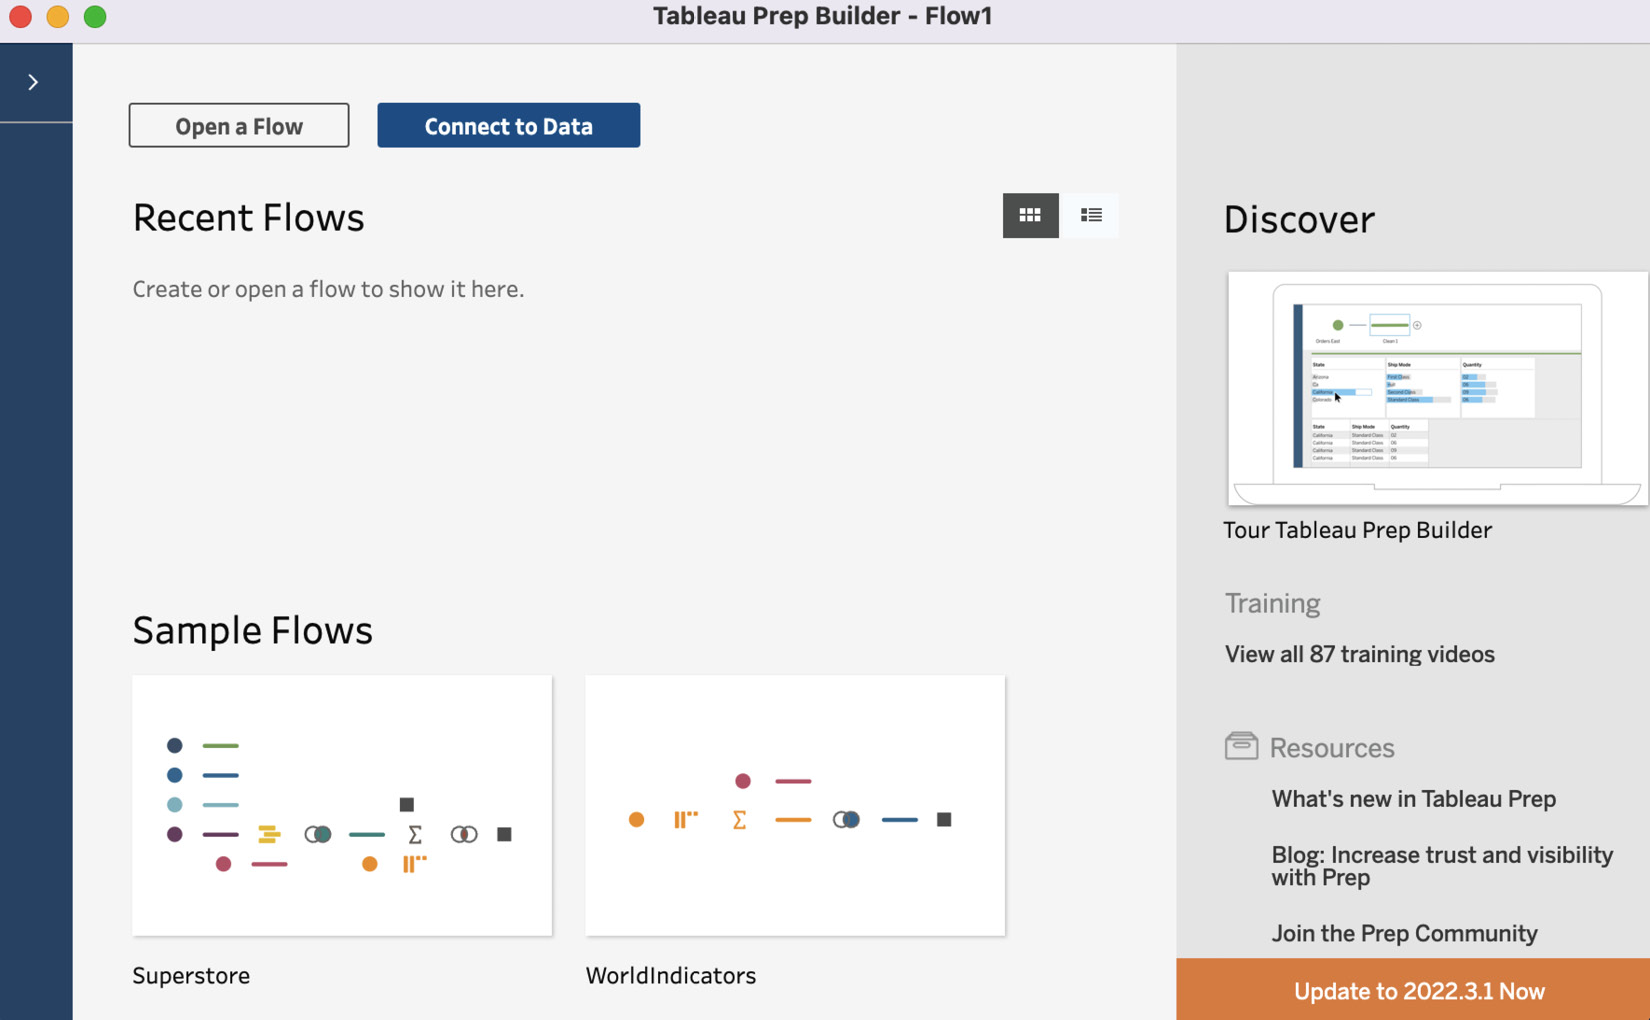
Figure 3.2 – Initial screen in Prep Builder client
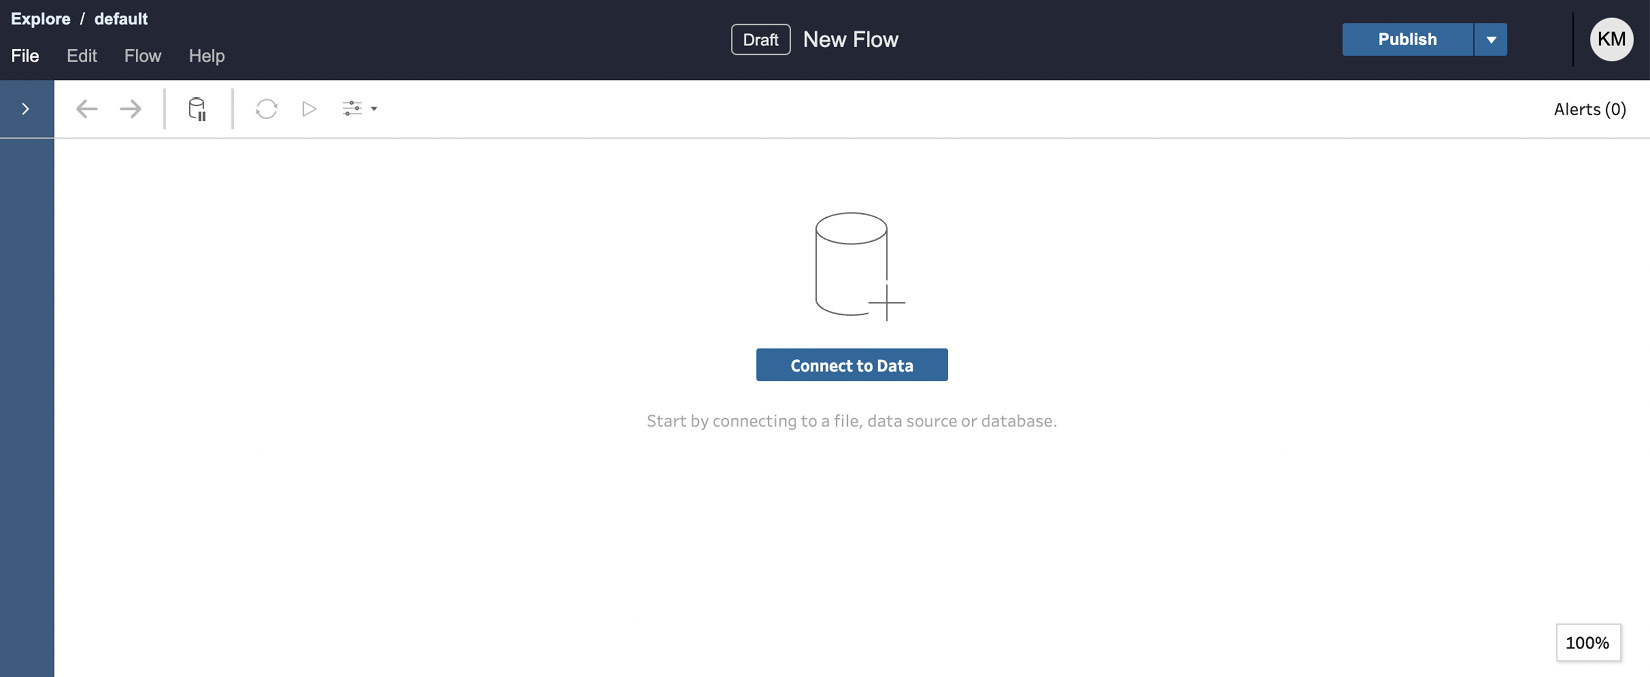
Figure 3.3 – Initial screen from web client
- The first step in any Tableau Prep Builder flow is connecting to data. Press the Connect to Data button to get started.
- Select Microsoft Excel, locate the Superstore Sales Orders - US.xlsx file where you copied it from the GitHub repository to your local computer, and click Open. Tableau will now open the file and create the first step in a flow, as shown in Figure 3.4:
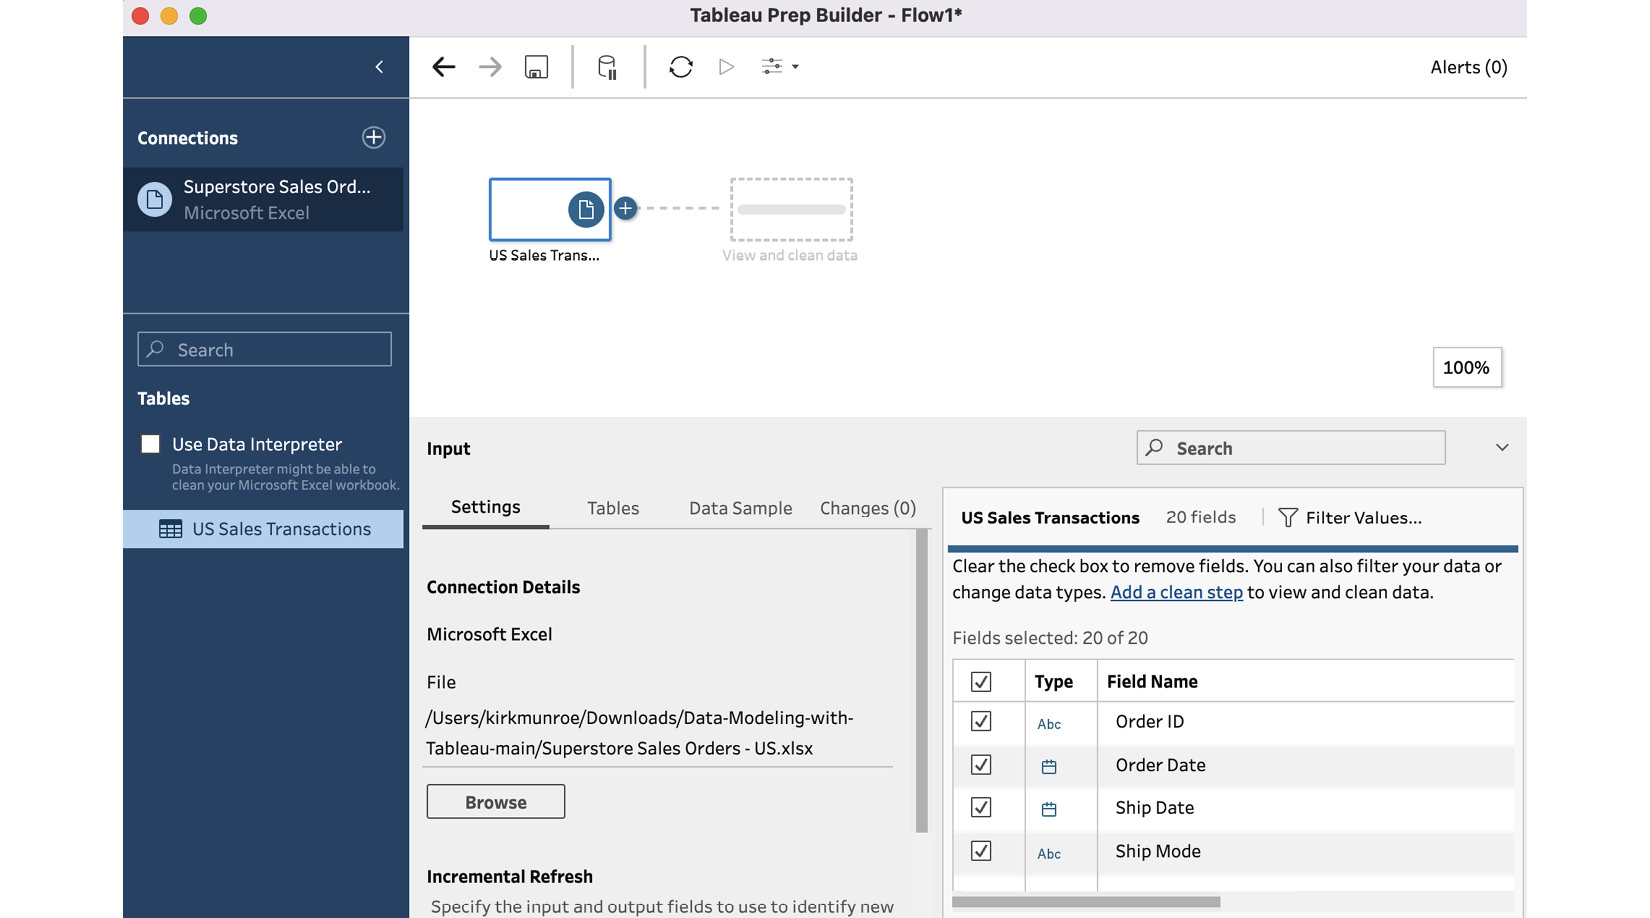
Figure 3.4 – Tableau Prep Builder UI after connecting to data
- In the left-hand pane (shaded in blue), Tableau presents all the data connections in the flow first. This area is called the Connections pane. At this point, we have the single data source that we just connected to. We will connect to additional data sources as we continue through this and the next few chapters. Below the connections, Tableau lists all the tables in the selected connections. In this case, our Excel workbook contains a single sheet, so we only see a single table, US Sales Transactions. If we had multiple sheets in our Excel workbook, each sheet would show up as an individual table. We can also see the Use Data Interpreter option. This option is designed to clean up formatting in Excel and text files. Our Excel file is already well formatted, so we don’t need this option. If our file had additional formatting, such as information above the rows containing file headers, we could select the data interpreter and Tableau would clean up the file for us when it could interpret it correctly.
- The pane on the top of the screen is the flow pane. This is where we will visually build out our data preparation flow.
- Most of the screen is taken up with the input pane. On the Settings tab, we can see the details of our connection. Since we used Excel, our connection is to a file. If we had connected to a database, the connection information would be shown here. This is where we also have the option to set the data source to Enable incremental refresh. Incremental refreshes allow us to add to our output without needing to reload historical data each time. We will discuss this option in more detail in Chapter 6 when we explore the output action.
- The input pane is also where we can filter our data. Filtering data is key for data storage and performance and is often overlooked when building data models. We do not want to load data that will never be used for analysis. This clutters the user experience for analysts and consumers, leads to slower loading times, and can take a lot of unnecessary space on disk.
- Thinking back to our exploration of the way Tableau likes data in Chapter 1, there are two methods for filtering down our data. The first is to filter the width of the data model. The width is determined by the number of columns in the data model. The quickest way to eliminate columns from our data source is to deselect them from the Settings tab in the Input step of the flow creation. A way of filtering out the Segment and Ship Mode columns is shown in Figure 3.5. The Tableau Prep Builder user interface makes it clear that 18 of the 20 fields will be brought into the data model.
Note
We will be using all 20 fields in the rest of this exercise, so please make sure all 20 fields are checked. We will eliminate fields from our model later in this chapter.
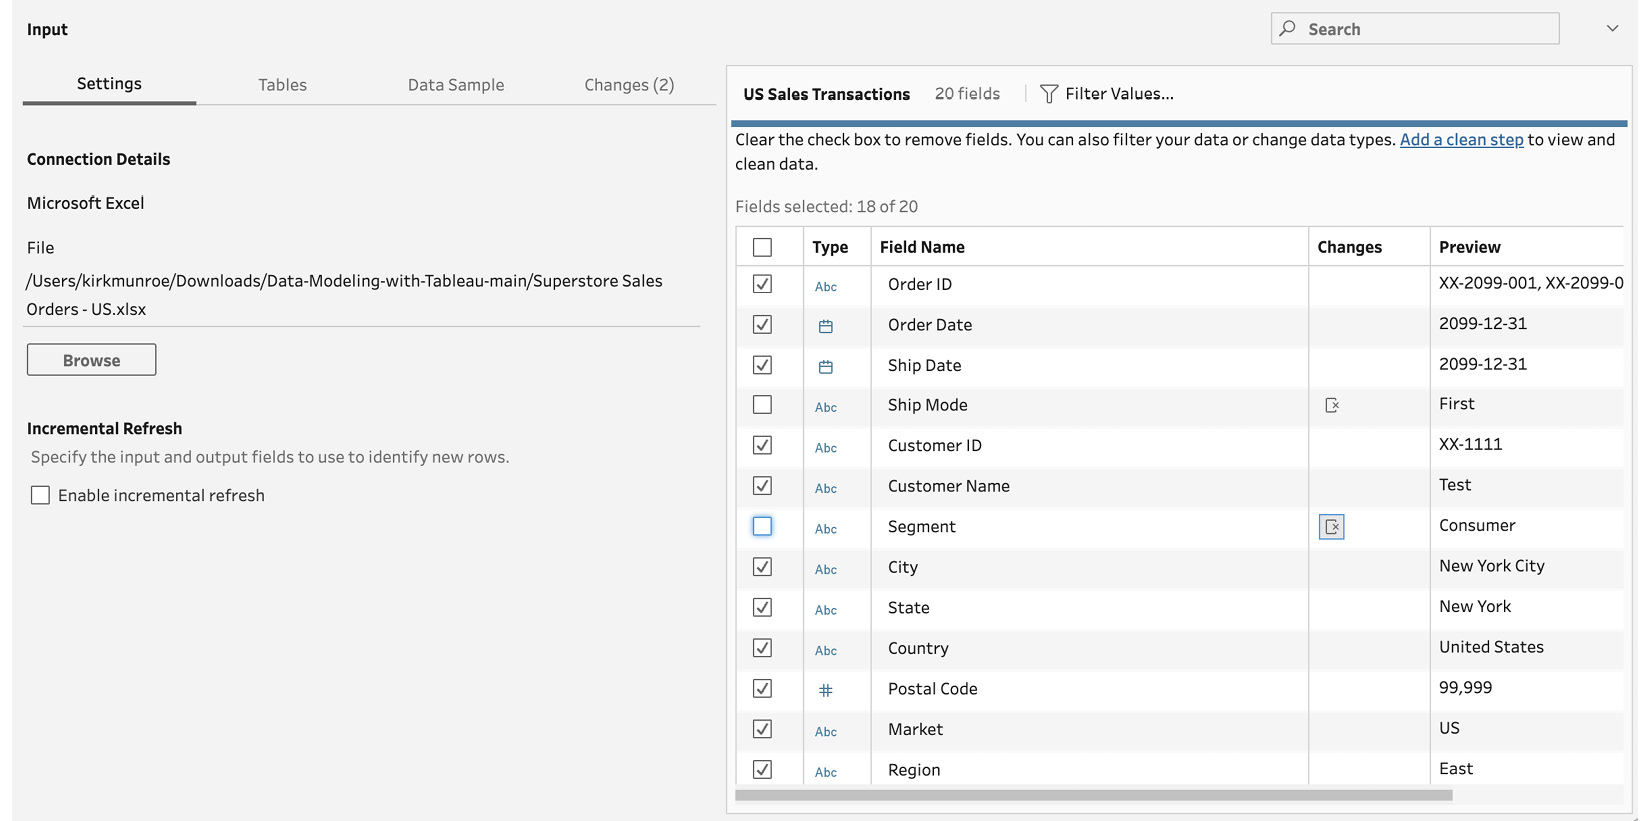
Figure 3.5 – Filtering columns
- The other way we can filter the amount of data in our model is by filtering values. This will constrain the length of the data. Filtering values decreases the number of rows in the model. Filtering out data the analysts don’t need can significantly increase query performance. To filter rows, click on the Filter Values button. A dialog box will appear, letting you input a Boolean calculation, that is, a value that returns either true or false. As an example, if we were creating a data model for a team that was only looking at data for the state of New York, we could enter the calculation shown in Figure 3.6. This is telling Tableau to filter data to the condition where the State field only contains the value New York. In other words, this is instructing Tableau to eliminate all rows that contain all other US states. As in the previous step, we do not want to apply this filter right now. Please click on the x in the top right-hand corner of the dialog box to dismiss our changes:
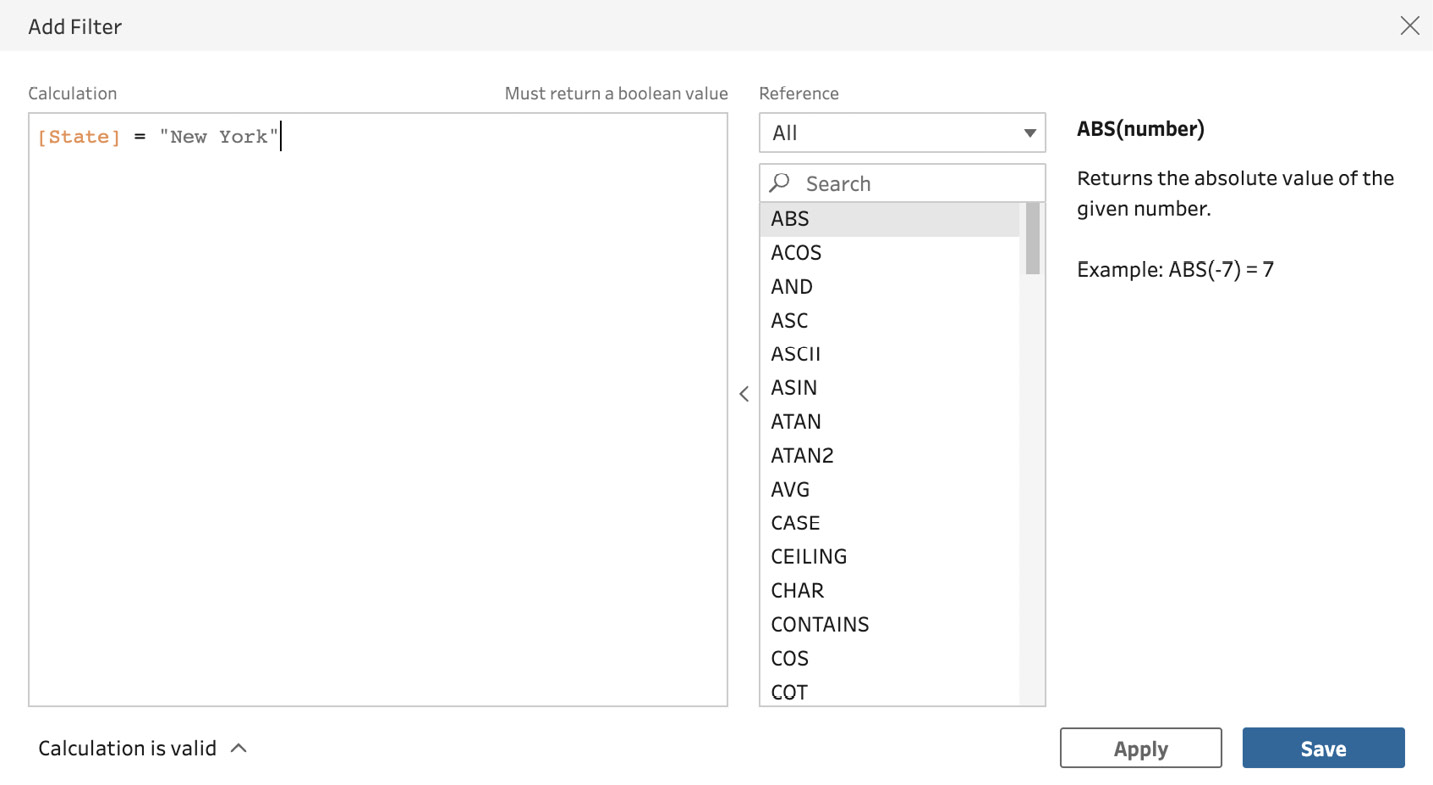
Figure 3.6 – Creation of a Boolean calculation to filter rows
- The next tab in the input pane is the Tables tab. This is where we can tell Tableau Prep Builder to automatically add data from other files and tables through a union. We will be looking at unions in Chapter 4. For this exercise, leave the default option of Single table, as shown in Figure 3.7:
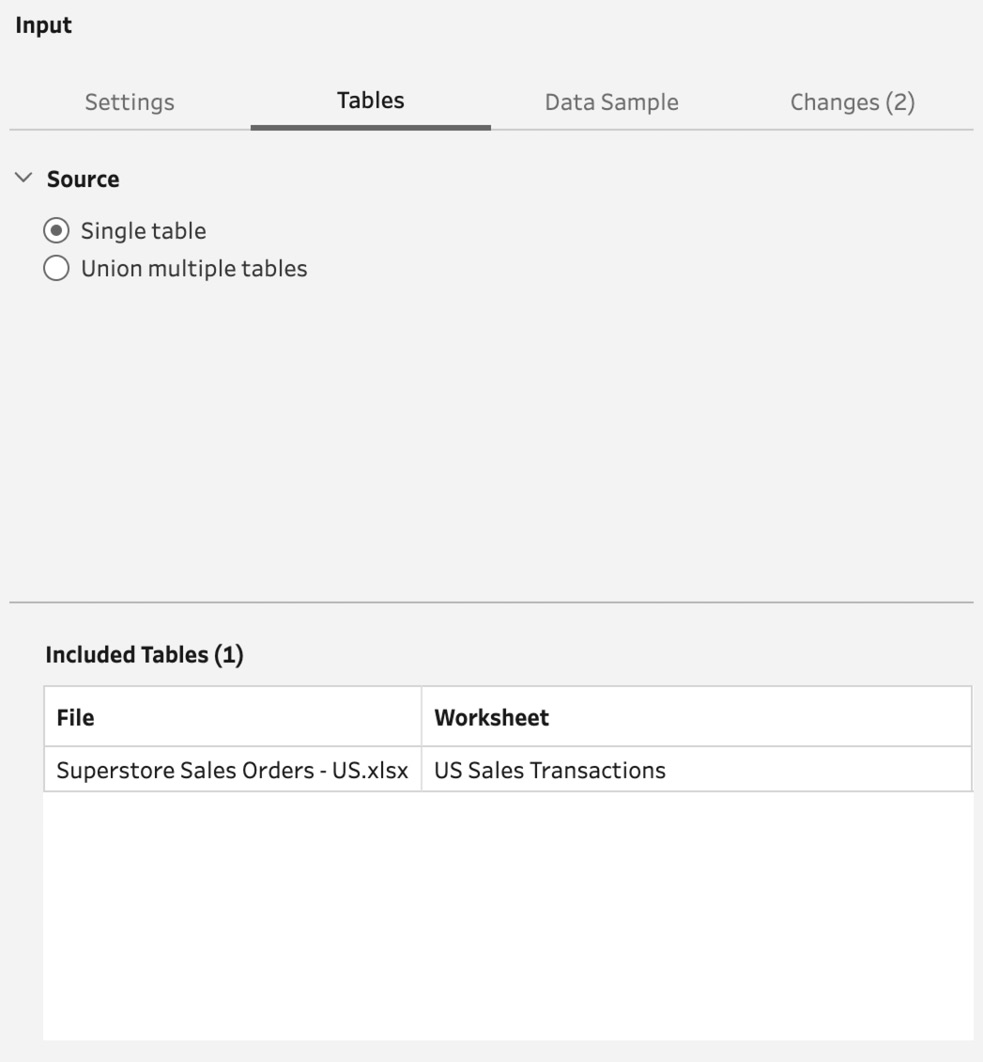
Figure 3.7 – The Tables tab of the input pane
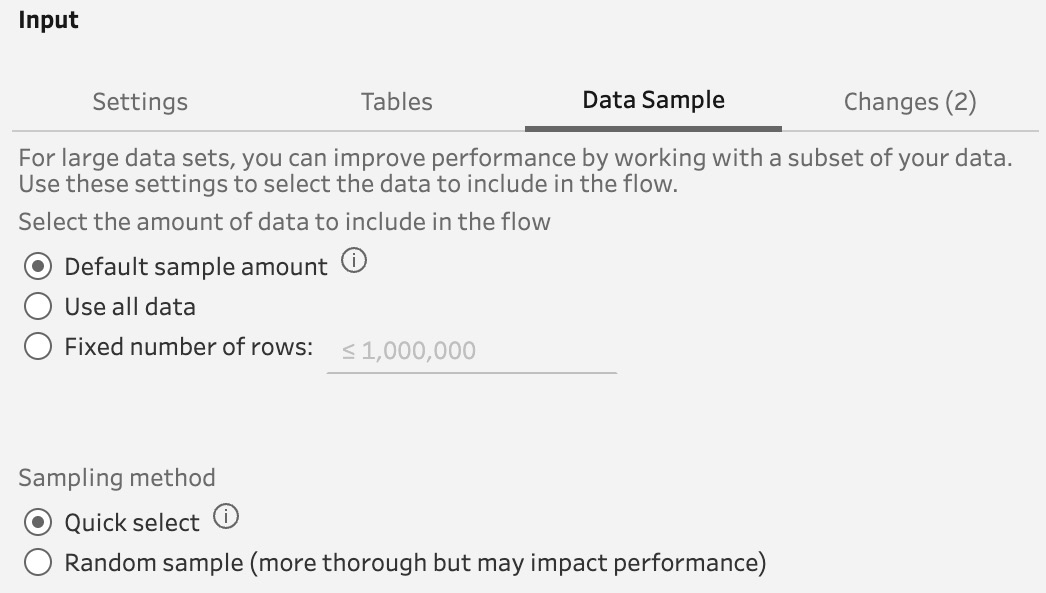
Figure 3.8 – Data Sample tab of the input pane
When we have very large datasets, we might want or need to set up data sampling. If the memory on our computer is less than that which would hold the entire dataset, Tableau Prep Builder will run very slowly as it will have to swap data from memory to disk. This can render the data modeling experience very slow and difficult, or even impossible. The amount of data you should sample varies depending on the speed and memory of your computer and the structure of the data you are bringing in.
In large datasets, it can be a bit of a trial and error to get the sample size correct. Using the defaults of Default sample amount and Quick select sampling methods is usually the best choice. The challenge of sampling data is that the sample data might not be representative of all the data that you work to clean in your flow. We will look at some examples when we look at grouping data later in this chapter.
For this reason, Tableau Prep Builder allows you to control how sampling works through the Fixed number of rows and Random sample (more thorough but may impact performance) options. If you know that your data is well represented in, say, the first 2 million rows, you can select that option. If your data is very heterogeneous, you can select the random sample option.
As shown in the user interface, this option will be slower to retrieve data than just fetching rows via the Quick select method. For our exercise, you can leave the default checks or select Use all data as our dataset is very small and this sample will be equal to using all data.
The last tab in the input pane is Changes. As we build out our flows, Tableau keeps track of all changes we make. This is a great feature as it allows us to change or delete previous steps in our flow. If you think about the Windows clipboard features of undo and redo or the back and forward buttons in Tableau Desktop, the changes feature of Tableau Prep Builder is even more powerful. It allows you to go back and undo changes you made in the past without having to undo all the changes you made after it, provided the changes after the one you are deleting aren’t impacted by that change. At this point, we have not made any changes, which is why there is a 0 in parentheses after Changes in the user interface. We will look at how changes work later in the chapter.
In the next section, we are going to be looking at the most important and most common step in a Tableau Prep Builder flow, the clean step. Please leave Tableau Prep Builder open as it is right now. We will be picking up from this point.
Profiling, cleaning, and grouping data
In this section, we are going to begin the process of profiling, cleaning, and grouping data in Tableau Prep Builder. Of all the functions in Prep Builder, the clean step is the one we will use most often. In fact, it is recommended to add a clean step after any other type of step to see if the previous step transformed the data in the manner we were expecting.
Let’s pick up where we left off in the previous section:
- The top right-hand section of the Tableau Prep Builder user interface is the flow pane. It gets this name because it is the area where we get a graphical representation of how our data flows through the preparation process. Continuing from the previous section, your flow pane should look like Figure 3.9:
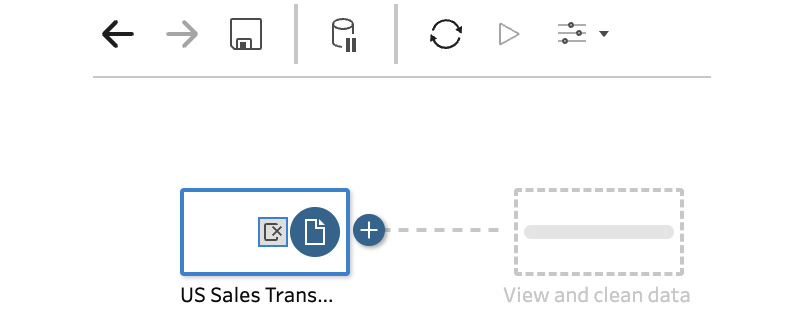
Figure 3.9 – The flow pane
- To create a clean step, click on the + symbol to the right of the box. When the drop-down menu appears, select Clean Step, as shown in Figure 3.10:
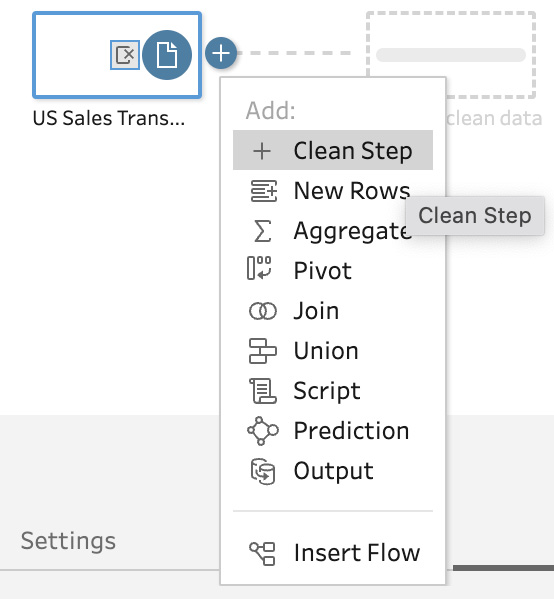
Figure 3.10 – Starting a clean step
- Once Clean Step is selected, the user interface changes into four distinct sections:
- To the left, stretching down the entire user interface, we see the Connections pane that we explored in the previous section.
- On the top right, we have the flow pane that we discussed in the first step of this exercise.
- On the middle right, we have the profile pane. This is where we get a profile of our data before and after any changes we make.
- On the bottom right, we have data details. This is a sample of the rows of data that will change as we make changes in the profile pane.
- To see how we use the profile pane to clean and transform our data, find the Order Date field, which is the second field from the left, right after Order ID. The card for the Order Date field, shown in Figure 3.11, immediately profiles a lot of information about this field in our dataset:
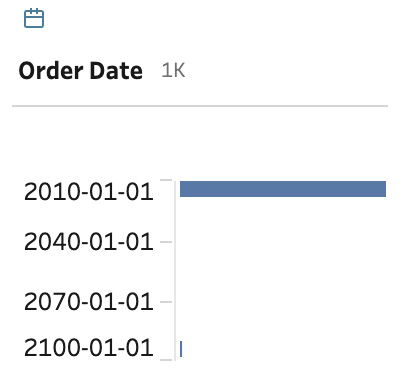
Figure 3.11 – The Order Date card
First, above the field name, there is a little calendar icon that tells us that Tableau is treating this as a date field. Click on the calendar icon to see the other field type options, as shown in Figure 3.12. Selecting the proper field type is important as it tells Tableau how to treat the data when creating a visualization in Tableau Desktop. In this case, Tableau correctly interpreted the field to be a date field so we will not change anything:
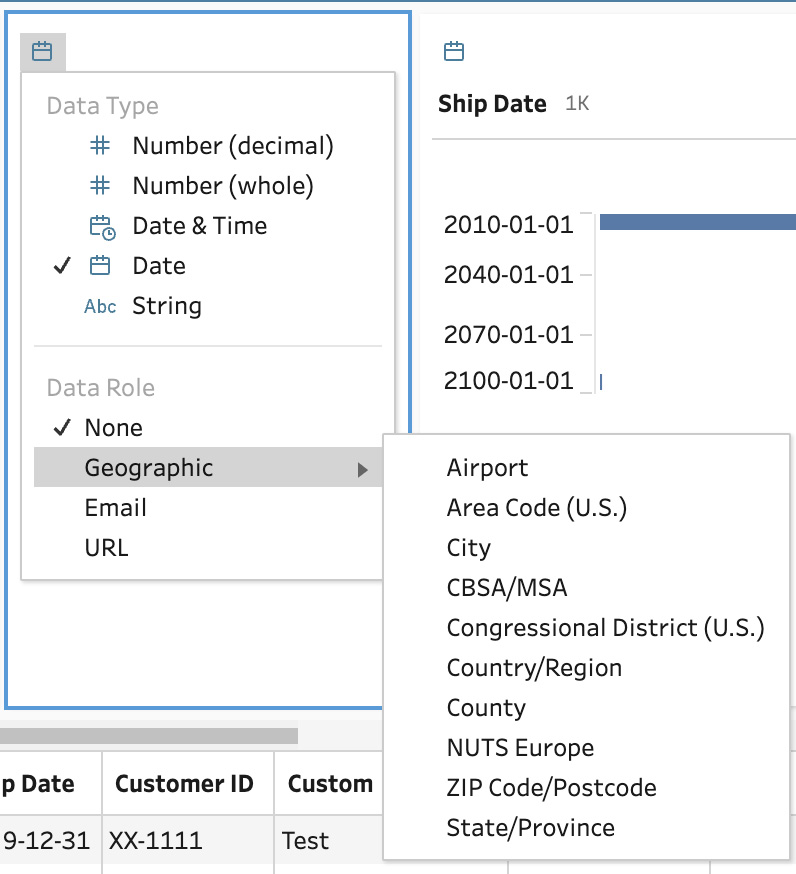
Figure 3.12 – Data types
The next two things you will notice are the 1K to the right of Ship Date and the distribution of values shown in a histogram below the line under the field name. The 1K, representing approximately one thousand values, is helpful for understanding our data. For instance, if we find the Order ID field, we will see 5K representing the number of records in the data. This means that there were approximately 5 order IDs generated per day. (Remember this is only sample data; it’s not representative of a successful business!)
- Looking at the histogram of date distributions, we can see there is clearly something not right with our data. It looks like most of our data is in the decade 2010-2020, but we have some data in the decade 2090-2100. This is clearly not possible as those dates haven’t happened yet. To address this, let’s click on the small bar that shows to the right of 2100-01-01, as shown in Figure 3.13, and then watch what happens in data details, as shown in Figure 3.14:
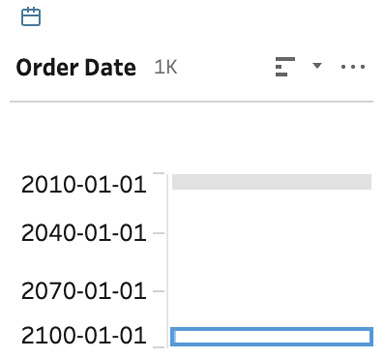
Figure 3.13 – Select the bottom bar in the histogram
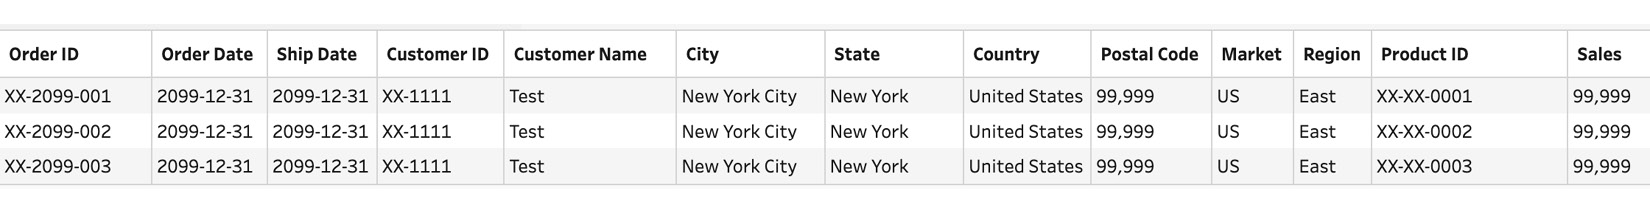
Figure 3.14 – Data details for Order Date selection
- Looking at this data, we can see that test data was mixed in with our production data and should not be there. We don’t want this data in our data model or it could cause confusion for analysts. Tableau Prep Builder makes it easy to filter this data out of our model. Going back to the histogram bar from the previous step, right-click and choose Exclude , as shown in Figure 3.15:
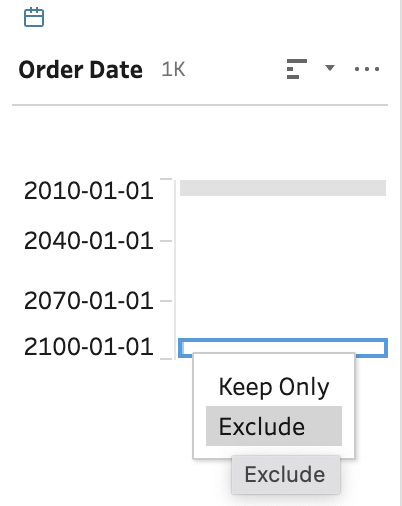
Figure 3.15 – Excluding test data
- Once we exclude the data, the Order Date card has a distribution that shows data across four years, as shown in Figure 3.16. It is important to note that Tableau does not write back to your database. As we create our flow, we are giving Tableau instructions on what data to bring into our data model and how to transform that data. In this case, it means that the three records we just excluded are not deleted from the database (in this case, our database is Excel). It is important to remember that nothing we do in Tableau Prep Builder or Tableau Desktop can change the underlying data source.
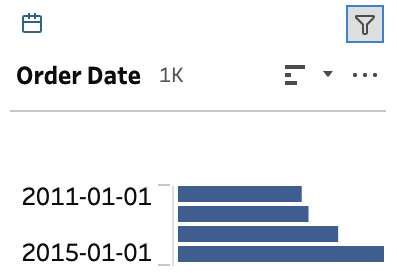
Figure 3.16 – Date distribution after excluding 2099
- Moving along the fields in our model, we can see that things also don’t look right in the Ship Mode field. In this field, we can see that First and First Class, Second and Second Class, and Standard and Standard Class are probably meant to represent the same ship mode. This can be seen in Figure 3.17:
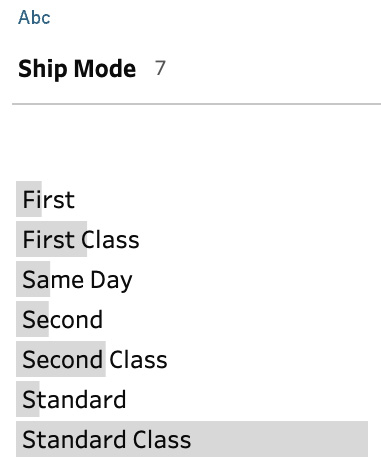
Figure 3.17 – Ship Mode distribution
- One of the most important and common functions of Tableau Prep Builder is to group values in fields exactly like this one. To begin cleaning this field, we will look at the manual method. Click on First in the Ship Mode card, right-click, and choose Edit Value. This is shown in Figure 3.18:
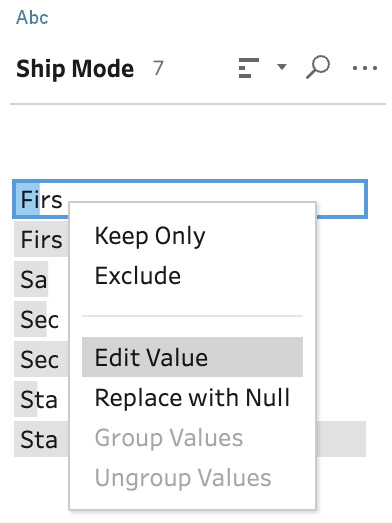
Figure 3.18 – Manually editing a value
- Type First Class over the First value and press Enter/Return. You will see that Tableau groups all the values that were previously First into First Class, as shown in Figure 3.19. This will make our analysis in Tableau Desktop much easier. The other two things to notice are the value after Ship Mode is now 6 (it was 7 before), and there is a little paper clip icon in the top right-hand corner of the card letting us know that values are grouped:
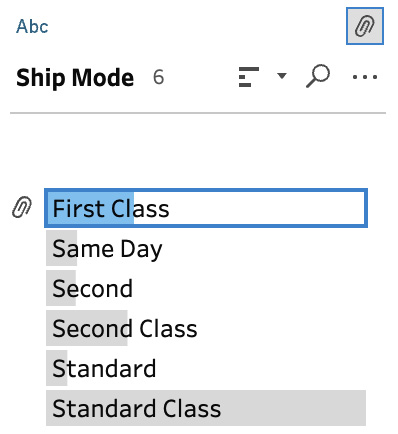
Figure 3.19 – Ship Mode after manual grouping
- The manual method of editing and grouping values is very direct and powerful but not always practical. In this case, we only have 7 values, which we want to put in 4 groups. If we had hundreds or thousands of values, this method would not be practical and would often be error prone. To help solve this issue, Tableau Prep Builder has machine learning algorithms embedded to make this task run automatically. Going back to the Ship Mode card, hover your mouse just below the paper clip icon until the more options dialog appears. Click on More options | Group Values and let’s look at our options for grouping. The result of these steps can be seen in Figure 3.20:
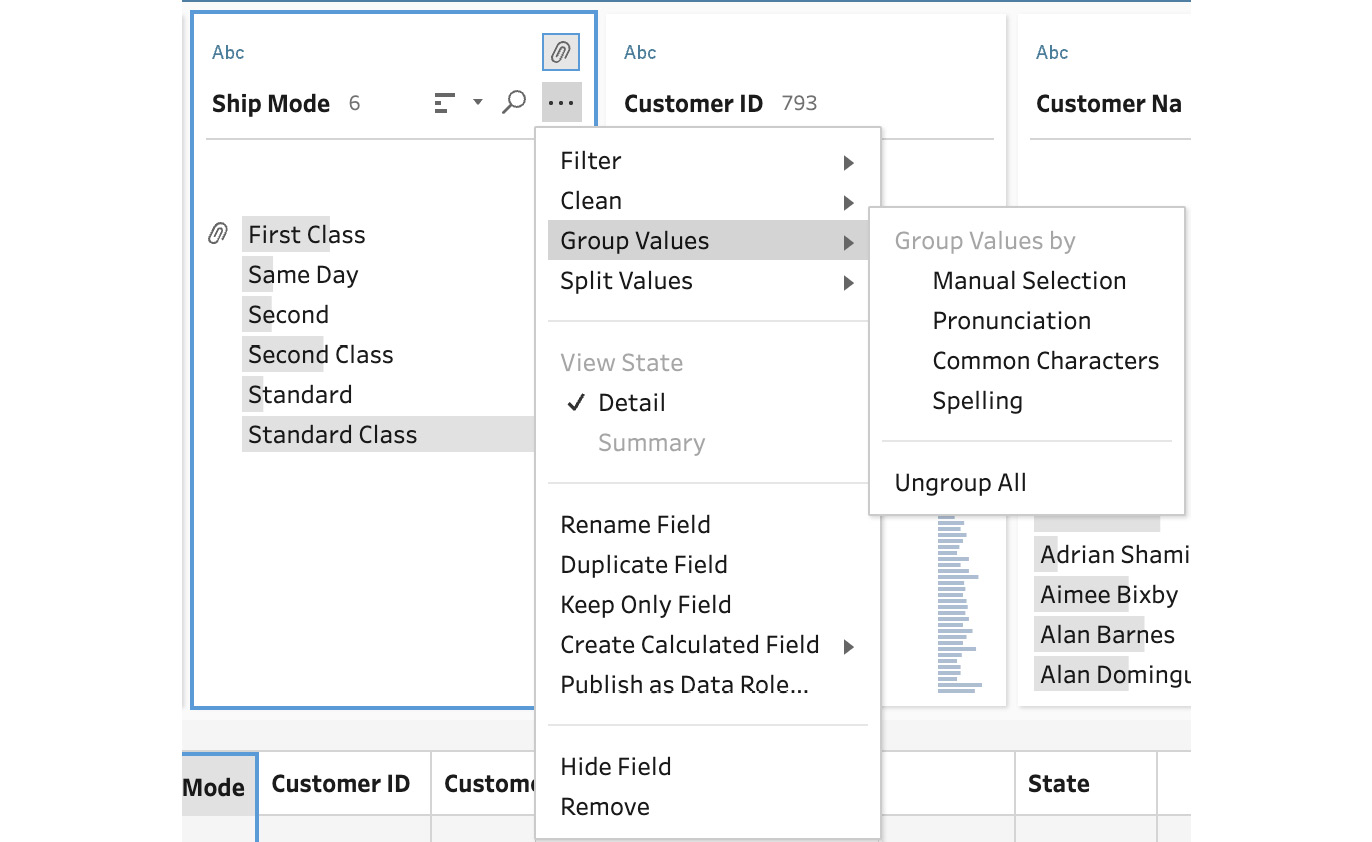
Figure 3.20 – Grouping options
We looked at the manual selection in step 12 of this process. The three machine learning options are as follows:
- Pronunciation – useful for fixing data errors where words sound similar. The dataset we are providing is a good example.
- Common Characters – useful for fixing capitalization or formatting issues. An example would be a field where the data input was done by different people who weren’t consistent with capitalizing proper nouns or leaving spaces between words.
- Spelling – useful for values that are entered manually as spelling mistakes inevitably happen, or when people are using American and UK English, for example, favour and favor.
- To see this in action, click on Pronunciation and watch the remaining fields group automatically. The result can be seen in Figure 3.21:
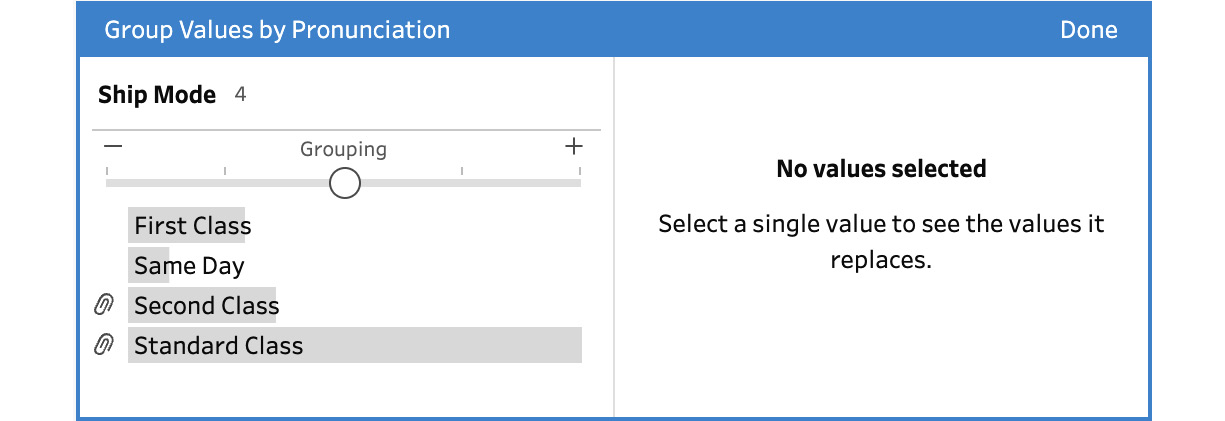
Figure 3.21 – Resulting grouping after the Pronunciation method
- After running the grouping function, Tableau allows you to tweak the specificity of the machine learning results when Tableau doesn’t do a perfect job. If we click on Second Class, we see how Tableau came up with the grouping as seen in Figure 3.22. In our example, Tableau did the job perfectly. If it hadn’t, you could slide the circle on the bar below Grouping in this card to refine the results. Since Tableau got it right in our case, click on Done in the top right-hand corner to dismiss the grouping card:
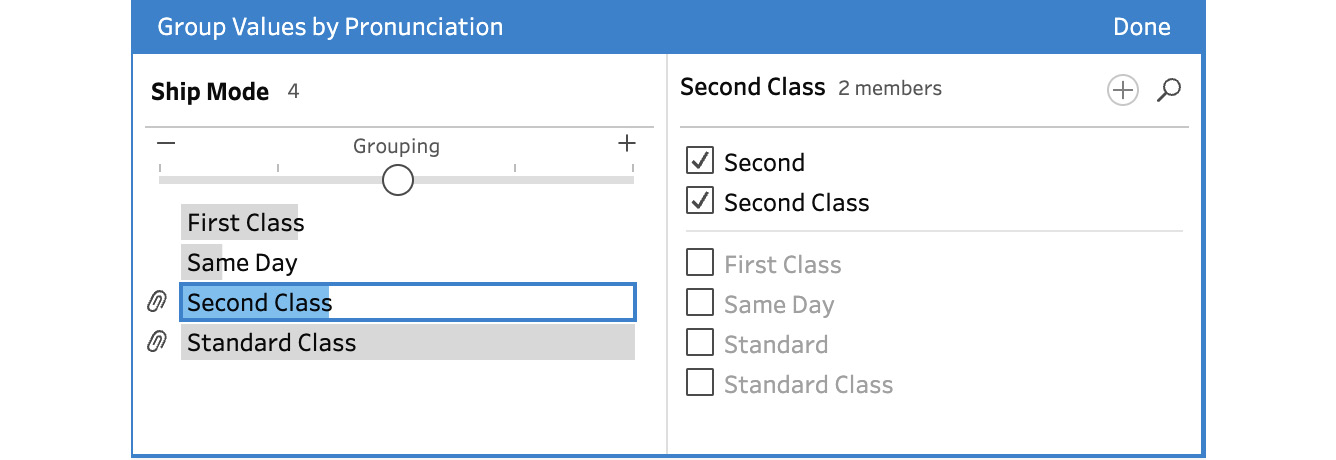
Figure 3.22 – Refining the Grouping algorithm
- Before moving on from grouping, let’s look at the Clean function of Tableau Prep Builder by again clicking on more options on the Ship Mode card. As you can see in Figure 3.23, Tableau gives you a number of options to clean your data:
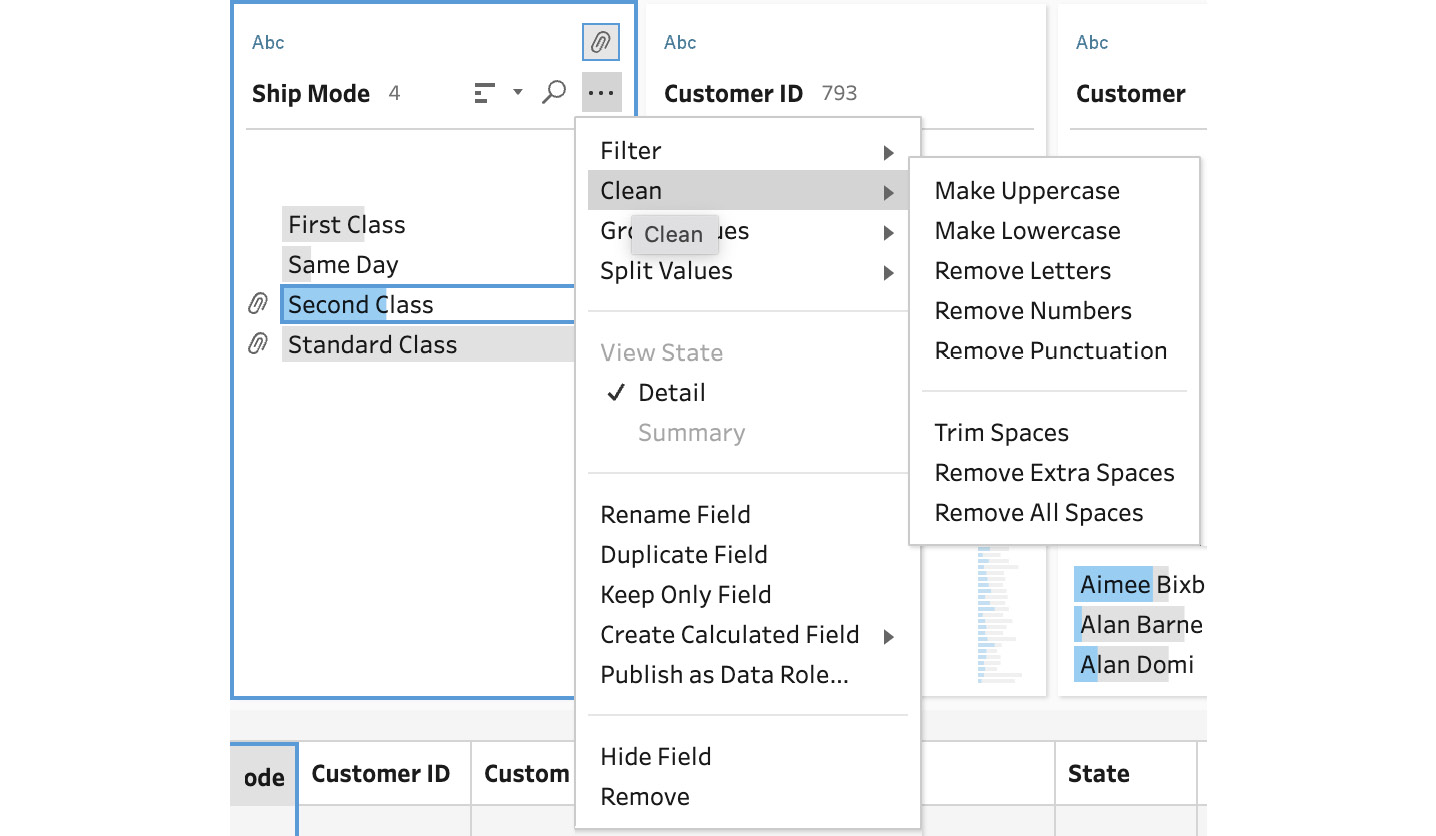
Figure 3.23 – Clean options
Let’s see one of these options in action by clicking on Make Uppercase. The result is shown in Figure 3.24. The options to Remove Extra Spaces (that is, spaces between words) and Trim Spaces (that is, spaces before and after words) are particularly useful as spaces are characters to a computer. In other words, values with extra spaces can be very difficult to debug. Please leave Tableau Prep Builder in this state or save your flow so we can pick up from this point in the next section of this chapter:

Figure 3.24 – Results of Make Uppercase
In this section, we learned how to profile, group, and clean data. In many cases, these will be the most common functions used in data preparation for building data models in Tableau. If our data is not cleaned and grouped properly, we can end up with misleading results in the analysis we do on that data.
We will now move to the next section, where we focus on row-level calculations.
Row-level calculations and hiding and removing fields
Creating calculations in our data model can be of great benefit to analysts, who will use it to get answers to questions they have about the data. It makes more sense for some calculations to happen during analysis. These types of calculations relate to use cases where the data modeler can’t predict the questions the analysts will have. Typical examples are running totals, differences between values, period-to-date, and percentage of totals. These calculations are hard to perform ahead of the analysis phase because we don’t know the filters and the level of aggregation the analyst will be using ahead of time. These aggregate calculations are usually best left to the analyst and not put in the data model. However, there are some exceptions to this rule, so we will be looking at aggregate calculations in Tableau Prep Builder in Chapter 4.
Many other calculations only need to be performed once. These calculations tend to occur on the row level, that is, these calculations happen before any aggregation of the data occurs. Almost all calculations on string fields occur at this level. An example would be combining a field containing the first (given) name with a field containing the last name (surname) to create a full name field. It is much better to perform these calculations in our data model because they will slow down analysis if left for that phase. It takes a lot of computing power to deal with string fields and they must be performed on every row which could easily be in the millions. We are going to look at some row-level calculations in this section.
Another useful feature of Tableau Prep Builder is the ability to hide and remove fields. Hiding a field will result in it not being visible in your Tableau Prep Builder flow, but it will still be in the data model and available to analysts. You may want to hide fields if you have a lot of fields and know you no longer need to perform any functions on those fields. Much like excluding values, removing fields does not impact your underlying data source but it does remove the field from your data model. This is a very useful function to eliminate unnecessary columns from our data model. Extra fields make our data model wider. If they aren’t needed, leaving them in can often impact query performance and make analysis harder as the analyst will have to look through a list of fields that they will never use. For this reason, removing fields is key to filtering data.
Let’s pick up from where we left off in our flow from the previous section:
- Find the Customer Name field in the profile pane. It should be the sixth field from the left. Highlight the card for the field and notice that the ribbon bar between the flow and profile pane changes dynamically based on the field type we select, in this case, a string field. Click on the ellipses on this pane to see additional options, as shown in Figure 3.25:
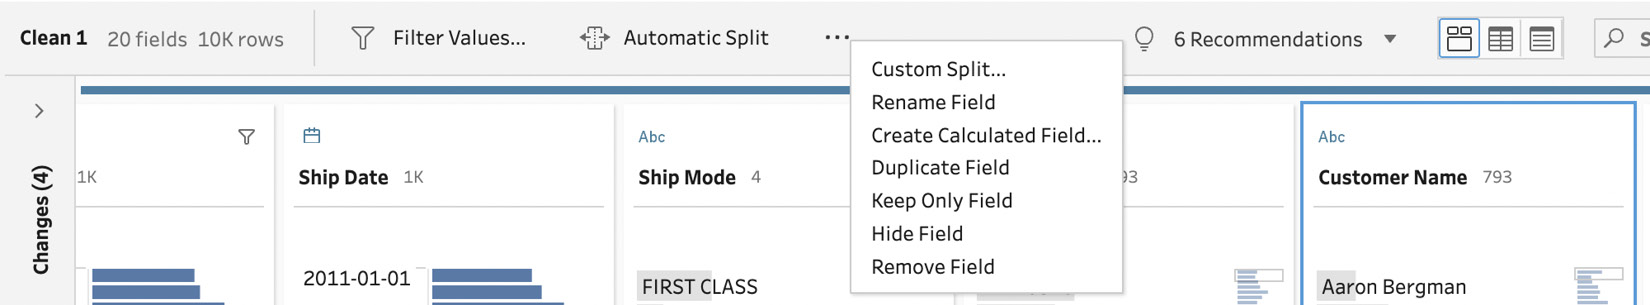
Figure 3.25 – Options for string fields
In addition to Filter Values, let’s look at the rest of the options:
- Automatic Split – using this function tells Tableau Prep Builder to split out our field using embedded logic in the product.
- Custom Split – this also splits a field but we get to decide the condition to split on. We will do this in the next step.
- Rename Field – as it sounds this allows us to rename the field. Imagine this field was called CUS_NAME in our data source. We could change it to Customer Name with this function.
- Create Calculated Field – this allows us to use Tableau’s extensive calculation language to manually write a calculation.
- Duplicate Field – this function gives us another copy of the same field.
- Keep Only Field – this function removes all other fields. It’s not commonly used.
- Hide Field – as mentioned in the introduction to this section, this function hides the field in our flow but does not remove it from the data model.
- Remove Field – as mentioned in the introduction to this section, this function removes the field from our data model.
- To split our Customer Name field into first and last name, select Automatic Split. The result is shown in Figure 3.26. You will find any new calculated fields in the leftmost position on the profile pane. You can reorder fields in the profile pane by clicking on its card and dragging it to the position where you wish it to be. In this case, we will leave the two new fields, Customer Name – Split 1 and Customer Name – Split 2, where Tableau Prep Builder puts them:
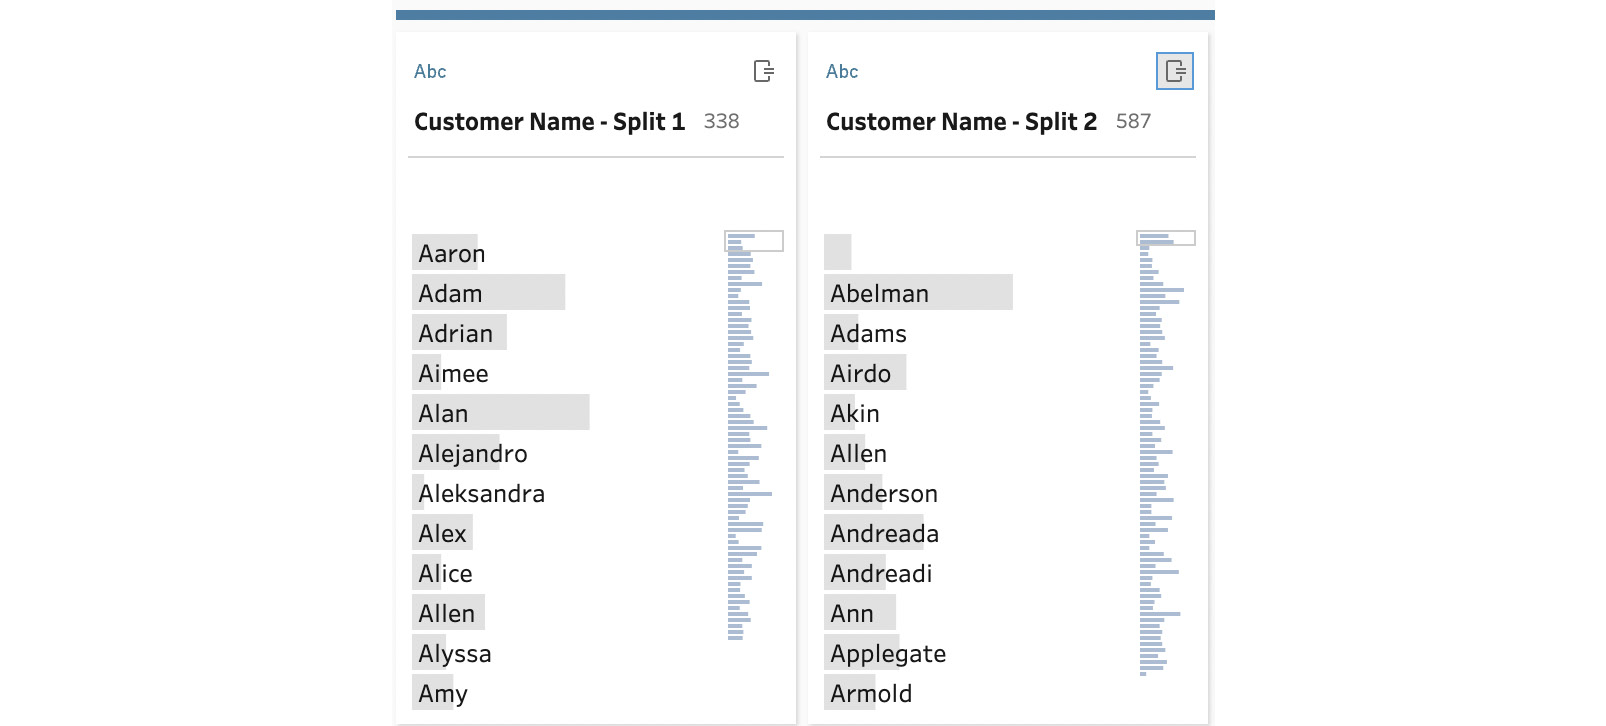
Figure 3.26 – Two new fields from the split function
- Now we get to use the Rename Field function. Highlight the Customer Name – Split 1 field and click on the Rename Field function. You will then be able to type over the existing field name to add the new name you want. Alternatively, if you double-click on the field name in the card, you will also be given the same ability, saving the step of clicking on Rename Field in the user interface. You can see this in Figure 3.27:
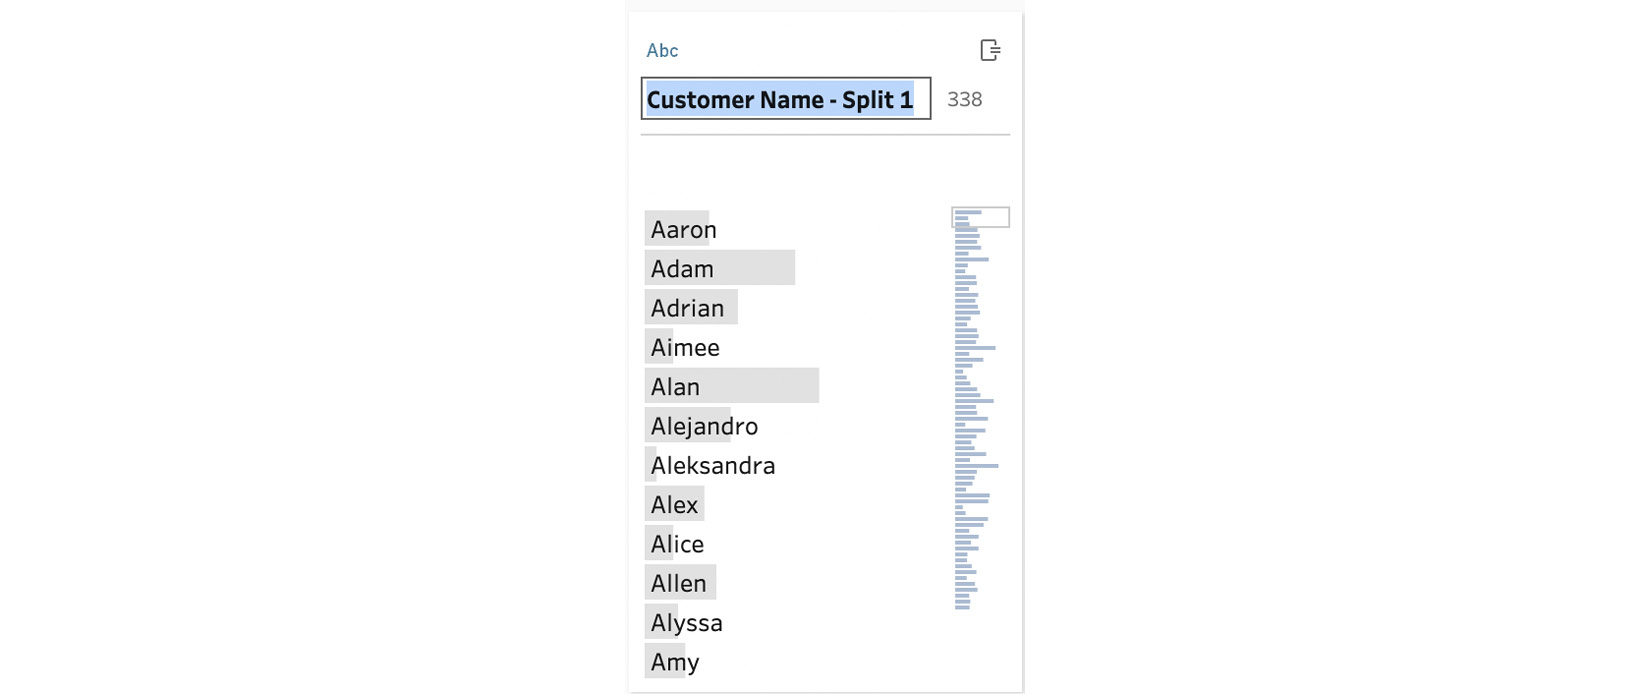
Figure 3.27 – Rename Field
Please rename the field First Name and repeat the process with Customer Name – Split 2, renaming it Last Name, as shown in Figure 3.28:
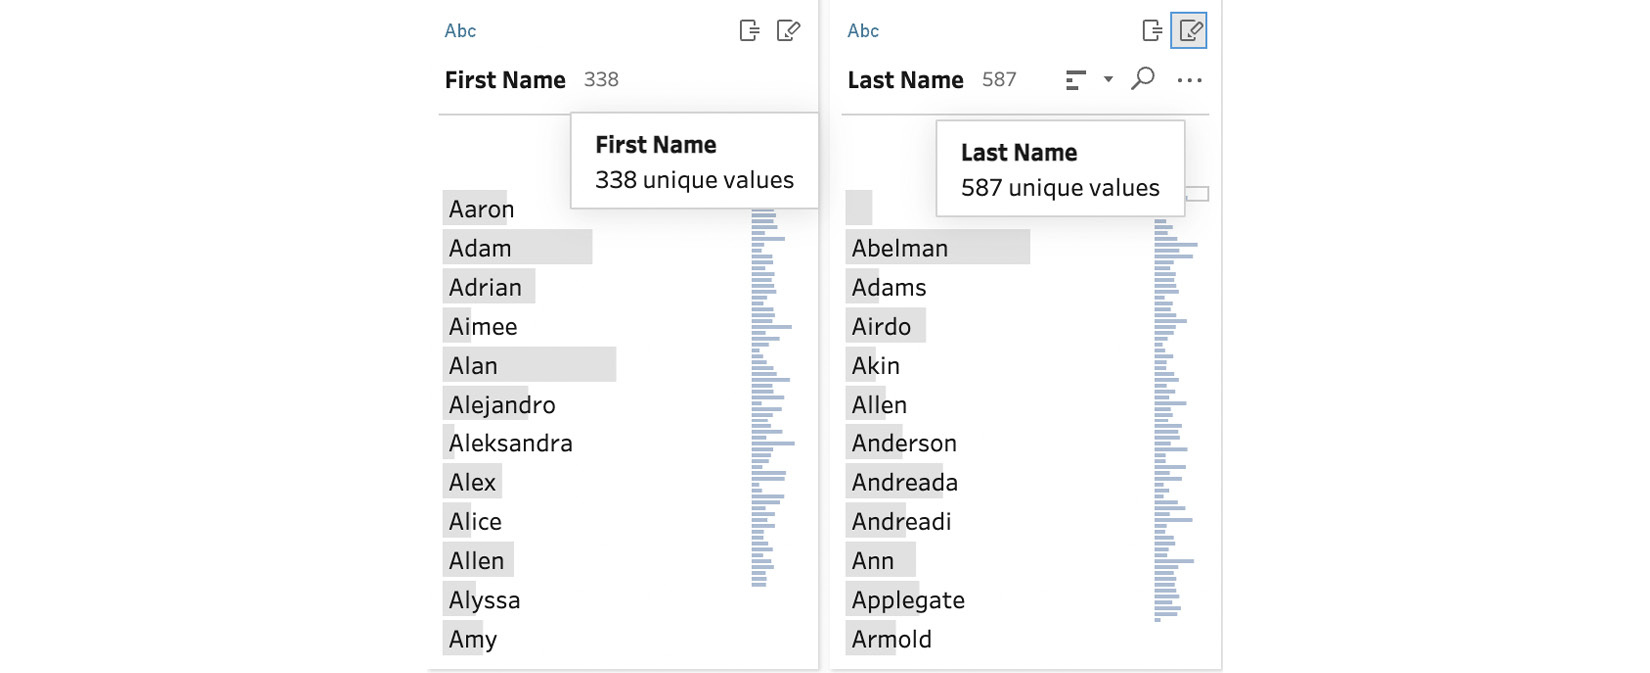
Figure 3.28 – First and Last Name fields
- In addition to string calculations, we can perform other calculations in Tableau Prep Builder using the same calculation language and engine available in Tableau Desktop. One example is date calculations. Let’s add a date calculation by finding the Create Calculated Field function on the same ribbon between the flow and profile panes. This will bring up a calculation dialog box. When the box comes up, scroll down until you find the DATEDIFF function. Tableau provides this useful reference for the calculation language without needing to go to an external reference guide. Your screen should now look Figure 3.29:
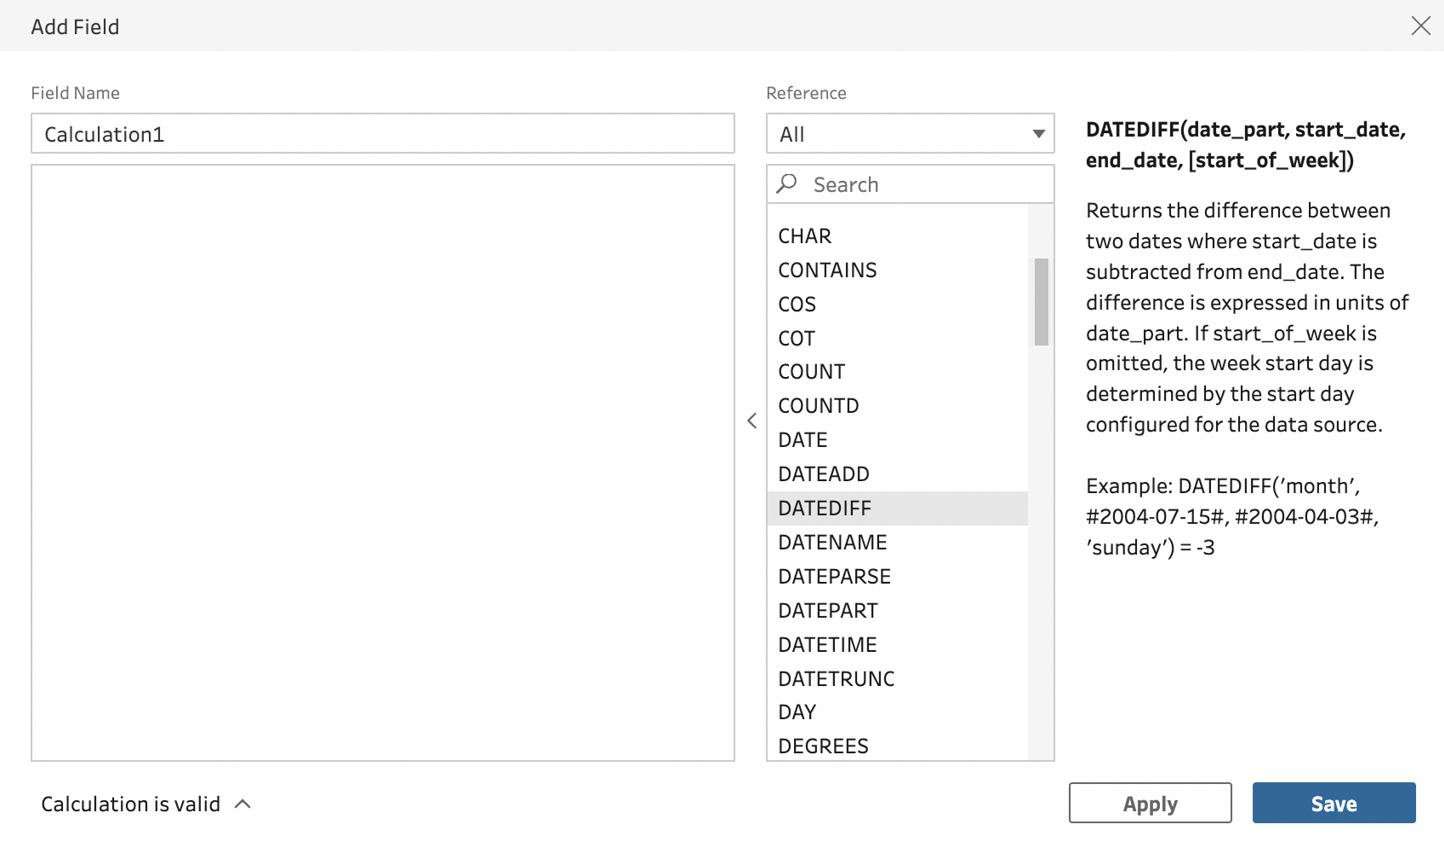
Figure 3.29 – Tableau calculation dialog box
We will now create a calculation for the number of days each row took to ship. In the field name, type Days to Ship and, in the calculation window, type DATEDIFF('day', [Order Date], [Ship Date]), as shown in Figure 3.30. Tableau will help us here. For example, when you start typing Ship Date, Tableau will find the field for you, and you can hit the Enter/Return key to autocomplete. Tableau will also let you know if there is a problem with your syntax and how to fix it. Click on Save and we have a new calculated field:
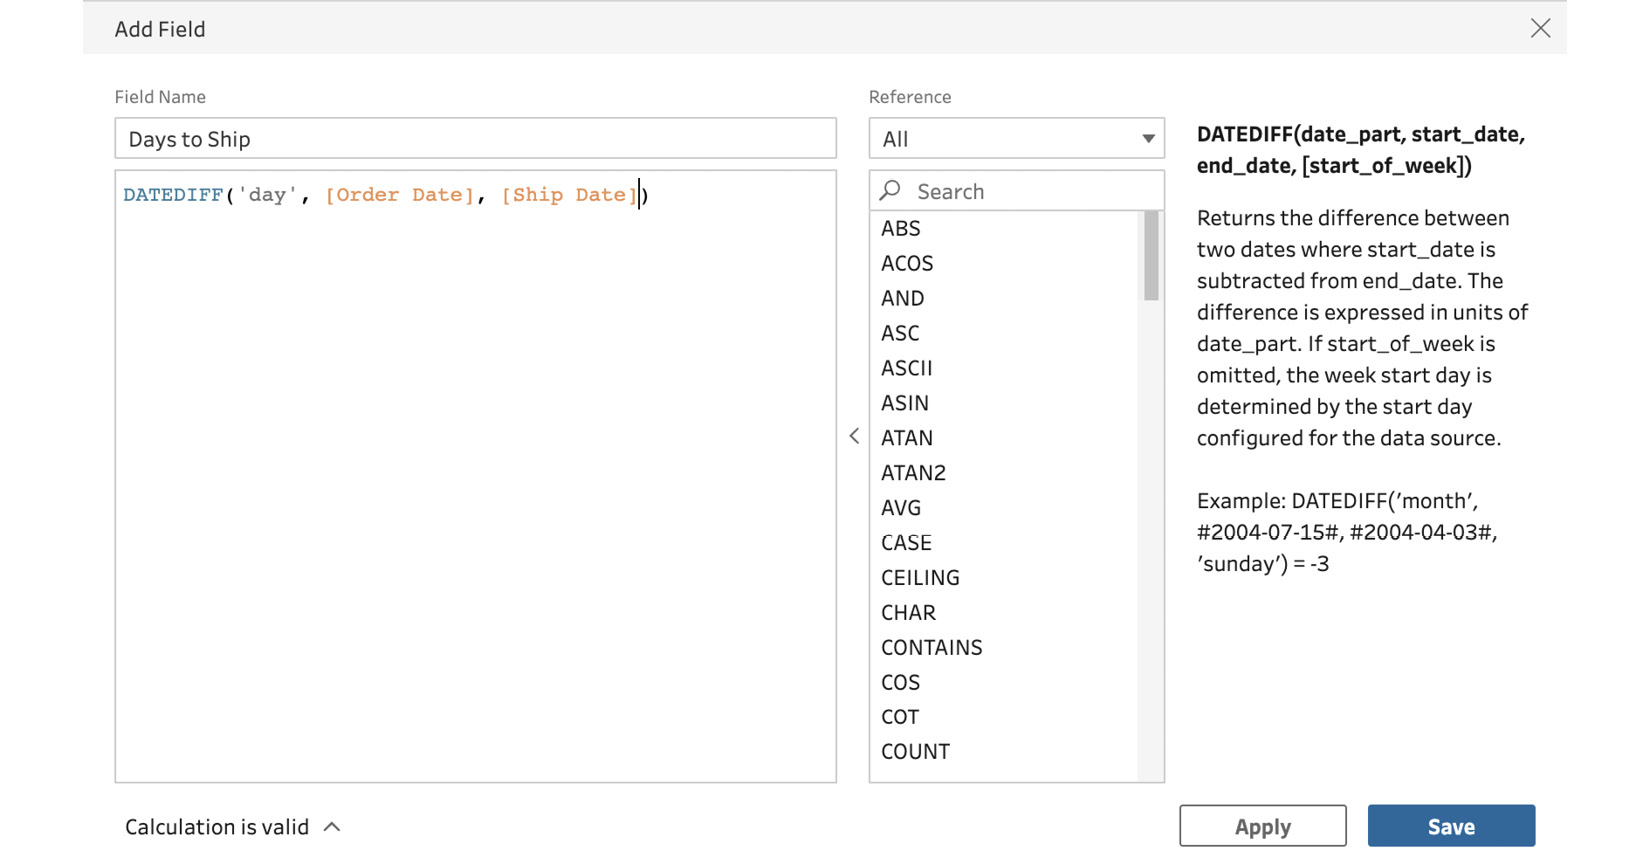
Figure 3.30 – Days to Ship calculation
- After clicking on Save, you should notice a new card for the Days to Ship field, as shown in Figure 3.31:
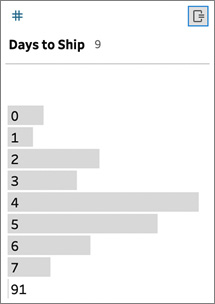
Figure 3.31 – Days to Ship field
We have just learned the importance of creating row-level calculations in our data model and have created our first two calculations, one each of a string and date calculation. In the next and final section of this chapter, we are going to look at Tableau Prep Builder changes and recommendations.
Recommendations and changes
Tableau Prep Builder has two powerful features that help direct us to items to put in our flow and give us an audit trail of our flow. They give us the ability to go back and delete or change anything in our flow without having to undo all the changes we have made since that action. The changes also automatically create documentation for the development work done in Prep Builder. If anyone else needs to work with our flow, they can use the changes pane to see everything we have done in the flow.
Let’s first look at Recommendations, picking up from where we left off in the previous section:
- Looking at the ribbon between the flow and prep panes, you will see a Recommendations button. Clicking on this button will bring up a list of recommendations, as shown in Figure 3.32:
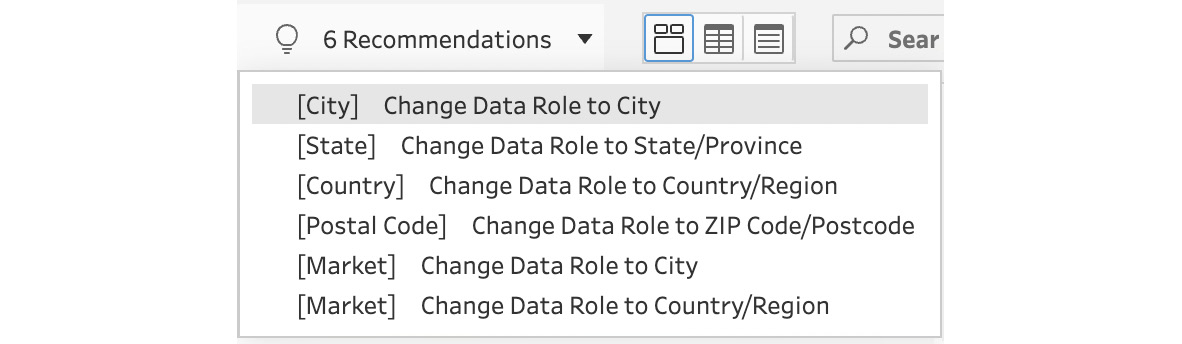
Figure 3.32 – Recommendations
- As we can see in this example, sometimes these recommendations are useful and point out things we might have missed. Specifically, changing the data role of City to City, State to State, and Postal Code to ZIP Code/Postcode all make a lot of sense. For now, we are going to ignore these recommendations, but we would implement them if we were going to publish this flow in our organization.
- Next, we will look at the changes pane. If the data pane is not already open, find the Changes (8) option to the left of the leftmost field to open it. You will then see all the changes you have made in your flow, as shown in Figure 3.33. Note that the changes pane might be collapsed. In this case, click on the > that is to the left of the profile pane and above the Changes text to expand the changes pane.
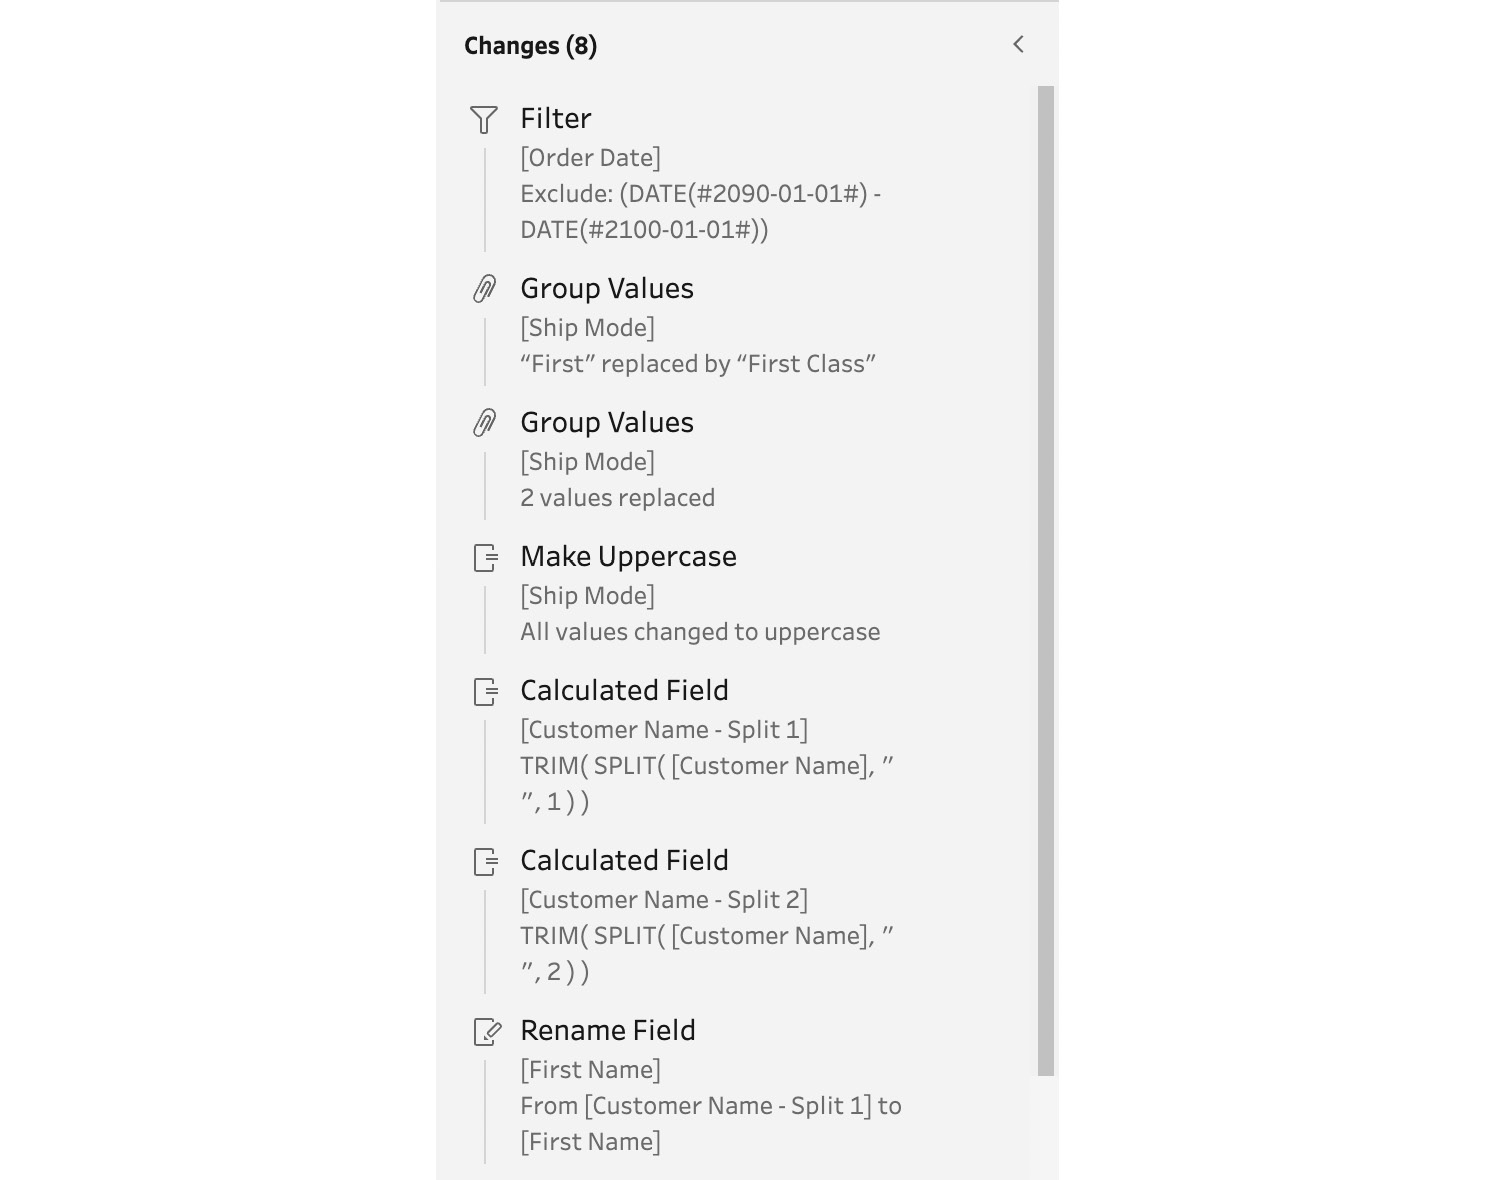
Figure 3.33 – Changes pane
- Tableau Prep Builder and Tableau Desktop have back and forward buttons that work very similarly to undo and redo in the Microsoft Windows and macOS operating systems. Changes is a much more powerful version of this. Back and forward (undo and redo) require you to undo/redo every step to get back or forward to the one you wish to change. With changes, you can go back in time and make a change without having to undo all the great work you’ve done since, as long as subsequent changes aren’t dependent on that step. By clicking on any step, you will be able to see what Tableau Prep Builder did at that stage. Let’s click on Make Uppercase and see what Tableau did at that point. First, click on Make Uppercase and then click on the pencil icon in the top-right corner of the card. You will see the Edit Field pane open, as shown in Figure 3.34:
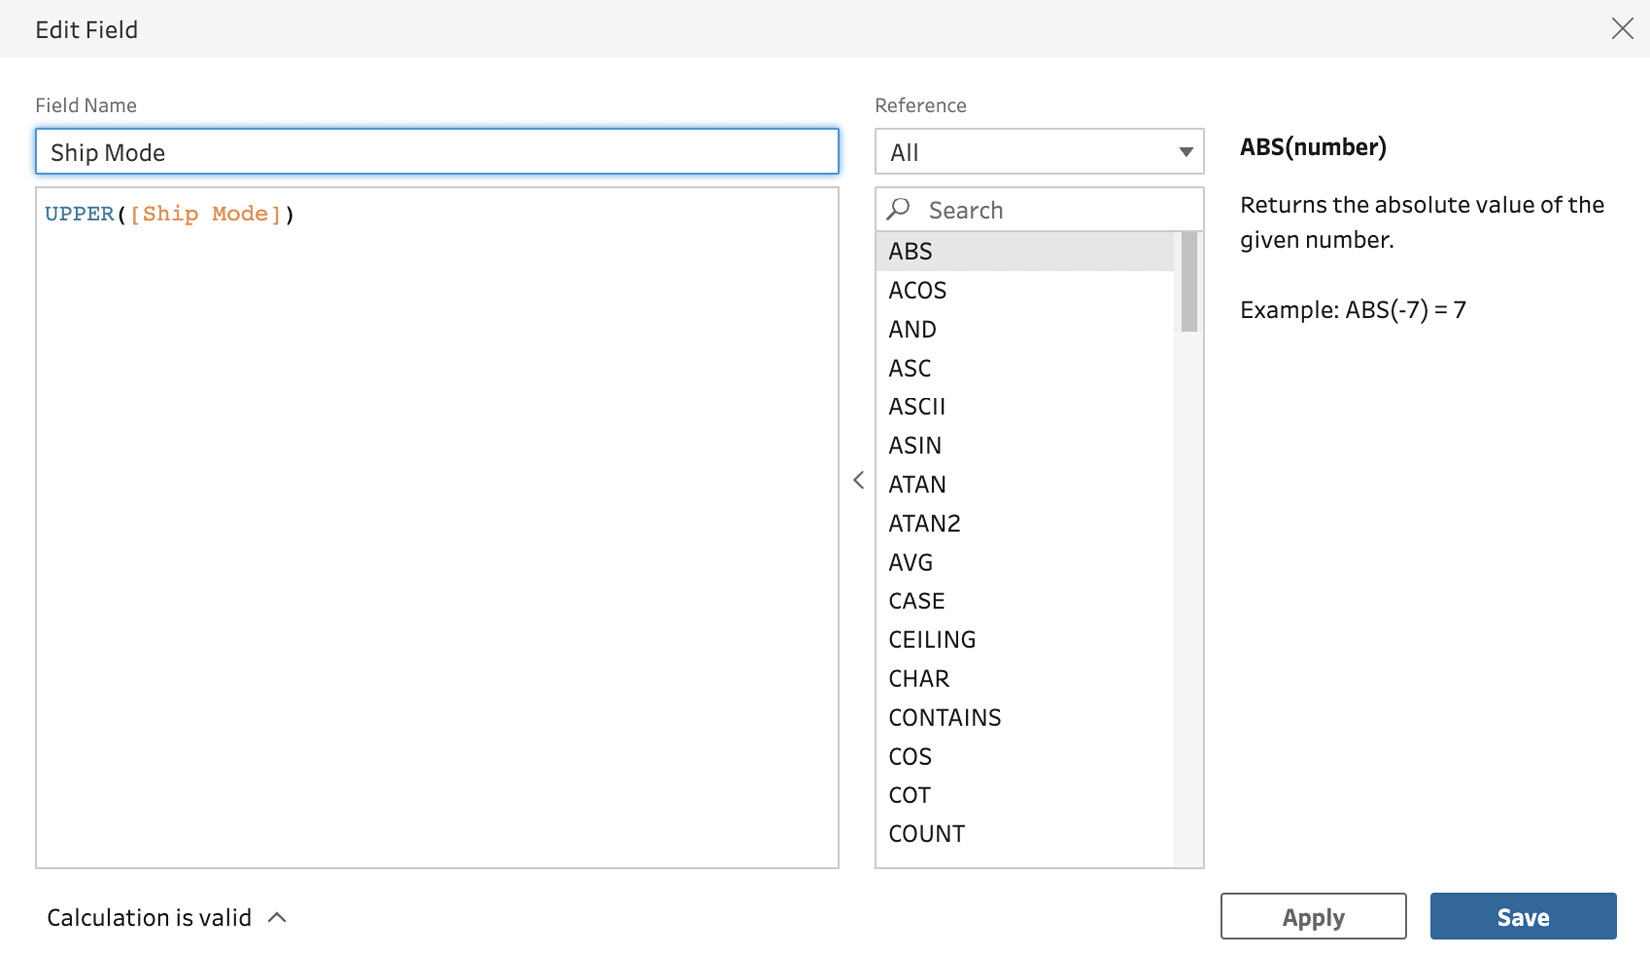
Figure 3.34 – Step to make Ship Mode uppercase
- When we made the change to make this field uppercase, we used the Tableau clean function to do it in step 15 of the Profiling, cleaning, and grouping data section of this chapter. The changes pane is also great for understanding the Tableau calculation language generated by automated functions. We don’t want to make a change to this, so press the x in the upper right-hand corner to dismiss the dialog box.
- Let’s delete the last five steps we made in our flow. To do this, go to each of these steps and click the x, as shown in Figure 3.35:

Figure 3.35 – Delete a step
After deleting the last five steps, you should be left with the changes shown in Figure 3.36. Remember, if you make a mistake, you can use the back button too:
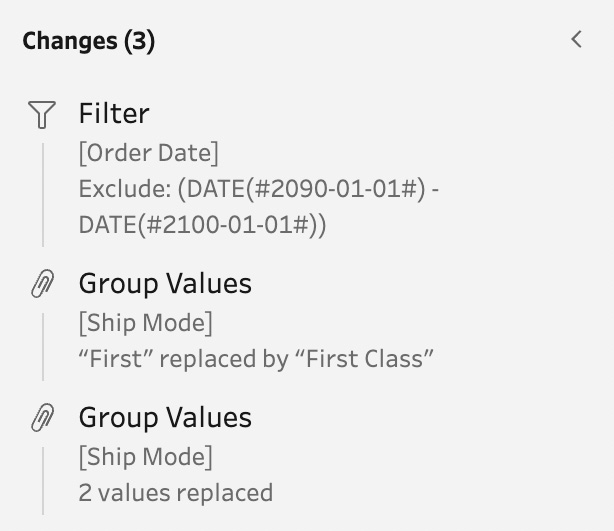
Figure 3.36 – Final state of changes
- Our final step is to save our flow. We will pick up from this point in the next chapter. Remember the name you give the flow in case you close Tableau Prep Builder between now and starting the next chapter. Tableau makes this easy by providing a Recent Flows option when you open Tableau Prep Builder.
In this section, we looked at recommendations and changes. These two features act as a safety net to make sure we don’t miss a step and to provide the ability to easily fix a step that we made earlier in our flow.
Summary
In this chapter, we learned about the foundational capabilities of Tableau Prep Builder. The main function is to create flows, which refer to the way data moves through a data preparation process. Every flow begins with connecting to data. In addition to the connection pane, flows have three key panes to help us with data preparation: the flow pane, which gives us a visual representation of the stages of our flow; the profile pane to profile the shape and contents of our data; and data details to get samples of what is in our data sources and the impact of our changes.
We also learned how to group, filter, and clean data. We learned about the impact of creating row-level calculations in our model and created string and date calculations. In the final section of the chapter, we learned how the recommendations and the changes pane can drive our efficiency, ensuring we don’t miss steps and giving us an easy way to modify or delete steps that we later realize weren’t right.
In the next chapter, we will build off this foundation knowledge and begin the more advanced data preparation functions of joins and unions, pivots, aggregate calculations, and creating new rows in our data.