
Chapter 11: Creating Playbooks and Logic Apps
In the previous chapters, you learned about the Security Information and Event Management (SIEM) side of Azure Sentinel. Now it is time to learn about the Security Orchestration, Automation, and Response (SOAR) capabilities.
Azure Sentinel’s SOAR features allow for automated, or semi-automated, responses to the creation of alerts. This allows you to develop workflows that can perform tasks such as blocking an IP address from getting through a firewall, blocking a suspicious username, or something simple such as sending an email to the security team letting them know a new high-severity alert was generated. When you combine the automation capabilities offered by Azure Sentinel with the protection capabilities of the many other security products you deploy, the sky is the limit!
In this chapter, you will learn about Azure Sentinel playbooks, including how to write and edit them, configuring their workflow, and managing them. At the end of the chapter, we will walk through the process of creating a simple playbook. By the end of the chapter, you should feel comfortable getting started writing your own playbooks.
We will cover the following topics in this chapter:
- Introduction to Azure Sentinel playbooks
- Playbook pricing
- Overview of the Azure Sentinel connector
- Exploring the Playbooks page
- Logic Apps settings page
- Creating a new playbook
- Using the Logic App Designer page
- Creating a simple Azure Sentinel playbook
Introduction to Azure Sentinel playbooks
Azure Sentinel uses Azure Logic Apps for its workflow automation. In fact, an Azure Sentinel playbook is a logic app that uses the Azure Sentinel connector to trigger the workflow. As we go through this chapter, many of the screens we will be looking at are logic app pages, which reinforces this concept. The full extent of how to use logic apps is beyond this book, so we will just cover the Azure Sentinel connector, which contains a logic app trigger and actions.
Note
For this chapter, the terms playbook and logic app will be used interchangeably. For more information on Azure Logic Apps, go to https://azure.microsoft.com/en-us/services/logic-apps/.
Logic apps use connectors (not to be confused with Azure Sentinel data connectors) and actions to perform a workflow’s activities. A logic app connector provides access to events and data. Actions will perform a specific task, such as sending an email, posting a message on Microsoft Teams, extracting JavaScript Object Notation (JSON) objects, and so much more.
By using Azure Logic Apps as the backend technology, Azure Sentinel playbooks already have a rich ecosystem of connectors and actions that they can call upon to perform their activities. Now, let’s look at the pricing considerations when using playbooks.
Playbook pricing
As mentioned in Chapter 1, Getting Started with Azure Sentinel, running an Azure Sentinel playbook is not included in the ingestion costs of Azure Sentinel or Log Analytics. It has its own separate charges that, though they may be considered small, can add up quickly.
For example, in the East US region, each logic app action that is run (and this includes things such as looking up information, extracting JSON, and sending emails) will cost $0.000025 each time it is used. There is also an additional $0.000125 for each standard connector. Granted, this seems pretty small, but if you write a logic app that has 100 actions with 1 connector that gets run each second of every day for a month, that one logic app would cost $3,564 each month!
Note
For more on Azure Logic Apps pricing, go to https://azure.microsoft.com/en-us/pricing/details/logic-apps/.
Now, this is a pretty extreme example, but it serves to remind you that when designing playbooks, you need to keep them as simple as needed and you should not do a lot of extraneous work. Next, we will discuss the Azure Sentinel connector, which you will need to use in all Azure Sentinel playbooks.
Overview of the Azure Sentinel connector
While there are many logic app connectors, and more are being added all the time, the one we are concerned with is the Azure Sentinel connector. It provides us with the trigger that can kick off our playbook. It also contains various actions that can perform tasks such as obtaining information about a specific incident, getting information about the entities associated with an alert, updating an incident, and more.
Note
It should be noted that at the time this chapter was written, all the features of the Azure Sentinel connector were in preview, so they could have changed from what is shown and discussed here.
The connector currently has one trigger called When a response to an Azure Sentinel alert is triggered. This means that the trigger will fire whenever an alert is triggered. It is worth noting that while the trigger returns a lot of information, it does not return the actual incident that gets created, if one gets created at all. In order to get the incident information, you need to use one of the actions to obtain the details.
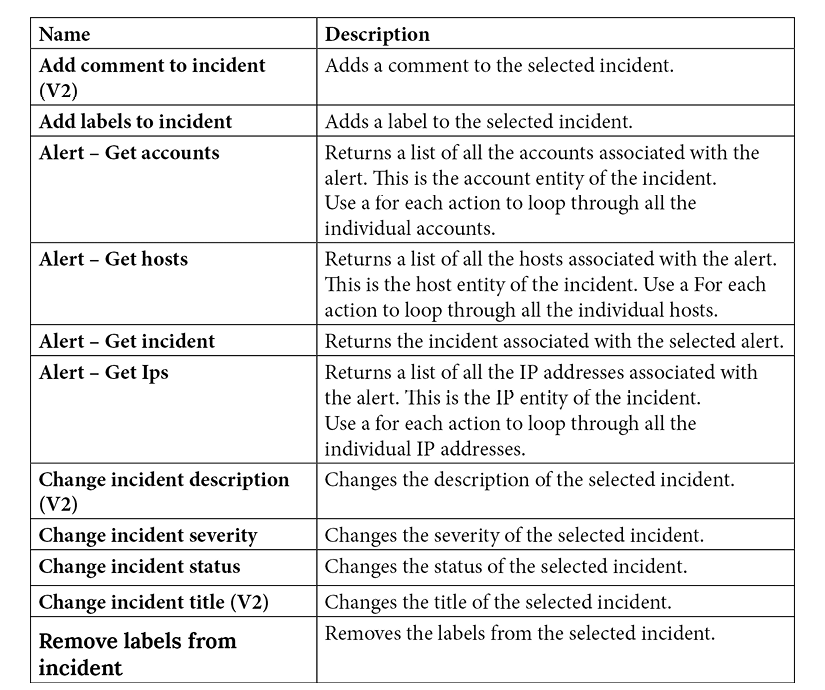
The following table lists all the current actions for the Azure Sentinel connector:
Note
Some actions may have (V2) or a higher number after the title. Those are newer versions of the action and may break old functionality, so you want to check periodically to make sure there is not a new version of an action you are using.
As stated before, all Azure Sentinel playbooks will need to use this Azure Sentinel connector for the logic app to be considered a playbook. It also provides a lot of actions that you can use to get more information about, and update information in, incidents. You will be using this connector a lot and you should familiarize yourself with its actions. Next, we will start the journey of creating your own playbooks by looking at the Playbooks page.
Exploring the Playbooks page
To access the list of playbooks, from the Azure Sentinel page select Playbooks in the navigation pane. This will take you to the Azure Sentinel Playbooks page.
This page will actually list all the logic apps in the subscription(s) you have selected to show in the Azure portal. You will need to look at the Trigger kind column at the far right to see whether the logic app can be used as a playbook. If it states Azure Sentinel, you can use this logic app as a playbook:
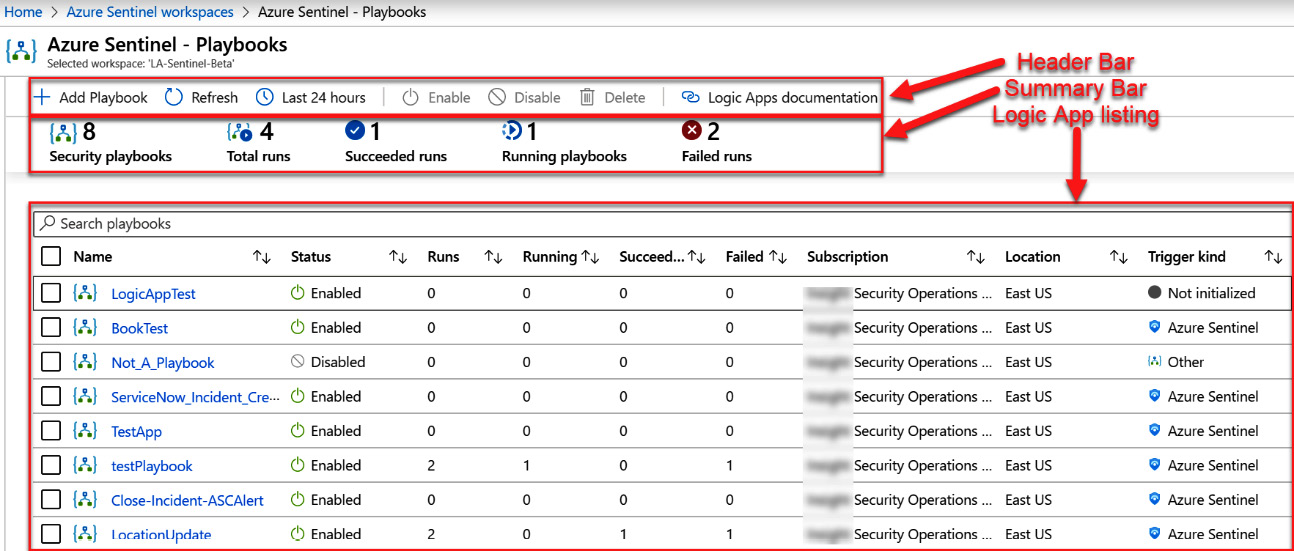
Figure 11.1 – The Azure Sentinel Playbooks page
Tip
You can also access your playbooks by going to the logic app screen. However, it will not present the same amount of information as shown in the preceding screenshot.
If you have used logic apps before, you will notice that this page is similar, but not identical, to the Azure Logic Apps page. There are some differences that make it a bit easier to use. Let’s take a look at the different fields of this page.
The header bar
The header bar, shown in the following figure, contains the following buttons:

Figure 11.2 – The Azure Sentinel Playbooks page’s header bar
Let’s discuss each field in detail:
- The Add Playbook button allows you to add a new playbook (which is described in the Adding a new playbook section).
- The Refresh button will refresh the display.
- There is the time dropdown.
- The Enable, Disable, and Delete buttons are only available if one or more logic apps are selected.
- The Logic Apps documentation button will take you to a page with more information on logic apps and how to create them.
The header bar will be used to create new playbooks, as well as change the time frame that you are looking at, and give you more documentation on how to work with logic apps.
The summary bar
Under the header is the status bar:

Figure 11.3 – The Azure Sentinel Playbooks page’s summary bar
All the information presented here, other than the number of security playbooks, will use the time dropdown to determine how far back in time to show the results:
- On the left side is the Security playbooks number. While this is called Security playbooks, it is the number of all the logic apps in your selected subscriptions.
- To the right of that is Total runs, which is the total number of times all the logic apps have run. This is the sum of Succeeded runs + Running playbooks + Failed runs.
- After that is Succeeded runs, which states out of all the number of times the various logic apps have run, how many of them were successful.
- To the right of that is Running playbooks, which can be slightly confusing as it really shows how many logic apps are running, not just playbooks.
- At the end is Failed runs, which shows how many times a running logic app failed.
Let’s look at the logic app listing.
Logic app listing
Under the summary bar is the listing of all the logic apps, as shown in the following figure. For each logic app listed, there is a selection checkbox, followed by Name, Status (Enabled or Disabled), the number of total runs (which is the sum of the Running, Succeeded, and Failed columns), how many instances of the logic app are running, how many times the logic app succeeded, how many times it failed, which subscription it belongs to, which location the logic app resides in, and the trigger kind, of which we only care about Azure Sentinel.
As with the status bar, the numbers shown in the Runs, Running, Succeeded, and Failed columns are based on the time selected in the time dropdown, as shown in the following figure:
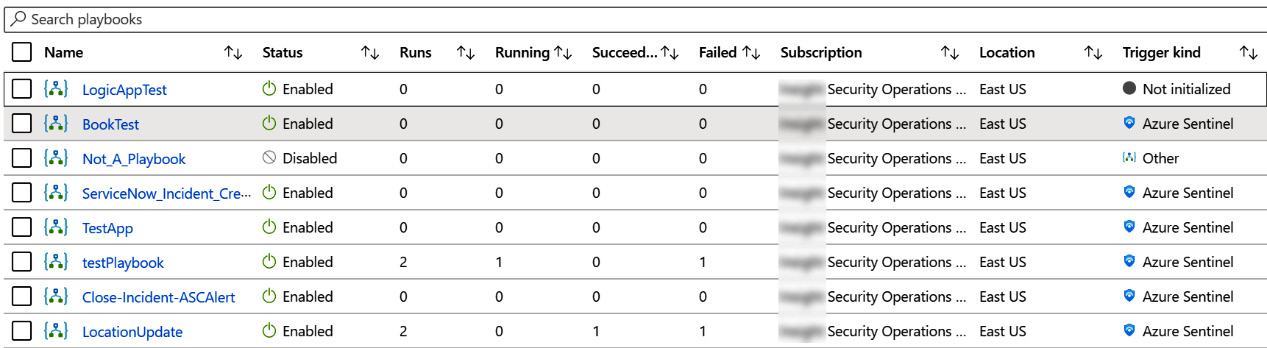
Figure 11.4 – Logic apps list
That is the makeup of the playbook overview page. Next, we will look at a specific playbook using the logic app settings page.
Logic app settings page
You’ve just seen the overview section. What if you want to look at a specific item? We’ll discuss that now.
Clicking on the name of the logic app, shown in figure 11.4, will bring you into the logic app settings page. This is where you can create, edit, or delete an individual logic app, and see more information regarding your logic app, as well as see the history of your logic app’s runs, as shown in the following screenshot:
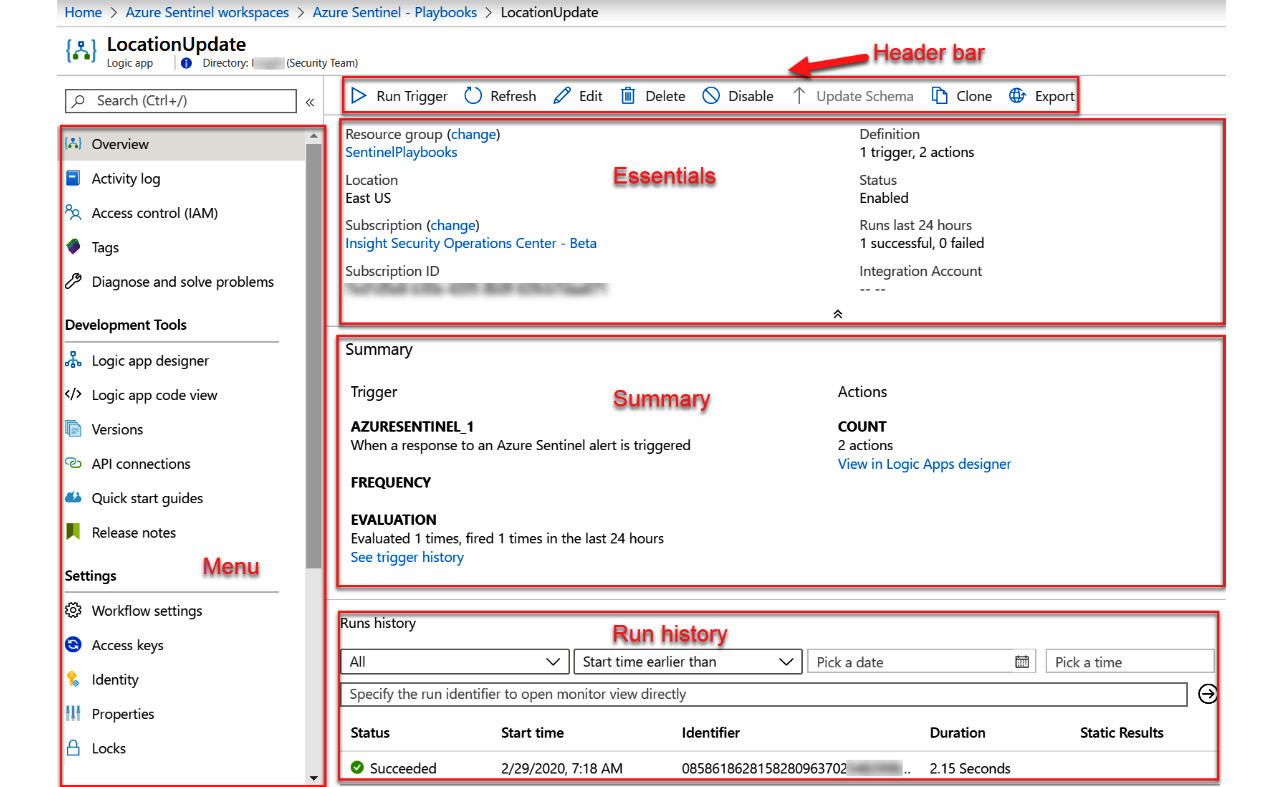
Figure 11.5 – Logic app overview page
Each section will be discussed in more detail in the following sections.
The menu bar
This is where you perform more actions against this logic app. We will not discuss all the options available in the left-hand navigation menu as they are out of the scope of this book; however, we encourage you to take some time to study the full capabilities of logic apps.
The header bar
The header bar contains the following buttons, which allow you to quickly manage the logic app:
Figure 11.6 – The logic app overview page’s header
Each field is as follows:
- The Run Trigger button will cause the logic app to run. This is not very useful with most playbooks as they will require an alert trigger’s information to run.
- The Refresh button will refresh the page. This can be useful when running a playbook to tell you when it is finished running, as the results of the run would show up in the Runs history section.
- The Edit button will allow you to edit the logic app’s workflow. Refer to the Using the Logic App Designer page section for more information.
- The Delete button will allow you to delete this logic app after confirming you want to perform the action.
- The Disable button will disable this logic app so that it will not run, even if the connector is triggered. If the logic app is disabled, then this button will be called Enable.
- The Update Schema button will only rarely be enabled and only if there is some change to a logic app that requires you to update the underlying schema.
- The Clone button will allow you to make a copy of this logic app. This can be useful if you want to try out some changes without losing the original.
- The Export button will allow you to export the logic app to Power Automate and Power Apps. As playbooks cannot be exported, this feature will not be covered here.
Let’s take a look at the next field.
The essentials section
This section shows the most essential information for the logic app. Most of the fields are shown with all other types of Azure resources and are self-explanatory, so they will not be covered, with two exceptions:
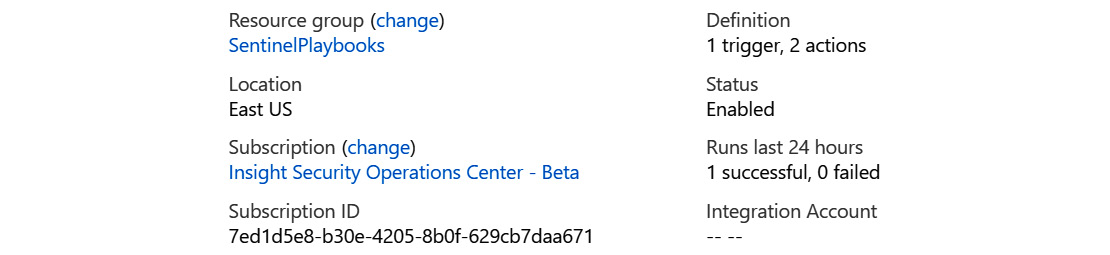
Figure 11.7 – The logic app overview page’s essentials section
Each field is as follows:
- The Definition field will show the number of triggers and actions that make up this Logic App.
- The Integration Account field will show you the integration account you are using if you use enterprise integrations.
Tip
For more information on using Integration Account with logic apps, go to https://docs.microsoft.com/en-us/azure/logic-apps/logic-apps-enterprise-integration-create-integration-account.
The summary section
This section, as follows, displays information that is specific to logic apps. The fields are broken down into two sections: Trigger and Actions:

Figure 11.8 – The logic app overview page’s summary section
Each field is as follows:
- The Trigger field will show the name and the description of the trigger that the logic app uses.
- The FREQUENCY field will show how often this logic app will run if it is set to run on a timer. It will be empty for playbooks as they get triggered based on when an alert is created.
- The EVALUATION field will show you what has happened if and when the logic app has run in the last 24 hours.
- The COUNT field will show you the number of actions that make up the workflow of this logic app, much like the Definition field described earlier.
Let’s take a look at the next one.
The Runs history section
This section will provide you with information on all the times this logic app has run:
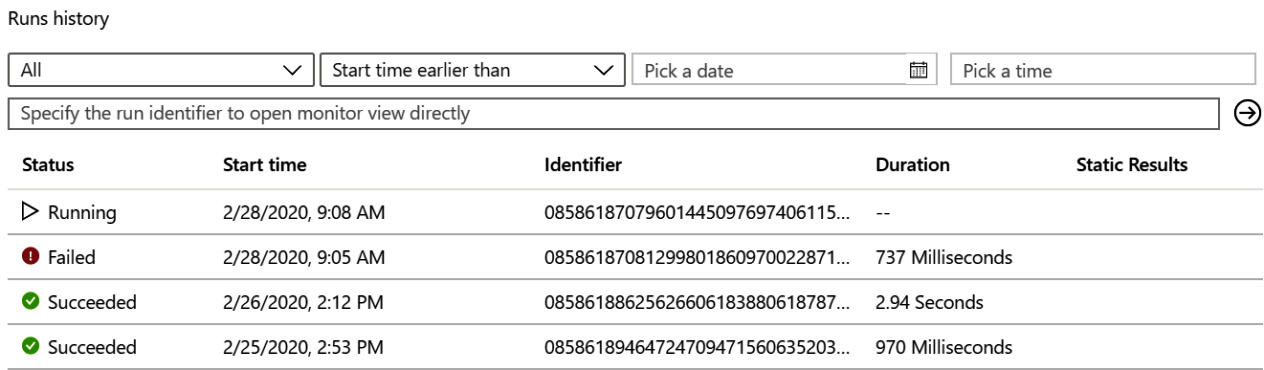
Figure 11.9 – The logic app overview page’s Runs history section
Each field is as follows:
- The Status field will show if this instance of the logic app is running, has failed, or has succeeded.
- The Start time field will show the date and time that the logic app instance started.
- The Identifier field will show a unique ID that represents this logic app. You may need to provide this if you are ever debugging a logic app issue with Microsoft.
- The Duration field will show how long it took this instance to run.
- The Static Results field will show any static results you have set up in order to test this logic app.
The main items on this page that we will focus on are the Edit button in the header, so that we can make changes to our playbook, and Runs history at the bottom of the page, which lets us know which instance of the logic app succeeded or failed, and if it failed, why.
Tip
For more information on debugging logic apps, go to https://docs.microsoft.com/en-us/azure/logic-apps/logic-apps-diagnosing-failures.
Now that you know how to look at existing playbooks, how do you go about adding one? This next section will cover adding a new playbook.
Creating a new playbook
You are going to want to create your own playbooks, so now it is time to investigate how to do that.
In the Azure Sentinel playbooks page (see figure 11.1), click on the Add Playbook link in the header. This will open a new tab in your browser that will open the Logic App screen, as shown in the following figure:
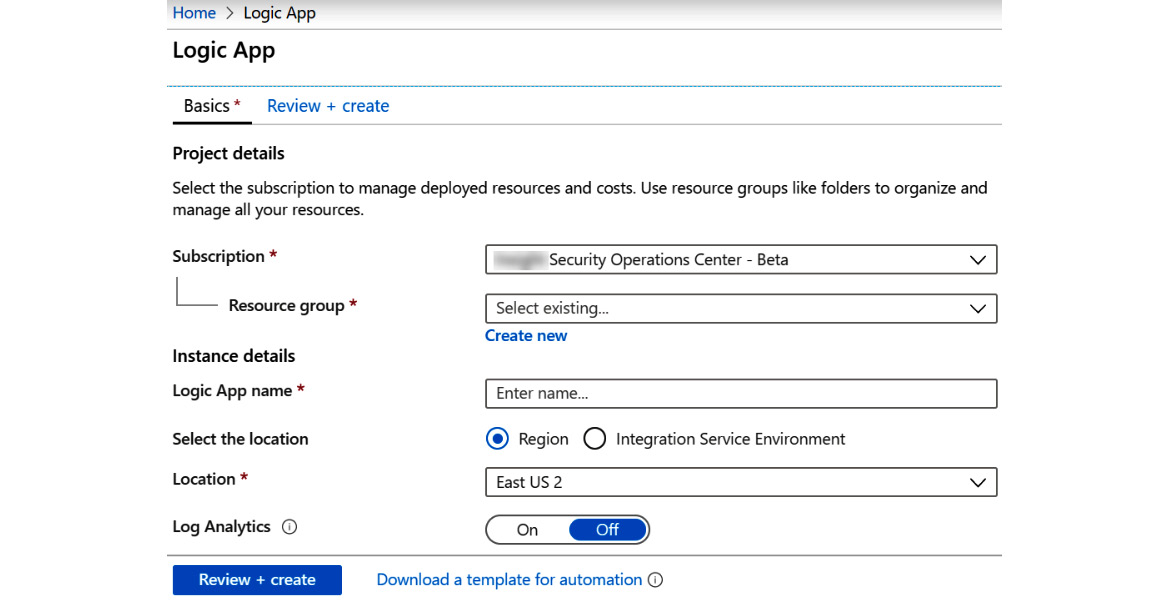
Figure 11.10 – Adding a new playbook
Let’s discuss the different fields:
- In the Logic App name field, enter a descriptive name. No blanks are allowed but you can use underscores. Make the name descriptive enough so that other users will know what the playbook is intended to do.
- In the Subscription dropdown, select the appropriate subscription. This should be the same subscription as where your Log Analytics (and Azure Sentinel) workspace is located.
- In the Resource group field, select an existing resource group or create a new one. It does not matter whether your playbooks are in the same resource group as your Log Analytics or not. However, you should follow your organization’s Azure architecture design policies, if there are any.
- In the Location dropdown, select the appropriate location. This should be the same location as where your Log Analytics workspace is located to avoid egress charges.
- In the Log Analytics field, if you want information about this playbook’s runtime events to be stored in Log Analytics, turn this on. This will be useful if you need to allow another system, such as Azure Sentinel, to perform queries against this information.
Once all your information is filled in, click the Review + create button. This will validate that the information you entered is correct and, if it is, it will allow you to create the logic app. If not, it will inform you of what is wrong and allow you to go back to the main page to fix the issues.
It may take a little while for your logic app to get created. You will be taken back to the main playbook page while this happens.
That is how you create the basis for your playbook. As it stands right now, it does nothing as there is no workflow steps in it. Next, we will explore how to add the workflow components to make your playbook useful.
Using the Logic Apps Designer page
Once the playbook has been created, you will be taken to the Logic Apps Designer page. There are actually two different views for this page.
The first view, shown in the following figure, will be shown if your workflow is empty. It provides a quick introduction video, some common triggers, and predefined templates that can be used to help you get started building your workflow. Note that the view shown in the following figure will only show up the first time you edit the workflow for a specific logic app. After that, if there is no workflow, you will be shown a listing of templates and the Blank Logic App button, which will allow you to create an empty workflow that you can add into:
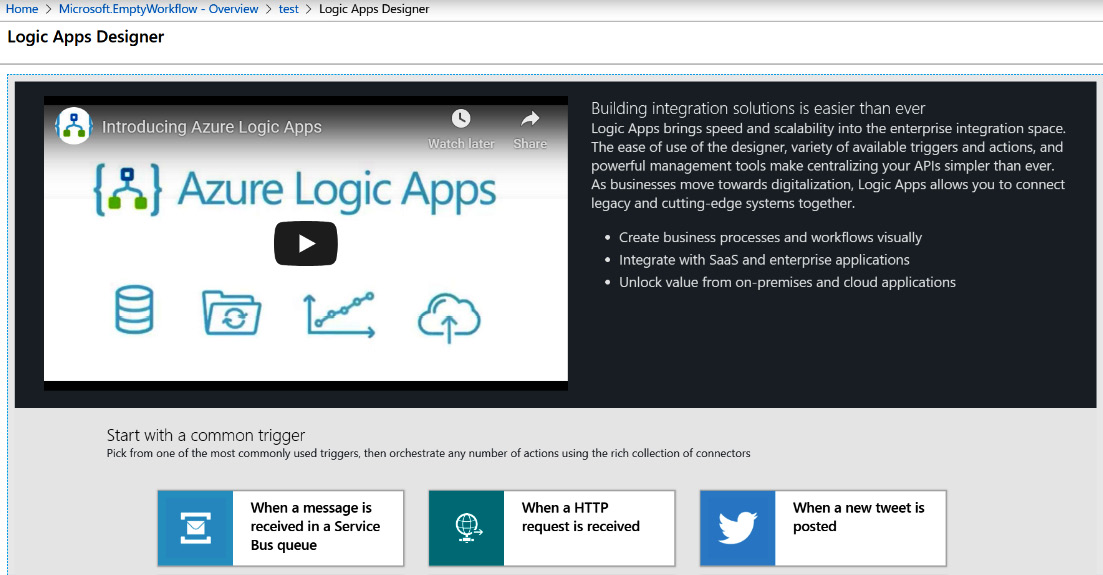
Figure 11.11 – Logic Apps Designer first view
Note
At the time of writing, there are no Azure Sentinel playbook templates on this page, but, hopefully, there will be soon.
Scroll down the page and then click on the Blank Logic App button to start building your playbook.
Once you click on the button, the second view will be shown, which will look similar to what is shown in the following figure. Depending on what connectors and actions you have used recently, the listing under Recent in the workflow editor section will be different, or it could be empty:
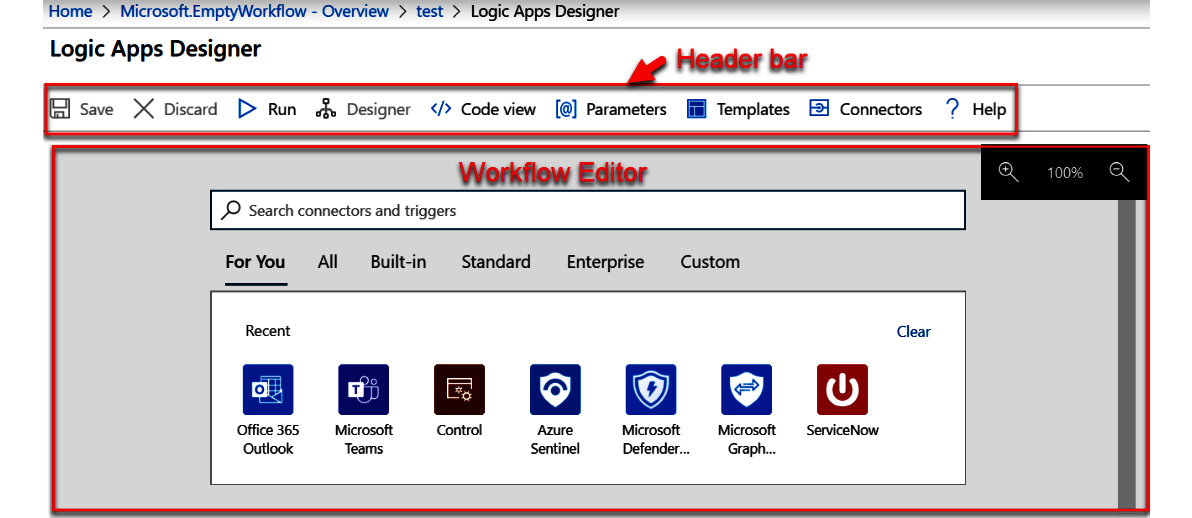
Figure 11.12 – Logic Apps Designer second view
Each section of this page is described in more detail in the next section.
The Logic Apps Designer header bar
The header bar, shown in the following screenshot, contains all the buttons to work with this workflow. Here, you can save or discard your changes, switch between the GUI and the code views, add parameters, and more:
Figure 11.13 – Logic Apps Designer page’s header bar
The details of each button are as follows:
- The Save button will allow you to save your changes. It will only be active if you have made any changes to the workflow.
- The Discard button will discard all the changes you have made and revert the workflow back to the last saved instance. It will only be active if you have made any changes to the workflow.
- The Run button will run the workflow you are currently viewing.
- The Designer and Code view buttons work together to either show you the designer view or the code view. If you press the Code view button, the JSON code that makes up this playbook will be shown. If you press the Designer button, you will be taken to the GUI view. You can work in either view; however, only one of the buttons will be active at a time. If you are in the Designer mode, then the Code view button will be active. Likewise, if you are in the Code view mode, then the Designer button will be active.
- The Parameters button will bring up the Parameters blade, which will allow you to add, edit, or delete parameters for this playbook. Parameters are a way of passing in information to your logic app, mainly during automated deployments.
Go to https://docs.microsoft.com/en-us/azure/logic-apps/logic-apps-azure-resource-manager-templates-overview to get more information on using parameters in logic app deployments.
- Templates will bring up a list of pre-existing templates that you can use to base your playbook on. Note that when you click this button and select a template from the list, your existing playbook’s design will be overwritten by the template.
- The Connectors button will open a new page that will discuss logic app connectors, as well as provide a list of existing, non-preview connectors and actions. This is a good place to start if you need information on your connector.
Go to https://docs.microsoft.com/en-us/connectors/ to see all the available connectors under the Connector Reference section.
Let’s discuss the workflow editor section.
The Logic App Designer workflow editor section
The Logic App Designer page’s workflow editor section, shown in the following figure, is where you will do most of the work creating your workflow. It is where you will build your workflow:
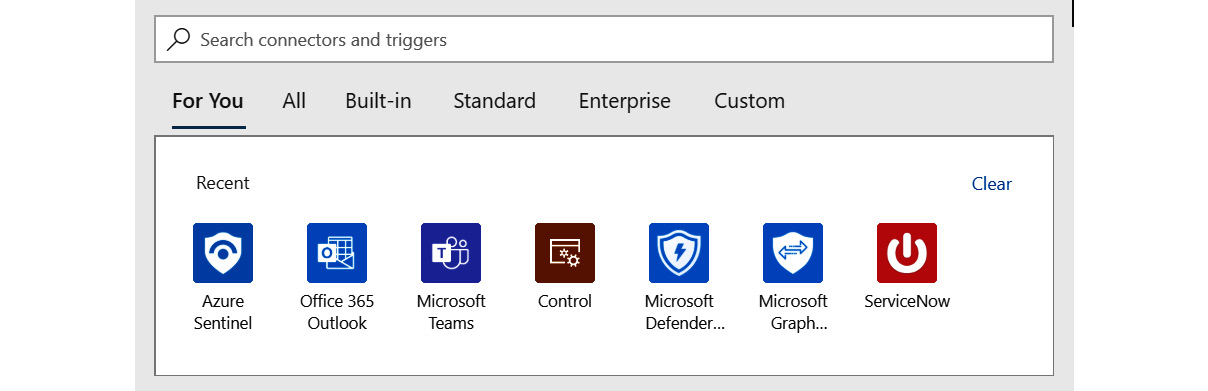
Figure 11.14 – The Logic Apps Designer page’s workflow editor section
This is where you will select the trigger that you want to use and then add the various actions that you need to use.
Now you know how to create an Azure Sentinel playbook. While the process itself is fairly simple, the workflows you can create can be as complex as you want. In the next section, we will take all that we have learned in this chapter and create a simple playbook.
Creating a simple Azure Sentinel playbook
This example will take you step by step through the process of creating a new Azure Sentinel playbook. The scenario we are solving is notifying our security analysts using Microsoft Teams that a new, high-severity incident was created.
The first step is to create a new playbook that Azure Sentinel can use. Remember that for Azure Sentinel to be able to use a playbook, it must use the Azure Sentinel connector:
- Go to the Azure Sentinel playbook screen and click the Add Playbook button in the header. Follow the Creating a new playbook section to add a new playbook. For this playbook, I am calling it BookDemo. Select the appropriate resource group and location. For this example, you do not need to store information in Log Analytics.
- Once your playbook has been created, click on the Blank Logic App button to create a new logic app that has nothing in it.
- In the Logic App Designer page, find and select the Azure Sentinel connector. If you do not see this connector listed in the Recent connector listing, enter Azure Sentinel in the search box and select the connector when it shows.
- Connect to your Azure Sentinel if the connector requires it: as stated previously, the trigger from the Azure Sentinel connector returns information about the alert and most of the actions work against an incident. So, how do you get the incident? Use the Alert – Get incident action. Click on the New step link, select the Azure Sentinel entry in the Recent section, or search for it if need be. The connector will be added again and this time it will show the actions as shown in the following screenshot:
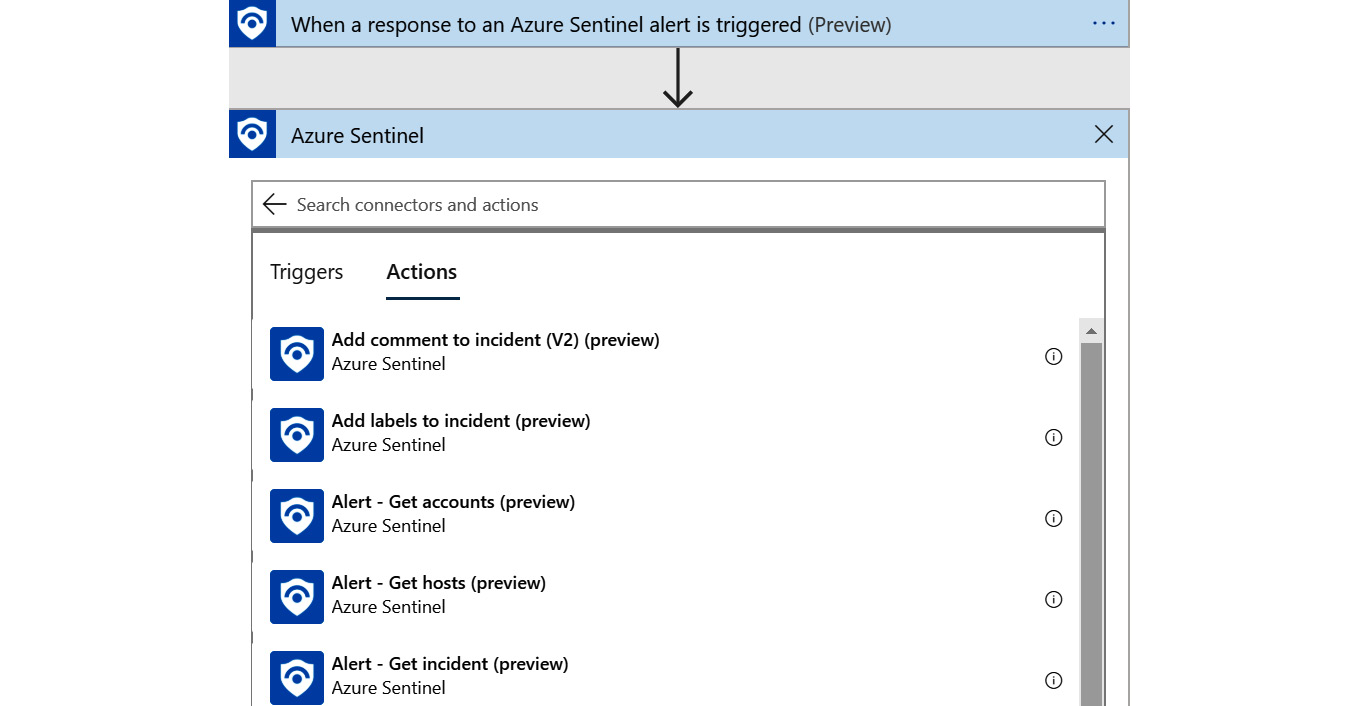
Figure 11.15 – Azure Sentinel connector actions
Note
There is a functionality for Azure Sentinel that allows you to create analytic rules that will raise an alert without generating an incident. For this example, we are assuming that the analytic rule(s) using this workflow will be creating an incident.
- Scroll down until you find Alert – Get incident (preview) and select it.
- Once the action is added, the following fields need to be filled in:
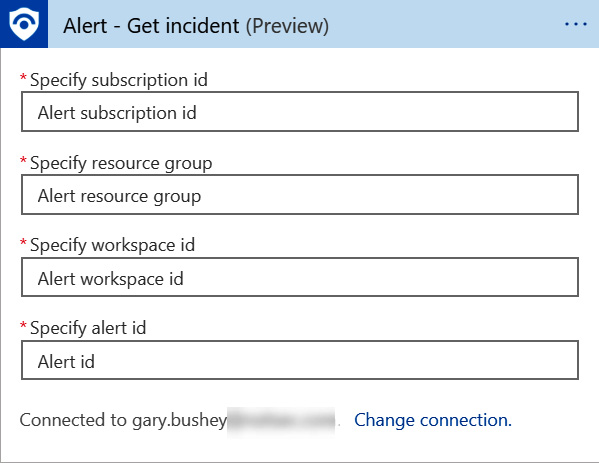
Figure 11.16 – Alert – Get incident fields
- The great thing is that the Azure Sentinel trigger can provide all these fields for us via dynamic content. Click on the Specify subscription id field. A new window will pop up that has a listing of all the fields that the trigger provides, as shown in the following screenshot:
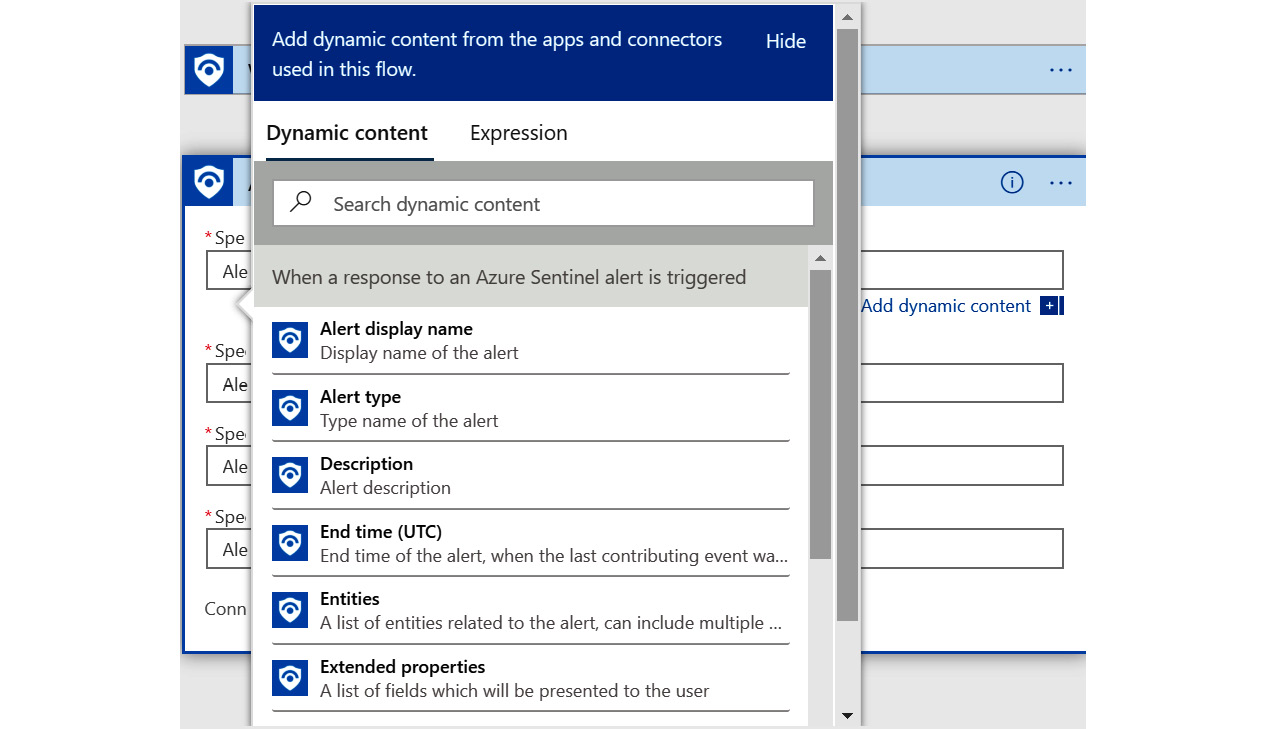
Figure 11.17 – Dynamic content
- These fields are the dynamic content in that the variable name will be replaced with the actual value when the playbook runs. Most triggers and alerts have their own dynamic content and as new steps are added, this list will grow.
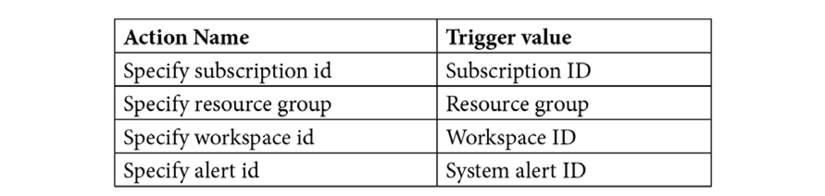
- Map the fields with the trigger value as shown in the following table:
- When you are done, your alert should look like the following:
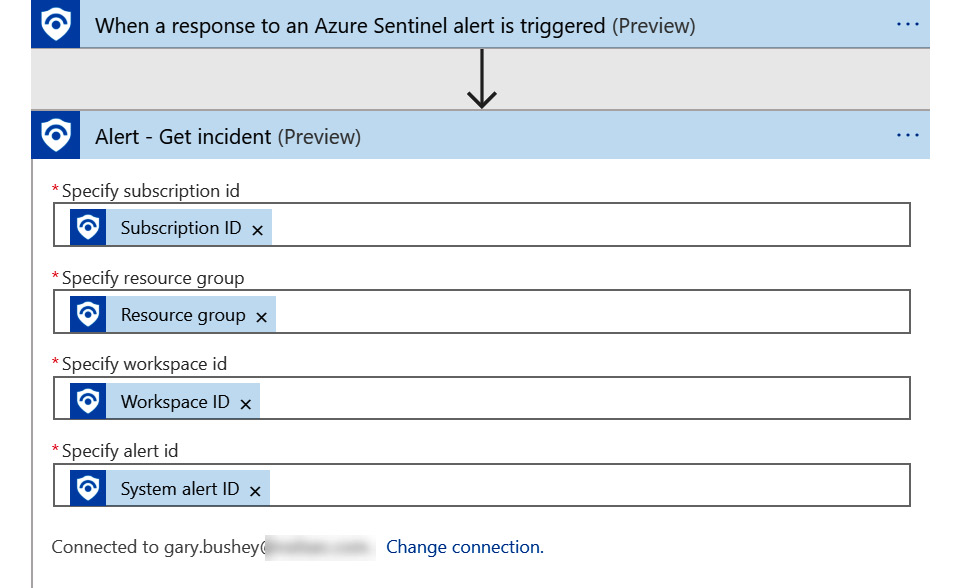
Figure 11.18 – Alert – Get incident completed
Now that we have the information from the incident, what do we do with it? The scenario states that we need to alert the analysts if a high-severity alert is raised. The Alert – Get Incident action returns all the incidents, so we need to filter for just the high-severity ones:
- Click on the New step link and then search for Condition.
- Select the Control connector when it shows. We are going to be using an If statement, but all the control type statements are bundled together into that one connector.
- Select the Condition action and the action will be added, as shown in the following screenshot. Notice that it has three parts: the top part is where the actual condition is entered, the lower-left part is what to do if the test returns true, and the lower-right part is what to do if the test returns false:
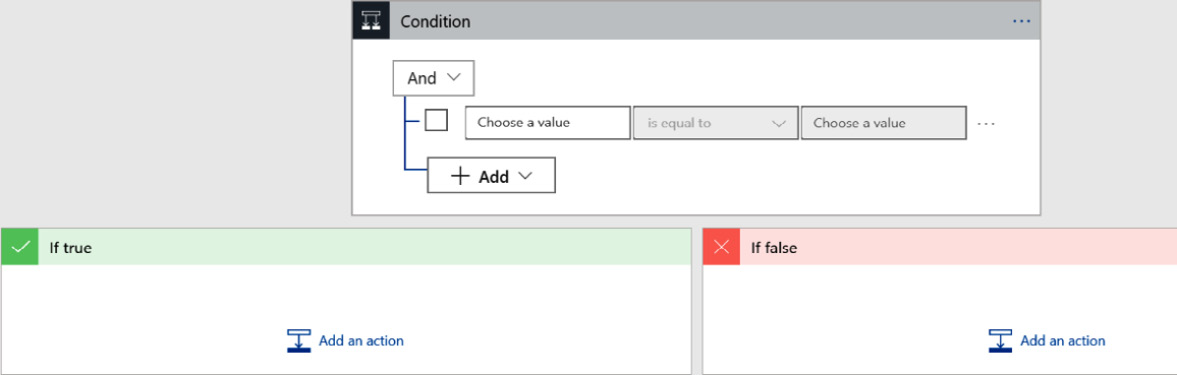
Figure 11.19 – Condition step options
- Based on what you have learned in this section, set up the condition so that you are checking whether the Severity is equal to High.
Hint
Both the Azure Sentinel connector’s trigger and the Alert – Get incident action both return the severity and it does not matter which one you choose.
The following figure shows you how it should look:
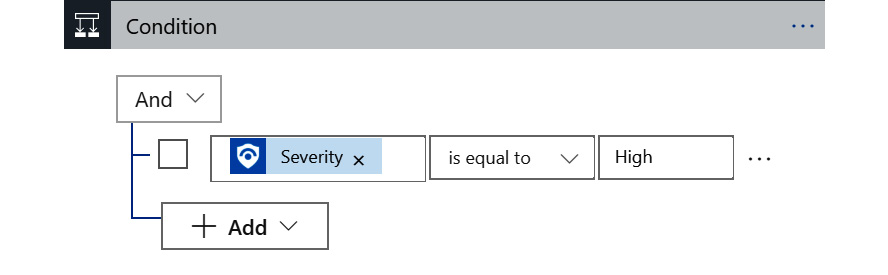
Figure 11.20 – Condition step options completed
- You can easily add more conditions if you need to in the future.
Now we need to post the message. To do this, follow these steps:
- Click the Add an action link in the If true box.
- Since we don’t care about any incidents that do not have a high severity, we are going to ignore the If false box. Search for the Microsoft Teams connector and select it.
- Select the Post a message (V3) (Preview) action and connect if prompted. The action will look like the following:
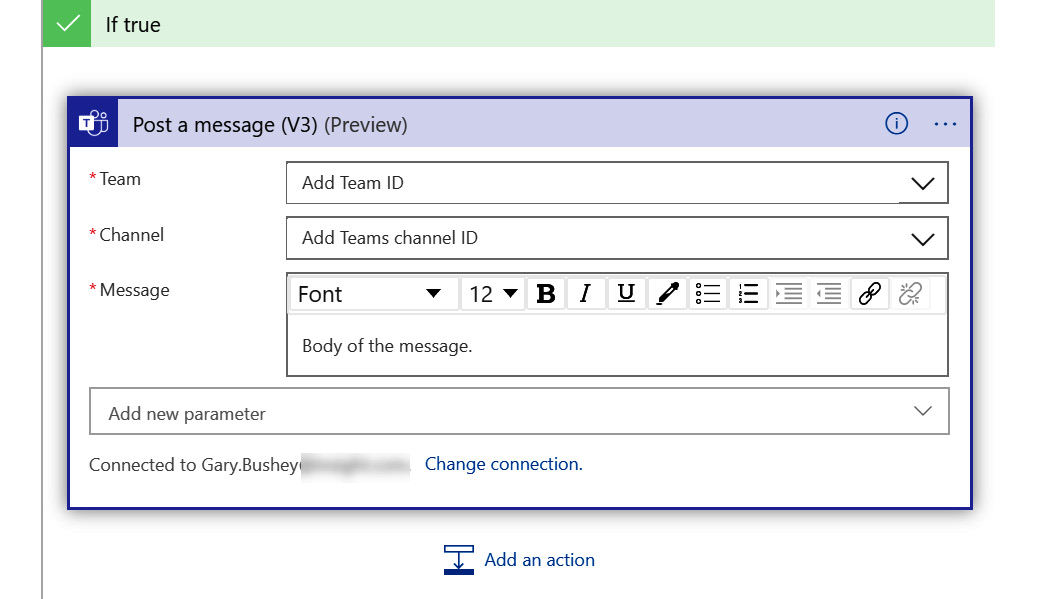
Figure 11.21 – Posting a message
- One thing that is different in this action from the others is that both the Team and Channel fields are dropdowns. The Team field will be populated with all the teams you have access to and once a team is selected, the Channel field will be populated with all the channels in that team.
- Once you have those filled in, you can fill in the Message field. This can be anything that you want. In this case, we need to tell the analysts about a new, high-severity incident, so the message should be something like A new High severity incident has been generated. Its identification number is: …, followed by the incident’s ID number.
- To do this, we are going to mix regular text and a dynamic content field. First, add the hardcoded text that was just listed and then, using the dynamic content variable listing popup, select the Number variable. You may need to expand the Alert – Get incident listing in this popup to see all the available variables.
- Once you are done, it should look like the following:
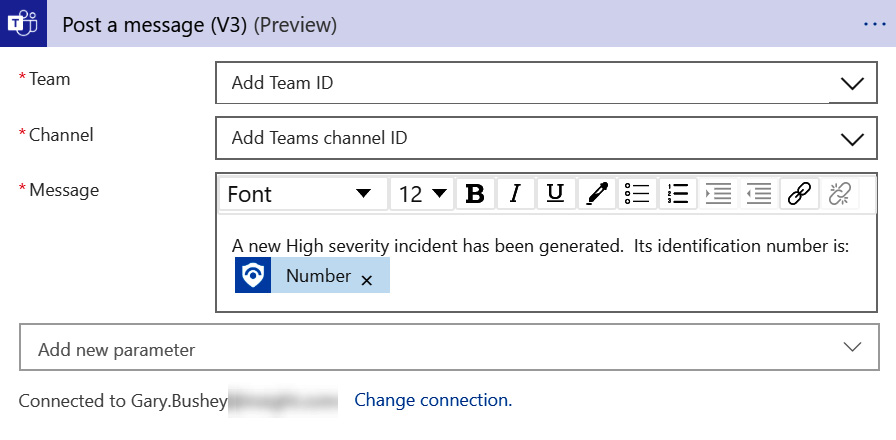
Figure 11.22 – Posting a message completed
- Once you are all done, click on the Save button in the Logic App Designer page’s header to save this playbook. If there are any errors, you will be informed about them. If not, the playbook will be saved. You will notice the Save button in the header is grayed out until new changes are made.
- As a final step, you need to attach this playbook to an alert to verify the code is working as designed. Refer back to Chapter 7, Creating Analytic Rules, for instructions on how to do this.
There you have it! A fully functional and incredibly useful Azure Sentinel playbook with no coding required. It just took some figuring out of which fields to use where. This is a very simple example but, hopefully, it will at least give you some ideas of what to use playbooks for.
Summary
In this chapter, you learned how to create a playbook that you can use in your analytic query rules to perform SOAR actions. Playbooks are based on Azure Logic Apps, with the only difference being that the Azure Sentinel connector must be used for a logic app to be a playbook.
With what you have learned, you can now create playbooks to automate a lot of actions that had to be performed manually before. You read about one such example, but there is no limit to what you can do!
In the next chapter, we will use what we learned in this chapter to build a playbook that will create a new ServiceNow ticket and update the incident with the ticket number.
Questions
Use these questions to test your knowledge of this chapter:
- What needs to be done before a logic app can be used as an Azure Sentinel playbook?
- What needs to be done before a logic app can be used as an Azure Sentinel playbook?
- How can I tell whether a specific playbook was successful the last time it ran?
- In a playbook’s workflow, how can I get information regarding an incident?
- What is dynamic content?
- Can I combine dynamic and static content in one field?
Further reading
- Logic Apps overview: https://docs.microsoft.com/en-us/azure/logic-apps/logic-apps-overview
- Connectors for Azure Logic Apps: https://docs.microsoft.com/en-us/azure/connectors/apis-list
- Sample Azure Logic Apps: https://docs.microsoft.com/en-us/samples/browse/?products=azure-logic-apps
- Sample Azure Sentinel playbooks: https://github.com/Azure/Azure-Sentinel/tree/master/Playbooks
- Testing logic apps with mock data but setting up static results: https://docs.microsoft.com/en-us/azure/logic-apps/test-logic-apps-mock-data-static-results