Chapter 2: Azure Monitor – Log Analytics
In this chapter, we will explore the Azure Monitor Log Analytics platform, which is used to store all the log data that will be analyzed by Azure Sentinel. This is the first component that needs to be designed and configured when implementing Azure Sentinel, and will require some ongoing maintenance to configure the data storage options and control costs of the solution.
This chapter will also explain how to create a new workspace using the Azure portal, PowerShell, and the CLI. Once a workspace has been created, we will learn how to attach various resources to it so that information can be gathered, and we will explore the other navigation menu options.
By the end of this chapter you will know how to set up a new workspace, connect to resources to gather data, enable Azure Sentinel for data analysis, and configure some of the advanced features to ensure security and cost management.
We will cover the following topics in this chapter:
- Introduction to Azure Monitor Log Analytics
- Planning a workspace
- Creating a workspace
- Managing permissions of the workspace
- Enabling Azure Sentinel
- Exploring the Azure Sentinel Overview page
- Connecting your first data source
- Advanced settings for Log Analytics
Technical requirements
Before you start creating Log Analytics workspaces and using Azure Sentinel, you will need to set up an Azure tenant and subscription. It does not matter what type of Azure tenant you have, just as long as you have one that you can use. If you do not have access to an Azure tenant, you can set up a free trial by following the instructions at https://azure.microsoft.com/en-us/free/.
Once you have a tenant, you will need a subscription as well, if there is not one that you can use already. Depending on the type of Azure tenant you have access to, you may need to contact someone else to create the subscription. If you need help creating a new subscription, go to https://docs.microsoft.com/en-us/azure/active-directory/fundamentals/active-directory-how-subscriptions-associated-directory.
Introduction to Azure Monitor Log Analytics
Azure Monitor is the name of a suite of solutions built within the Azure platform to collect logs and metrics, then use that information to create insights, visualizations, and automated responses. Log Analytics is one of the main services, created to analyze the logs gathered. The platform supports near real-time scenarios, is automatically scaled, and is available to multiple services across Azure (including Azure Sentinel). Using a version of the Kusto Query Language (KQL), the query language used to obtain information from logs, complex information can be queried quickly and the queries are saved for future use. In this book, we will refer to this service simply as Log Analytics.
In order to create a Log Analytics workspace, you must first have an Azure subscription. Each subscription is based on a specific geographic location that ties the data storage to that region. The region selection is decided based on where you want your data to be stored; consider the distance between the source data and the Azure data center (region), alongside the legal requirements for data sovereignty requirements for your organization. The selection of the region will also impact the costs associated with both Log Analytics and Azure Sentinel.
Each workspace has its own separate data repository, and each can be configured uniquely to meet the business and technical requirements for security, governance, and cost management. Azure Sentinel can only be enabled to use a single Log Analytics workspace; we therefore recommend that you centralize all your security logs to a dedicated central workspace. If your organization requires you to create more than one location for your data for the legal or technical requirements mentioned before, then you will need to run multiple instances of Azure Sentinel (one per Log Analytics workspace), and each instance would need to be monitored, in which case you should consider the deployment of Azure Lighthouse.
Azure Lighthouse
Microsoft has addressed the need to manage multiple Azure subscriptions and resources in a centralized console. This is usually deployed by managed service providers who have multiple customers, although it may also be used by organizations with complex requirements and who have deployed multiple Azure subscriptions. Azure Sentinel is now a supported resource for this portal, and more features are expected to be added in time to ensure strong parity for directly interacting with Azure Sentinel.
The following diagram shows how Log Analytics workspaces relate to the rest of Azure. Each workspace resides in a single resource group, although there can be multiple workspaces in a single resource group and most likely other Azure resources. Each resource group belongs to a single subscription, and each subscription belongs to a single Azure Tenant. There can be, and usually are, multiple resource groups in a subscription, and many companies will have multiple subscriptions in a tenant:
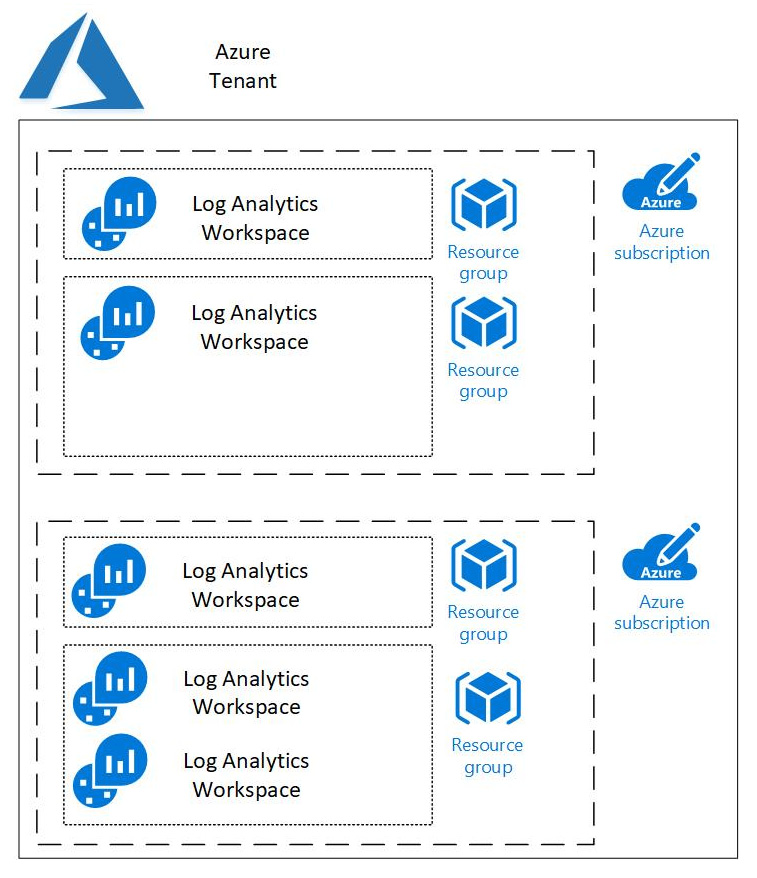
Figure 2.1 – Azure Tenant for Log Analytics
Once created, a workspace can be used to gather information from many different sources, including the following:
- Azure resources in the same subscription
- Azure resources in different subscriptions
- Data from other cloud services (such as Amazon Web Services, and Google Cloud Platform)
- Data from your private data center (on-premises or third-party hosted)
- Data from on-premises resources (via secure internet connections)
- Data from IoT and industrial control systems
To protect the data collected, security and compliance standards are built into this solution; the Log Analytics service manages your data in a secure cloud data repository and ensures the data is secured with multiple layers of protection, including the following:
- Data segregation and isolation, with geographic sovereignty
- Data retention and deletion policies, per data source type
- Internationally certified standards for physical security, inherited from the Azure subscription (commercial and government)
- Microsoft-managed incident management processes
- Certified conformity to multiple compliance and regulatory standards
- Secure channels for sending data to Log Analytics; certificate-based authentication, and SSL via port 443
- Workspace and role-based access permissions, managed by the customer; more details later in this chapter
For more information on the way data is secured, we recommend reading the official Microsoft documentation: https://docs.microsoft.com/en-us/azure/azure-monitor/platform/data-security.
Planning a workspace
While it is easy to just go and create a workspace, it is better to plan out the workspace configuration beforehand to avoid having to perform rework later. Some of the aspects to take into account include the following:
- The name of the workspace: This must be unique across all of Azure. It should be descriptive enough to show what service this workspace provides just by looking at the name. It is recommended that your company and the word Sentinel are used in the name.
If this raises concerns that the name will make it a bigger target for bad actors, use whatever naming convention makes sense and meets corporate standards. Just remember that it must be unique across all of Azure. That name must also be between 4 and 64 letters, digits, and - should not be the first or last character.
- The subscription the workspace belongs to: It is recommended that a separate subscription is created just for Azure Sentinel use in order to limit access to it. If this is not feasible, choose an appropriate subscription to use.
- The location of the workspace: The workspace should reside in the same location as the resources feeding it in order to prevent egress charges that would occur if you send the data from one location to another. Large companies will most likely have resources in many different locations, in which case it would make sense to use the location that has the most resources and has the lowest price for the workspace. Keep in mind that there may be laws in place that denote where the data must reside.
For more information on Log Analytics pricing, see https://azure.microsoft.com/en-us/pricing/details/monitor.
- Which resource group will the workspace reside in: It is recommended that all the Azure Sentinel resources reside in the same resource group, although that is not a hard and fast rule. If it makes more sense to have all your workspaces in one resource group, Azure Sentinel in another, and the workbooks in a third resource group, then do that. It will not affect the performance of Azure Sentinel at all.
- Which pricing tier to use: If the subscription being used to house the workspace has had a workspace created in it before April 2, 2018, or if the subscription is part of an Enterprise Agreement that was in place prior to February 1, 2019, it will continue to be able to access the legacy pricing tiers. Otherwise, only Per GB (2018) is allowed and data is charged for ingestion and retention per GB. The legacy options are:
a) Free: There is no charge for the data being ingested, although there is a 500 MB daily limit and the data is retained for only 7 days. This can only be used for lab and research purposes.
b) Standalone (Per GB): This is the same as Per GB (2018).
c) Per Node (OMS): Use this one if OMS E1 Suite, OMS E2 Suite, or OMS Add-On for System Center has been purchased to use the authorization that came from those purchases.
Planning your workspace before you create it is very important. Making sure to select a unique and meaningful name, the proper location to avoid egress charges, the correct resource group, and other decisions before deploying will save you frustration or complete rework later.
Creating a workspace using the portal
This section will describe how to create the Log Analytics workspace using the Azure portal website. This is a graphical representation of the PowerShell and CLI commands discussed later, and as such may be the easiest way to start working with workspaces:
- In the Azure portal, enter Log Analytics workspaces into the search bar at the top of the screen. This will show a list of services that are related to the search term entered. Locate and click on the Log Analytics workspaces link.
- Click the Add button to create a new workspace:
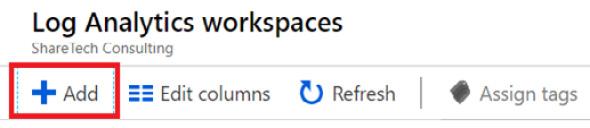
Figure 2.2 – Create a new Log Analytics workspace
- Enter the required values in the new blade:
a) Enter the name for the workspace.
b) Select a Subscription where this will reside.
c) Choose the Resource group for this workspace.
d) Select the Location where this workspace will reside.
e) For the Pricing tier, Per GB (2018) will automatically be selected.
The blade will look something like this:
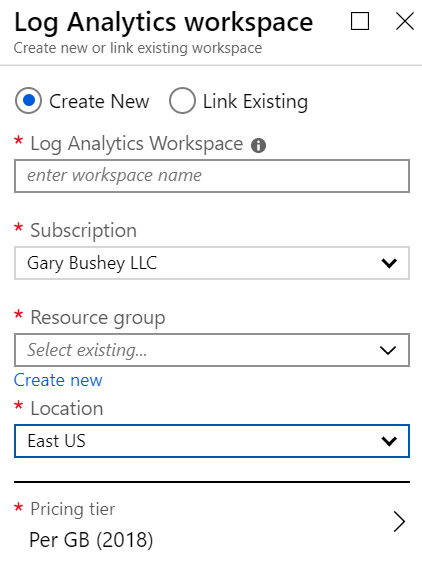
Figure 2.3 – Log Analytics workspace options
- When all the values have been filled in, click the OK button at the bottom of the screen to continue. Even though the button will change to say Validating, it is also creating the workspace in the background.
- Once the workspace has been created, you will be taken back to the listing of all the workspaces. You may need to refresh this listing to see your new workspace.
That is all there is to creating a workspace using the Azure portal. While this is very easy to do, there may be times when you will want to perform these same actions using command-line actions, and that will be described next.
Creating a workspace using PowerShell or the CLI
There are times when you need to be able to consistently recreate an Azure Sentinel environment. Perhaps you are just testing all the various configuration options, creating environments for many different subscriptions for an international company, or creating instances for customers. No matter the reason, if you need to create many Azure Sentinel environments that are all the same, using PowerShell or the Command-Line Interface (CLI) is a better option than doing it in the Azure portal.
Creating an Azure Resource Management template
When creating a new Log Analytics workspace using PowerShell in this lab, you will use an Azure Resource Management (ARM) template to perform the actual configuration. While you can create the workspace directly using either technology, using an ARM template provides additional benefits, including being able to easily recreate the workspace, using the ARM template in a DevOps workflow, or using it in Azure Blueprints.
Note
A complete discussion of ARM templates is beyond the scope of this lab, but briefly, an ARM template is a JSON file that describes what needs to be created in Azure. It contains parameters, which are the values that a user will provide to determine items such as name, location, and pricing tier. It can also have variables, which are internal values that can be used to determine other values. It will also have a list of one or more resources, which are the Azure resources to create.
Go to https://docs.microsoft.com/en-us/azure/azure-monitor/platform/template-workspace-configuration and copy the JSON text. You will be pasting this into a file that you create later.
In this example, you will be prompted for the workspace name and the location, but the pricing tier will default to pergb2018 due to the presence of a defaultValue entry. If you do not wish to have those defaults, you can either change the values shown or remove the entire defaultValue line, including the comma at the end, in which case you will be prompted for the values when executing the command.
While JSON is just text, so you can use a program such as Notepad to view it, it is recommended that you use something like Visual Studio or Visual Studio Code, which provides options including color coding and showing available commands. We will be using a version of Visual Studio Code in the Azure portal for this lab.
In your Azure portal, click on the Cloud Shell icon in the top right-hand corner of the screen:

Figure 2.4 – Launching the Cloud Shell
If prompted, select the subscription you are currently using for Azure Sentinel and then click Create Storage. This will only have to be done once, so if you have used the Cloud Shell before you will not be prompted for this.
At the bottom of the screen will be the Cloud Shell, which should look like the following screenshot. The text may not match exactly what is shown:
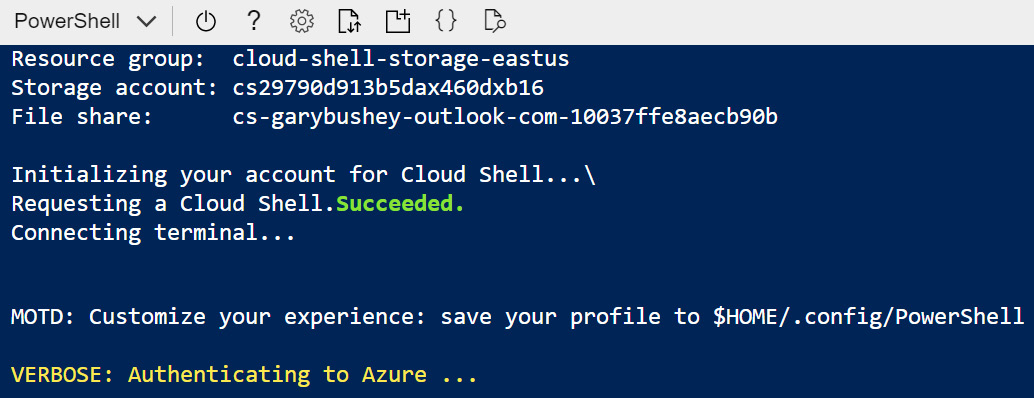
Figure 2.5 – Cloud Shell setup
If in the top left-hand corner it says Bash rather than PowerShell, use the dropdown to change it to PowerShell, as that will have the command we need for this lab.
Once the Cloud Shell has finished loading, enter the following:
code deployworkspacetemplate.json
This will start a version of Visual Studio code that you can use in the Cloud Shell. Type the code from the preceding example. On the right side of the screen, click on the context menu and click Save. You can then either click the X to close the editor or click on the context menu and click on Close Editor:
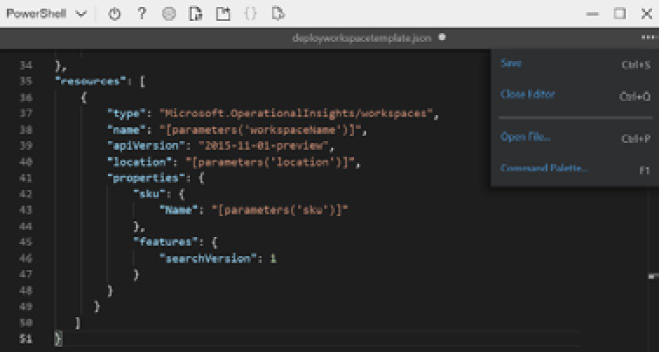
Figure 2.6 – PowerShell deployment using a JSON template
Note
If you want to run this on your own computer rather than via the Azure portal, go to https://docs.microsoft.com/en-us/powershell/azure/install-az-ps?view=azps-3.2.0 to learn how to install the Azure PowerShell module, or https://docs.microsoft.com/en-us/cli/azure/install-azure-cli?view=azure-cli-latest to install the Azure CLI module.
That is how you can use the CLI to create a new Log Analytics ARM template. This is the external file that we will be using in the following sections to create the new workspace.
Using PowerShell
PowerShell is a scripting language that can be used across various machines, including Windows and Linux computers, that was built on top of .NET. Because of this, it can accept .NET objects, making it incredibly powerful. PowerShell has many different commands, including some specifically created for working with Azure, which will be used here.
Note
You may not have the Azure PowerShell module loaded on your local computer. To install it, follow the instructions located at https://docs.microsoft.com/en-us/powershell/azure/install-az-ps?view=azps-3.5.0
Follow these steps to create a new workspace using PowerShell:
- Determine in which resource group the workspace will reside. If you have one already created, skip to step 3.
- To create a new resource group, run this command:
New-AzResourceGroup -Name <resource-group-name> -Location <location>
Replace <resource-group-name> with the name of the new resource group and <location> with the location where the resource group will reside, such as EastUS or WestUS. If you do not know what to use for your location, run this command:
Get-AzLocation
Find the location you want and use the value listed under Location.
- Enter the following command:
New-AzResourceGroupDeployment -Name <deployment-name> -ResourceGroupName <resource-group-name> -TemplateFile $HOME/deployworkspacetemplate.json
Replace <deployment-name> with the name of this deployment. You can use something like <labworkspace>. It is not important what you enter, as this is just a placeholder name so that if you look at the resource group you can see the various deployments. Replace <resource-group-name> with the name of the resource group where the workspace will reside.
- You will be prompted for the Log Analytics workspace name as well. Enter a valid name and press Enter to continue.
- Once the command has finished running, it will show a success screen with a summary of the values used as follows:
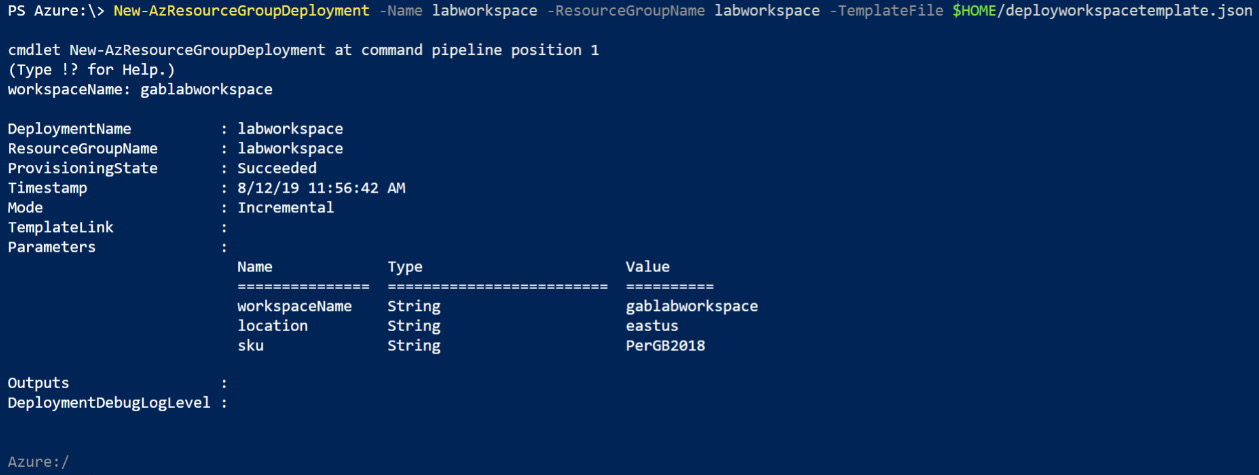
Figure 2.7 – Running New-AzResourceGroupDeployment in PowerShell
If you get an error screen, read the message, as the messages are usually quite specific as to what caused the error.
- Close the Cloud Shell session.
That is how you can create a new Log Analytics workspace using an ARM template and PowerShell. This can be preferable to using the Azure portal as it is repeatable. Next, we will look at using the Azure CLI and see how to create a new workspace without using the ARM template.
Using CLI
The Azure CLI is also a cross-platform scripting tool developed by Microsoft. Initially, it was the only tool that was cross-platform, so if you were working on a computer that was not running Windows, it was your only option. PowerShell is now cross-platform as well, so the main difference between the two is that Azure CLI can create Azure resources directly without using an ARM template.
Note
The following steps describe how to run the CLI from the Azure portal. If you want to run this on your local computer, you will need to make sure you have the CLI installed. Go to https://docs.microsoft.com/en-us/cli/azure/install-azure-cli?view=azure-cli-latest for instructions on how to perform the installation:
- Determine which resource group the workspace will reside in. If you have already created one, skip to step 3.
- To create a new resource group, run this command:
az group create --name <resource-group-name> --location <location>
- Replace <resource-group-name> with the name of the new resource group and <location> with the location where the resource group will reside, such as EastUS or WestUS. If you do not know what to use for your location, run this command:
az account list-location
- Find the location you want and use the value listed under name.
- Enter the following command:
az group deployment create --resource-group <my-resource-group> --name <my-deployment-name> --template-file deploylaworkspacetemplate.json
- Replace <deployment-name> with the name of this deployment. You can use something like <labworkspace>. It is not important what you enter, as this is just a placeholder name so that if you look at the resource group you can see the various deployments. Replace <resource-group-name> with the name of the resource group where the workspace will reside.
You will be prompted for the Log Analytics workspace name as well. Enter a valid name and press Enter to continue.
Once the command has finished running, it will show either the JSON values for this workspace as shown in the following screenshot or an error message. Note that not all the JSON is shown for brevity:
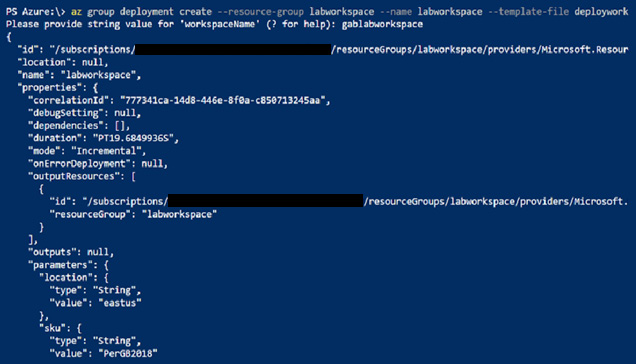
Figure 2.8 – Running az group deployment in CLI
Note that as stated earlier, you can use the Azure CLI to create the Log Analytics workspace directly using the az monitor log-analytics workspace create command. Go to https://docs.microsoft.com/en-us/cli/azure/monitor/log-analytics/workspace?view=azure-cli-latest#az-monitor-log-analytics-workspace-create for more information on this command.
- Close the Cloud Shell session.
Exploring the Overview page
No matter how you created your Log Analytics workspace, the rest of the work in this lab will be done using the Azure Portal:
- Open the portal and go to the Log Analytics solution page.
- Find your new Log Analytics workspace for Azure Sentinel and click on it. This will take you to the Overview screen, as shown in the following screenshot:
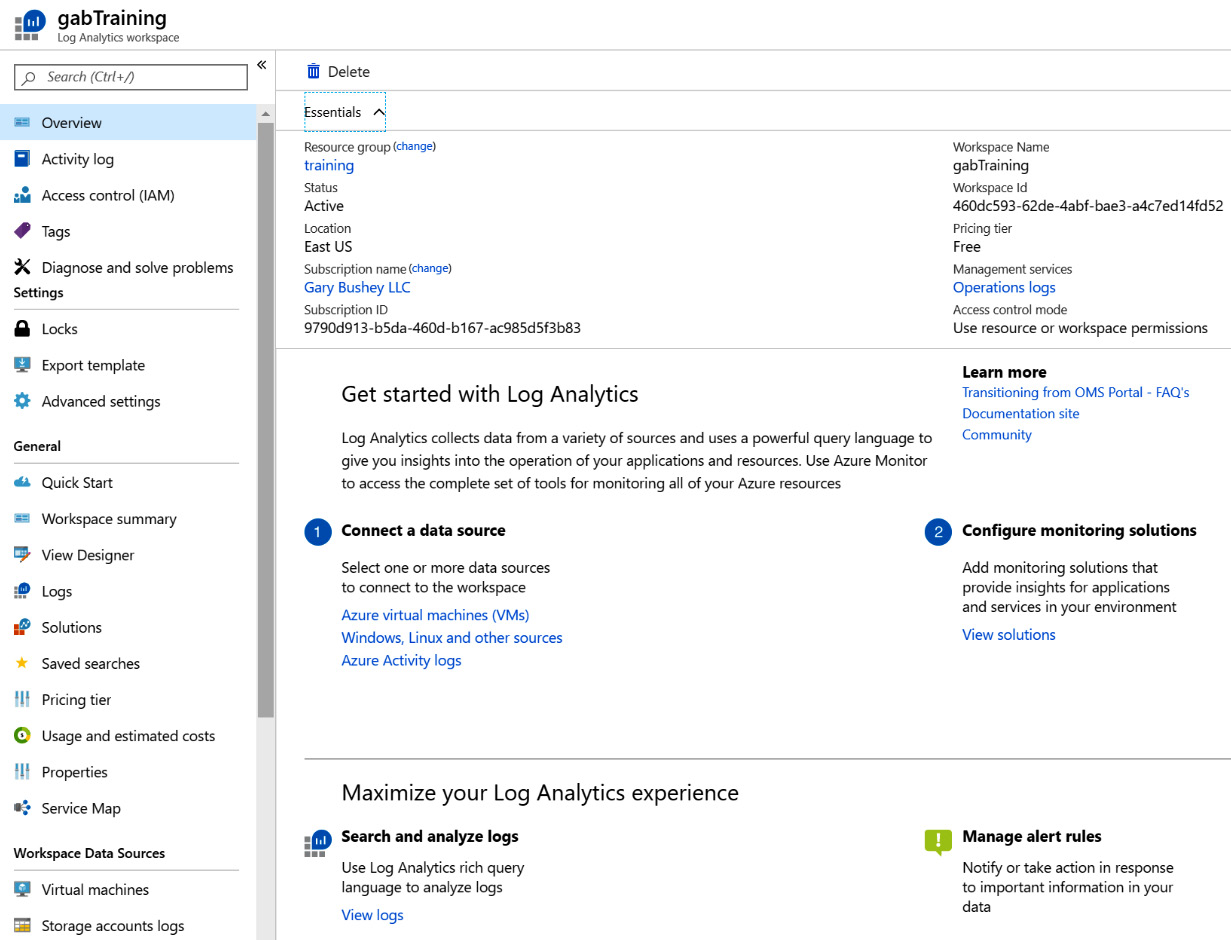
Figure 2.9 – Overview page for Log Analytics
Note that this is just a partial screen shown due to the amount of information on this page.
- Starting with the Essentials listing at the top of the page, we can review the following items:
a) Resource group: The resource group where the workspace resides. Selecting [change] will allow you to move to another resource group.
b) Status: The status of the workspace should show Active.
c) Location: The Azure location where the workspace resides.
d) Subscription name: The subscription this resource is associated with. Selecting [change] will allow you to move to another subscription.
e) Subscription ID: The unique GUID for the preceding subscription, which is useful when calling Microsoft for technical support.
f) Workspace name: The name of the Log Analytics workspace.
g) Workspace ID: The GUID for the workspace, which is also useful when calling Microsoft for technical support.
h) Pricing tier: The pricing tier for the workspace.
i) Management services: View the activity log for the workspace.
j) Access control mode: How users are granted permission to access the information in this workspace. See the following section for more information.
The previous sections described the various ways that you can create a new Log Analytics workspace to use with Azure Sentinel. This can be done either through the Azure portal or programmatically using either PowerShell or CLI commands. Once the workspace has been created, we next need to ensure access is restricted to only those users that need to access it.
Managing the permissions of the workspace
Before we connect and store data in the workspace and enable Azure Sentinel to carry out analytics on the data, let’s review the options to secure access to this new resource. Azure provides three main levels of access to resources:
- Owner: Highest level of access to resources
- Contributor: Can create and modify resources, but cannot grant or revoke access
- Reader: Can view all resources
These permissions can be granted at four different levels:
- Subscription: Highest level of access, applies to all resources within the subscription
- Resource group: Applies to the specific resource group, which may contain multiple workspaces
- Workspace: Applies only to the specific workspace
- Table level RBAC: Applies to individual tables within the log
Table Level RBAC
While there is no user interface available to set permissions on individual tables within the log, you can create Azure custom roles to set these permissions. See https://docs.microsoft.com/en-us/azure/azure-monitor/platform/manage-access#table-level-rbac for more information on how to do this.
Permissions can be applied using built-in roles, or you can make a custom role for specific access if you need to be more granular. To make this simpler, there are several built-in user roles we recommend you use to manage access to Log Analytics for the purpose of using Azure Sentinel, and we recommend you apply these to the specific resource group used for Azure Sentinel:
- Engineers developing new queries and data connectors:
a) Azure Sentinel Contributor: Provides the ability to create and edit dashboards, analytics rules, and other Azure Sentinel resources
b) Log Analytics Reader: Provides read-only visibility to all Azure resources and Azure Sentinel logs
- Analysts running daily operations:
a) Azure Sentinel Responder: Provides the ability to manage incidents, view data, workbooks, and other Azure Sentinel resources
b) Log Analytics Reader: Provides read-only visibility to all Azure resources and Azure Sentinel logs
If additional permissions are required, keep to the idea of providing the minimal permissions and applying only to the specific resources required. It may take some trial and error to get the right outcome, but it is a safer option than providing broad and excessive permissions. For further information, please take a look at the following article: https://docs.microsoft.com/en-us/azure/azure-monitor/platform/manage-access.
Enabling Azure Sentinel
Once you have created a Log Analytics workspace that you want to use with Azure Sentinel, it is very easy to attach it to Azure Sentinel:
- If you do not have Azure Sentinel enabled for your tenant, sign into the Azure portal, enter Azure Sentinel in the search box, and select the Azure Sentinel entry, as shown here:
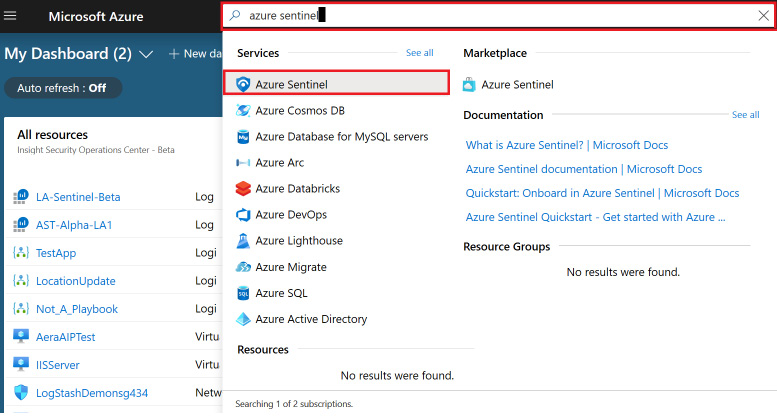
Figure 2.10 – Launch Azure Sentinel
- Click the Add button to add a workspace to Azure Sentinel:
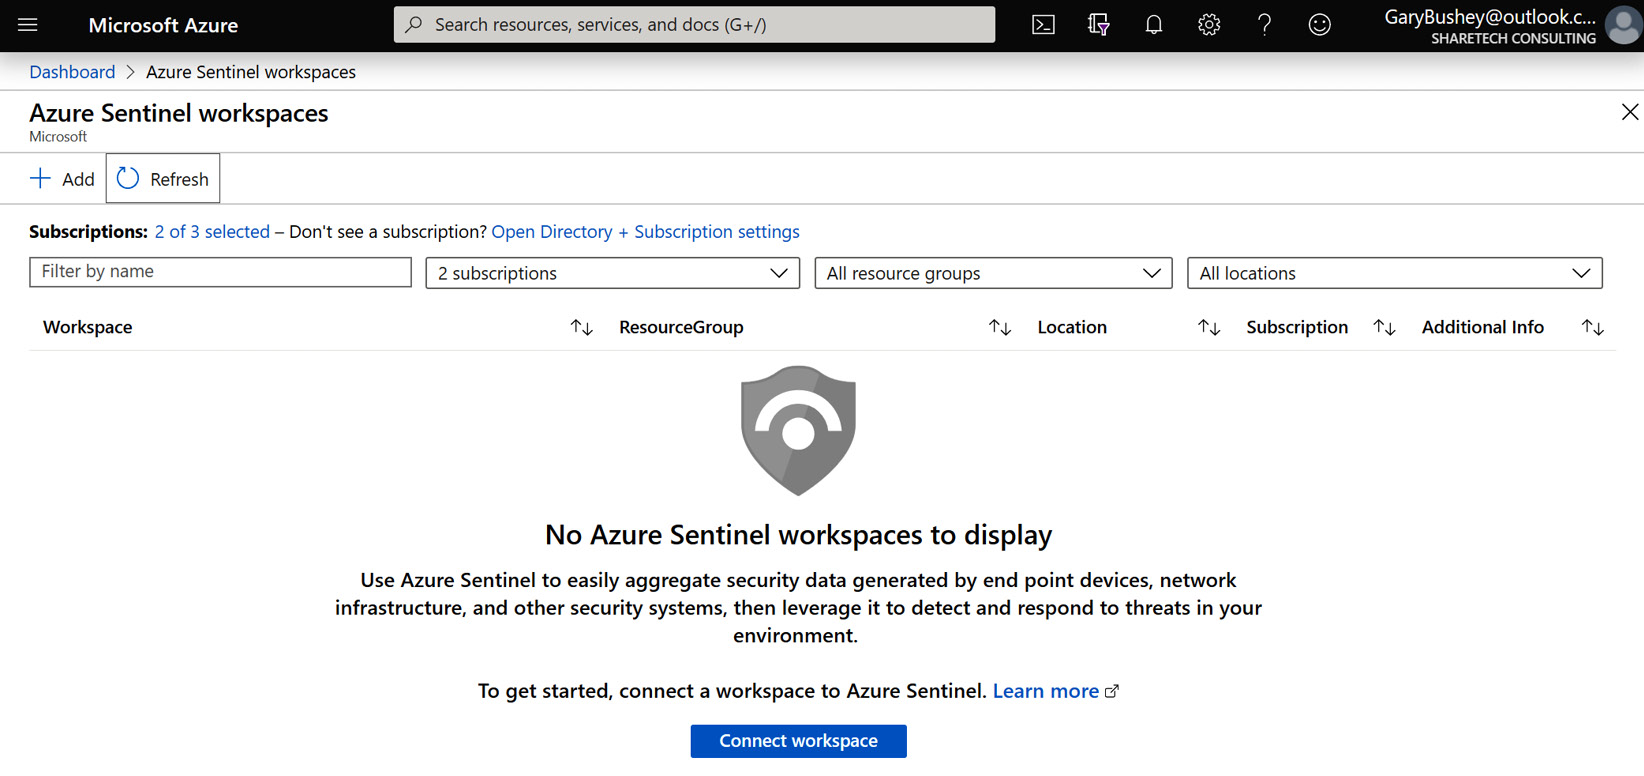
Figure 2.11 – Add workspace to Azure Sentinel
- Select the workspace from the list provided, or click Create a new workspace to add a new workspace using the instructions listed previously and then select it. Click the Add Azure Sentinel button at the bottom of the screen to continue:
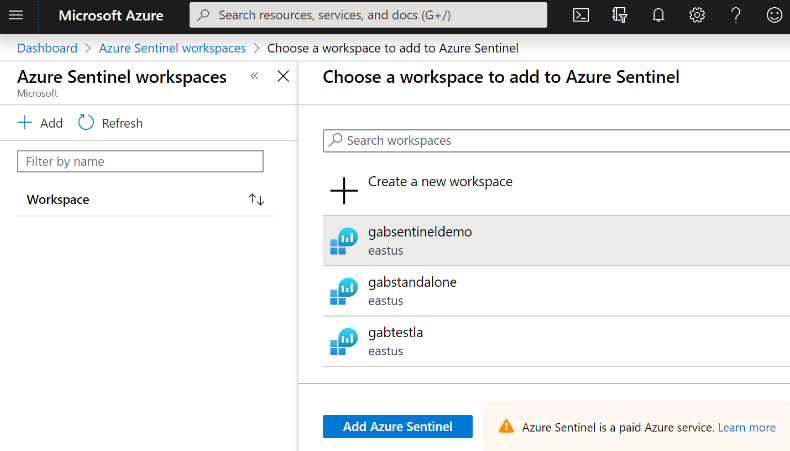
Figure 2.12 – Choose a workspace
- Once the workspace has been created, you will be taken to the News & guides page of Azure Sentinel. This page will show some simple instructions on how to set up the workspace. See the following section next for more information:
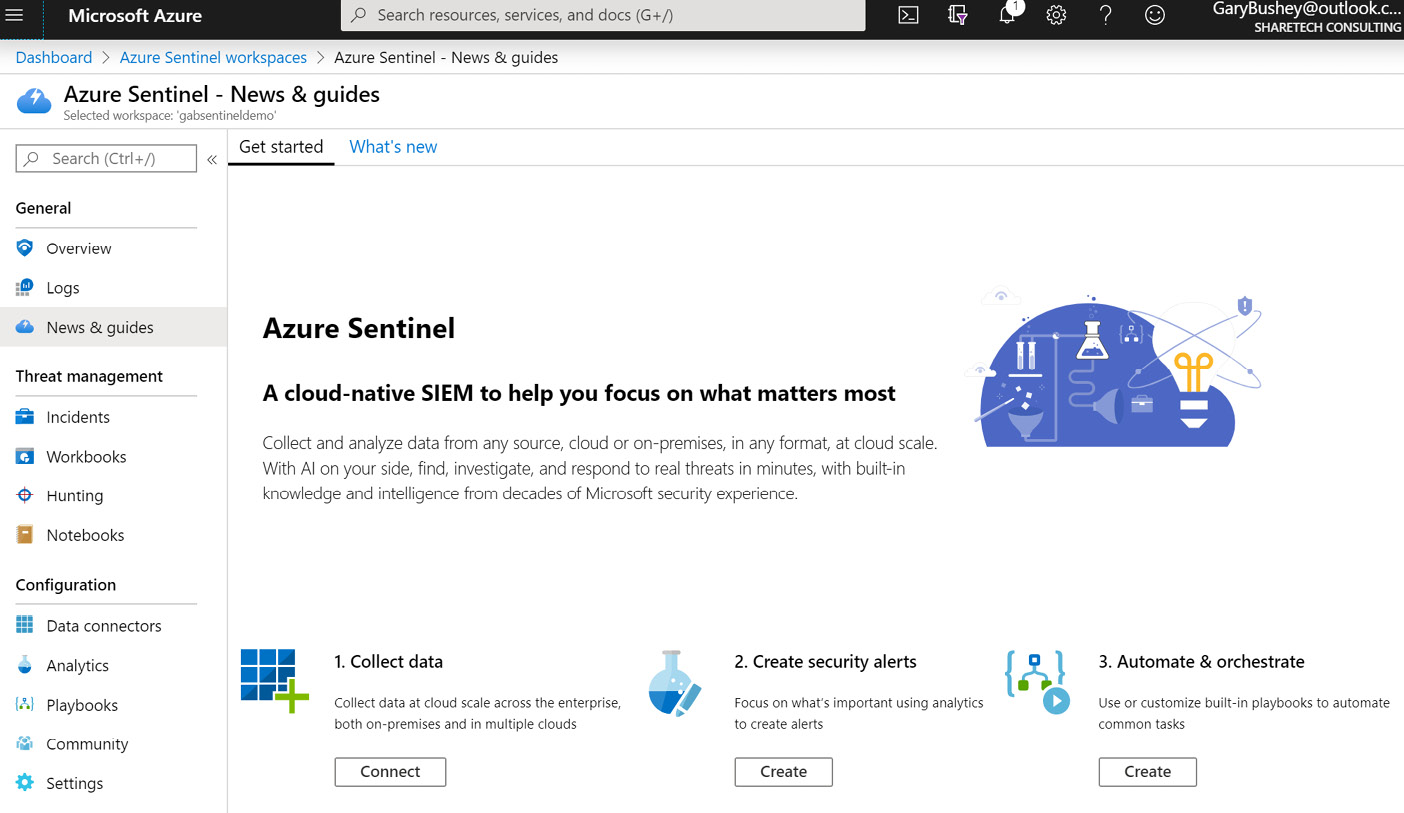
Figure 2.13 – Azure Sentinel News & guides page
Congratulations! You now have your Azure Sentinel environment created and ready to go. While the News & guides page is where you will go automatically after attaching a Log Analytics workspace to Azure Sentinel, if you leave Azure Sentinel and go back to it, you will automatically go to the Azure Sentinel Overview page which is described next.
Exploring the Azure Sentinel Overview page
The Azure Sentinel Overview page is the page that you will automatically go to when entering Azure Sentinel after you have associated the Log Analytics workspace with it. This page provides a general overview of the information in your Azure Sentinel environment and will look like the following screenshot. The actual numbers and data being shown will vary depending on your environment, of course:
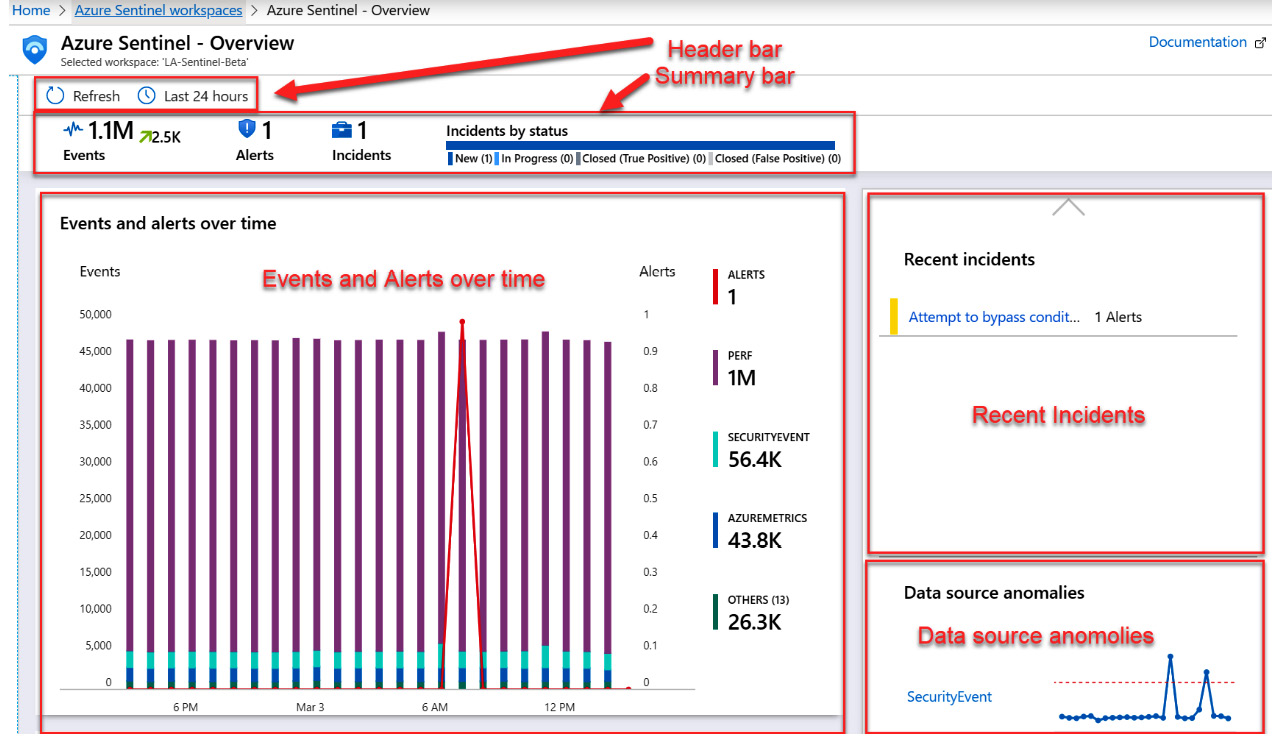
Figure 2.14 – Azure Sentinel Overview page
The page is broken up into various sections and each of these is described in the following sections.
The header bar
The header bar allows you to refresh the screen to see any updates, as well as to select how far back in time to look for the data. You can select the icon that looks like a clock to change how far back you want to look.
The summary bar
The summary bar will show you how much data has been ingested in the selected time period as well as how many alerts were raised, and the number of incidents those alerts created. In addition, the incidents are broken down by their status.
The Events and alerts over time section
This section will show the logs that have ingested the most data and the number of incidents created in the selected time frame. This is an interactive chart, so when you mouse over a specific time, the information will be filtered to show what happened at that time.
The Recent incidents section
This section will show up to the last five created incidents as well as the number of alerts that have generated the incident. You can click on the incident name to get more information about the incident.
The Data source anomalies section
This section will show up to two different data sources that Azure Sentinel’s Machine Learning has determined contain anomalies. You can click on the log name to get more information about the anomaly.
The Potential malicious events section
This section, not shown, will show an interactive map where any potential malicious events will be highlighted. You can zoom into the map to get a very precise indication of where the event occurred.
The Democratize ML for your SecOps section
This section, not shown, provides some general information on Azure Sentinel’s use of Machine Learning and provides a link where you can obtain more information.
That is the Azure Sentinel Overview page. It is a great place to go to get an overview of what is going on in your Azure Sentinel environment and is the landing page of Azure Sentinel. While Figure 2.14 shows lots of data, when you first create a Log Analytics workspace, it will be empty. The next section will explain how to start getting data into your workspace.
Connecting your first data source
Before we dig into the details of the Azure Sentinel data connectors (see Chapter 3, Data Collection and Management), we will review how Log Analytics enables connectivity to a range of different sources in order to receive data to store and analyze. Some of the data source options include the following:
- Application and operating system diagnostics
- Virtual machine log data
- Azure storage account logs
- Azure Activity log
- Other Azure resources
In this section, we will show you how you can enable log collection from Azure virtual machines.
Obtaining information from Azure virtual machines
To have the virtual machines (VMs) populate a Log Analytics workspace, they need to be connected to it. This is done from the Log Analytics workspace Overview page.
There are two different ways to get to this page. First, you can select Log Analytics in the Azure portal navigation menu and then select the appropriate workspace. The second, and perhaps easier, way is to select Settings from the Azure Sentinel navigation menu and then select Workspace settings from the menus at the top of the page, as shown in the following screenshot:
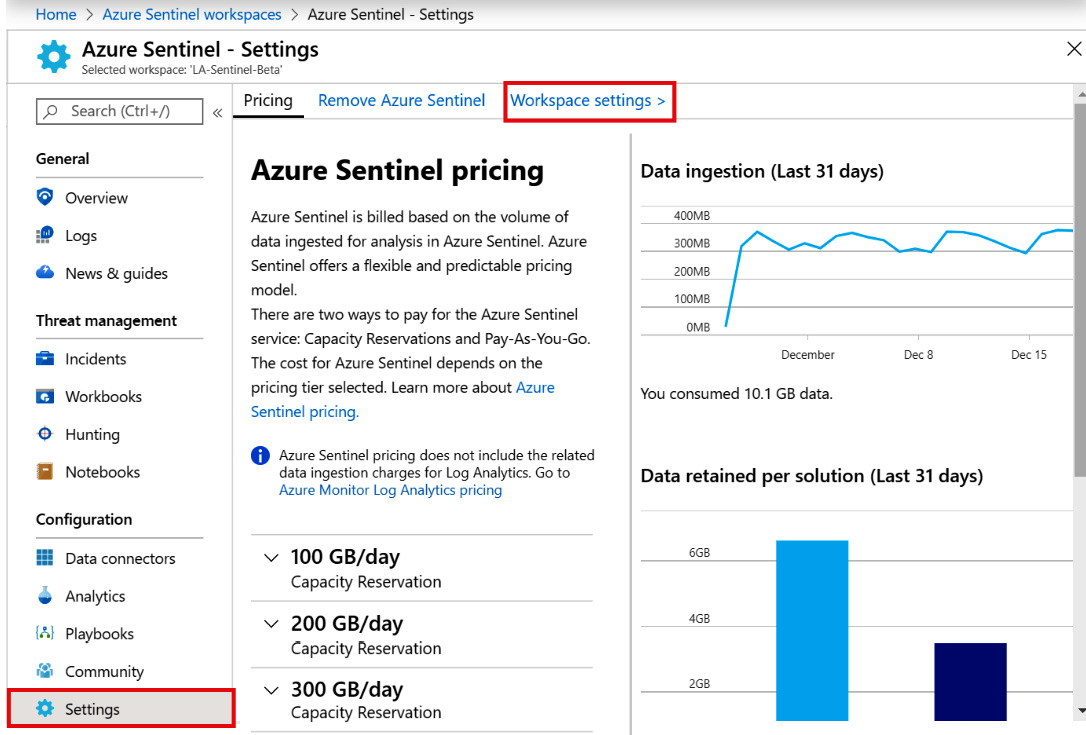
Figure 2.15 – Azure Sentinel Settings
No matter which method you use to get to the page, it will look similar to the following screenshot:
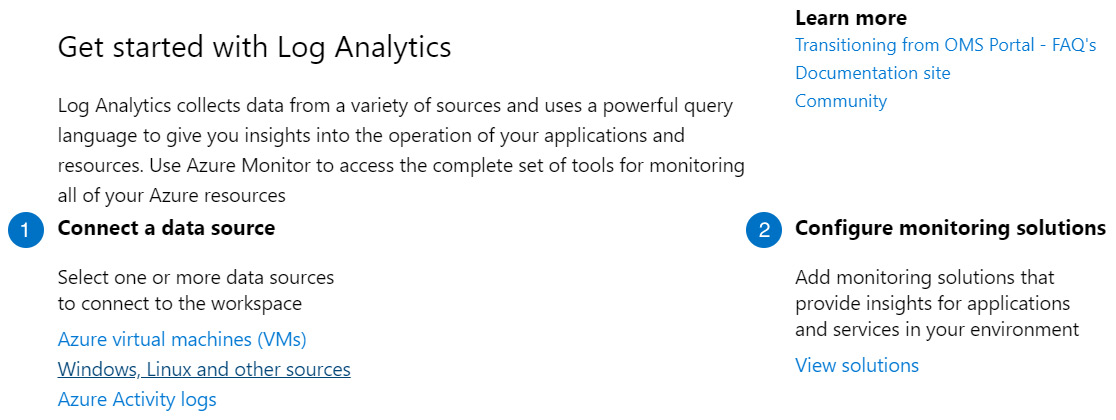
Figure 2.16 – Log Analytics Overview Page
Under Connect a data source in the Get started with Log Analytics section, select Azure virtual machines (VMs). This will take you to the Virtual machines page, which lists each VM and shows whether it is connected, as well as the OS, subscription GUID, the resource group, and the location it belongs to. The following screenshot is an example of what this page looks like:
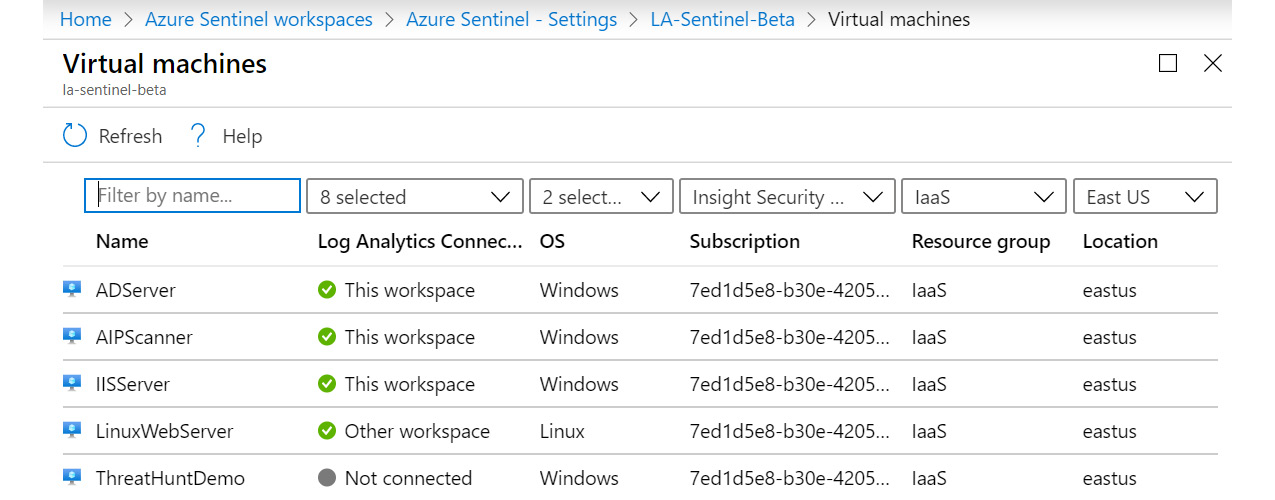
Figure 2.17 – Log Analytics – Azure Virtual machines page
You can see that the first three VMs are connected to this workspace, the fourth one, called LinuxWebServer, is connected to another workspace, and the final one, ThreatHuntDemo, is not connected to any workspace.
To change the connection status of any of the VMs, click on the row containing it. This will open a new blade, where you can either connect or disconnect the VM:
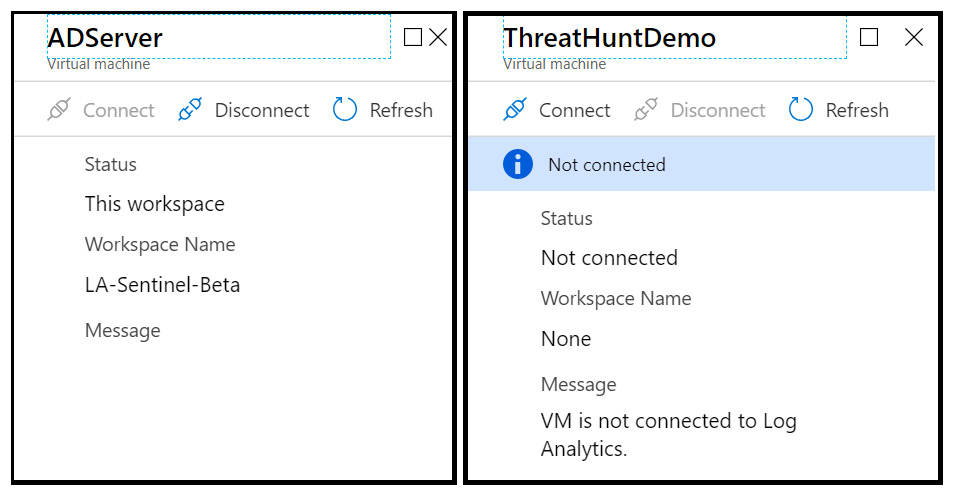
Figure 2.18 – Azure virtual machine log data connection
Select either the Disconnect or Connect link to perform the action you desire.
Connecting a VM to a Log Analytics workspace downloads and installs the Microsoft Monitoring Agent to the VM, so this step can be performed automatically when provisioning the VM using tools such as PowerShell Desired State Configuration. However, the actual steps to perform this task are beyond the scope of this book.
In a large-scale deployment, especially with VMs that are not hosted in Azure, you may not want each individual server directly sending their logs to the Log Analytics workspace. Instead, you may consider deploying the Syslog/CEF connector to centralize log collection and data ingestion. Each VM would then point towards the CEF collector server instead of Log Analytics.
Advanced settings for Log Analytics
The advanced settings for Log Analytics allow you to perform actions such as connecting on-premises and other non-Azure Windows and Linux servers, Azure Storage, and System Center Management groups. You can also set what information to import from Windows and Linux servers, import IIS Logs and Syslog events, and add custom logs and fields. Finally, you can create groups of computers, or use groups already created in Active Directory, Windows Server Update Service (WSUS), and SCCM, which can be used in your queries.
To get to the Advanced settings page, follow the instructions to get the Log Analytics Overview page in the previous section and instead of selecting Azure virtual machines (VMs), select Windows, Linux and other sources. This will open a new page as shown in the following screenshot:
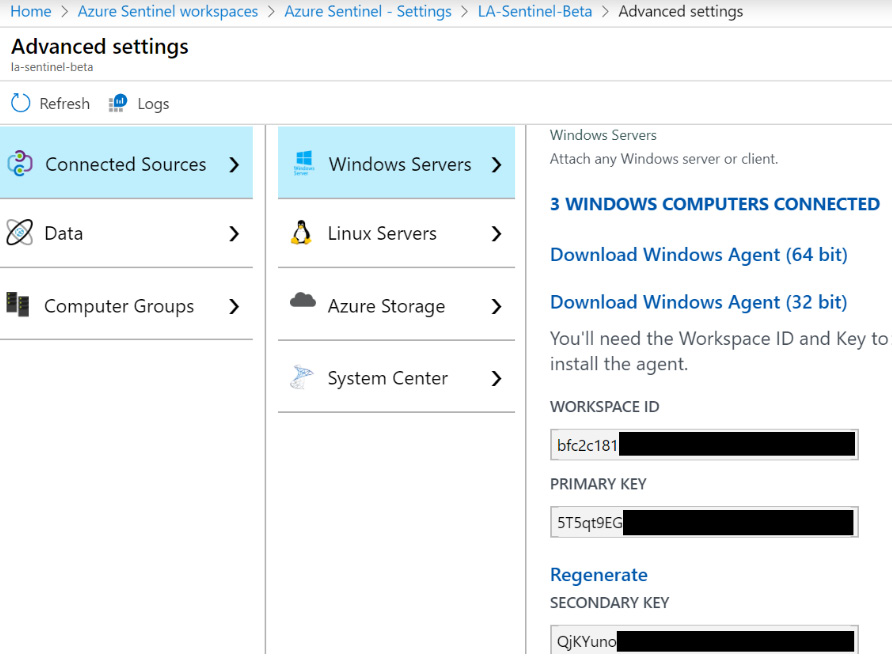
Figure 2.19 – Azure Sentinel Advanced Settings – Connected Sources
As you can see, there are various menu options that will allow you to connect to various servers, determine what data to ingest, and help with querying the data that these servers provide. Each one will be discussed in the next section.
Connected Sources
This area allows you to attach non-Azure Windows and Linux servers, Azure Storage, and System Center Operations Manager:
- Windows Servers: This section allows you to attach a non-Azure Windows based VM to the workspace. Click on either Download Windows Agent (64bit) or Download Windows Agent (32bit) to match the Windows version you are using and run the program on the server. Copy the Workspace ID and either the Primary or Secondary key and fill them in when asked.
- Linux Servers: This works the same as the Windows Server, except there is also a listing for a wget command that will download and install the application without needing any user interaction.
Note
While this can be used to connect Azure VMs, it is far easier to use the steps in the previous section to do so.
- Azure Storage: This will list the number of Azure Storage accounts connected and provides a link to documentation explaining how to connect to the Storage account. This will need to be performed from the Storage account and cannot be done here.
- System Center: This allows us to connect System Center Operations Manager management groups or the entire deployment to your workspace with a few clicks rather than having to connect each server individually.
The Connected Sources area shows you how to connect to on-premises servers as well as Azure Storage and System Center Manager groups. Next, we will look at the Data menu, which will tell Azure Sentinel what information from those servers to ingest.
The Data option
This area allows you to determine which data from connected servers will be imported. Selecting the Data option will show you the following page:
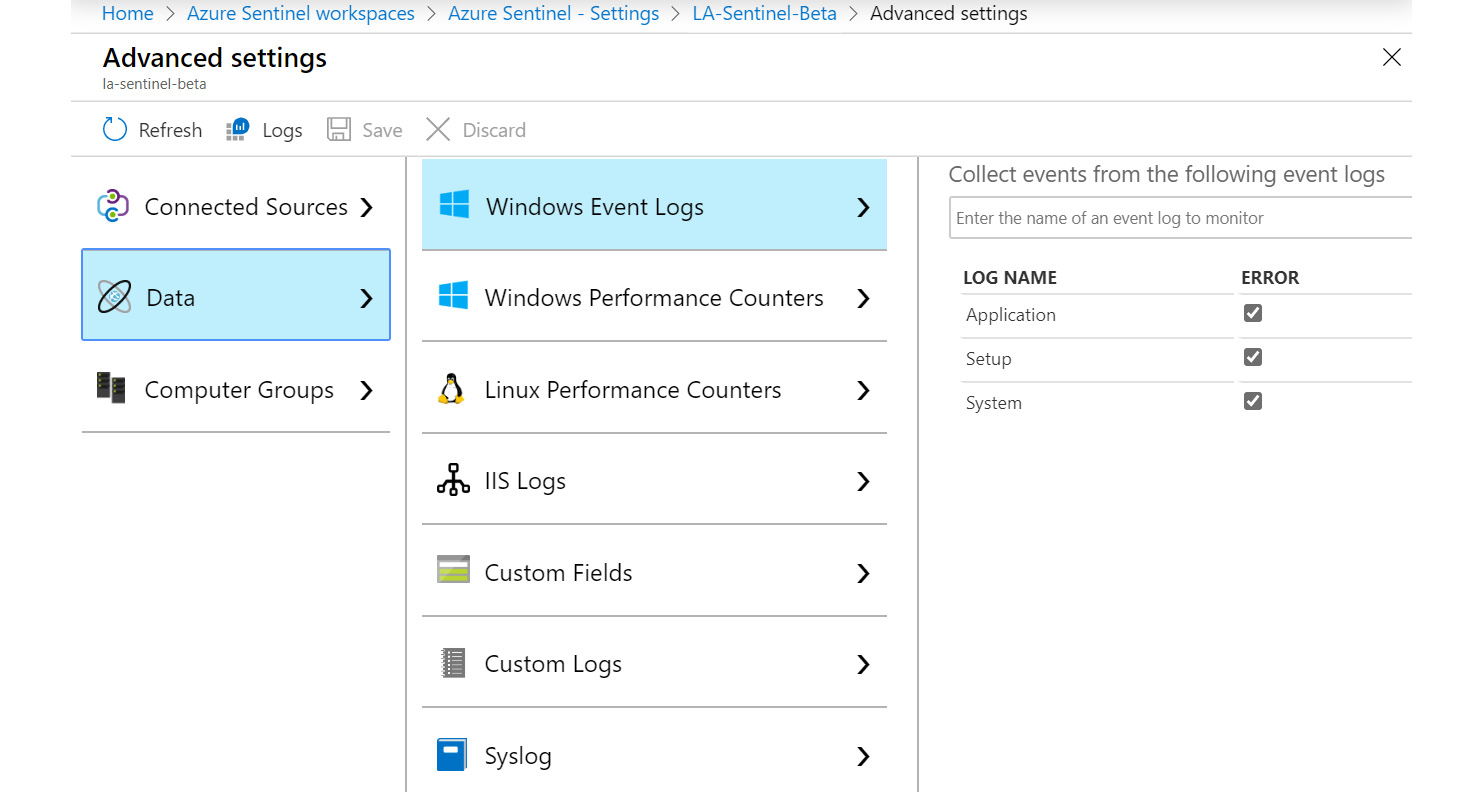
Figure 2.20 – Azure Sentinel Advanced Settings – Data
Let’s take a look at the different fields under the Data option:
- Windows Event Logs: This allows you to search for all the various logs that show up in the Windows Event viewer, including items such as the Application, Setup, and System logs, to have them included in the Log Analytics workspace. While having all this data can be handy, if there are a lot of Windows servers connected, it can lead to a large amount of data being imported. Note that the Windows Security log is not available since it will always be imported from any connected Windows server.
- Windows Performance Counters: This will show a listing of all the performance counters that will be included by default and the polling interview. From here, you can change the interview or remove the counter completely. You can also add other counters to monitor.
- Linux Performance Counters: This will show a listing of all the Linux performance counters that will be included by default and the polling interval for those counters that use a polling interval. From here, you can change the interview or remove the counter completely. You can also add other counters to monitor.
- IIS Logs: This determines if the W3C format IIS log files will be ingested from Windows web servers or not.
- Custom Fields: This shows a listing of all the custom fields that have been added, as well as the logs they belong to and their data types. Clicking on the Go to button will take you to the Log page, where a query will be shown, giving you an overview of the field. You can also remove the custom field from here.
- Custom Logs: This page allows you to add custom logs that you cannot, or do not want to, add using other data sources. An example of this is the web logs from a Linux-based web server. Go to https://docs.microsoft.com/en-us/azure/azure-monitor/platform/data-sources-custom-logs for more information on adding a custom log.
As you can see, there are a lot of ways you can configure the data to import. This will always be a tradeoff between what data you need or want and the cost of ingesting and storing the data. In the next section, we will look at Computer Groups, which can help you with your queries.
Computer Groups
This section will show all the custom computer groups that have been created and provide a way to create your own. These groups can then be used in queries. You can use these groups to create queries that reference a specific set of servers that can then be easily changed without having to change the query itself.
Selecting the Computer Groups option will show you the following screen:
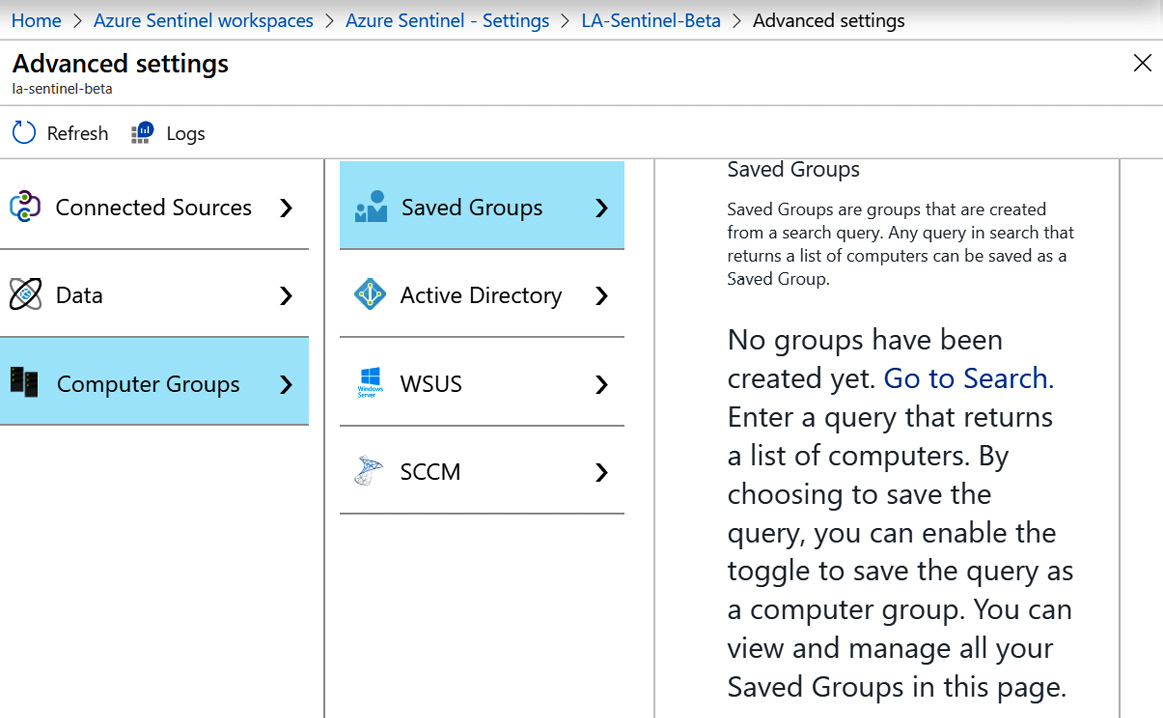
Figure 2.21 – Azure Sentinel Advanced Settings – Computer Groups
Let’s discuss the different fields under Computer Groups:
- Saved Groups: This page will show all the custom groups that have been added. It also provides instructions on creating a computer group from a query. An example of how to do this will be provided at the end of this section.
- Active Directory: Select the Import Active Directory group memberships from computers checkbox to allow groups from Active Directory to be imported. After this is enabled, it may take a few minutes before any groups show up.
- WSUS: Select the Import WSUS group memberships checkbox to allow groups from the Windows Server Update Service to be imported. After this is enabled, it may take a few minutes before any groups show up.
- SCCM: Select the Import Configuration Manager collection memberships checkbox to allow groups from SCCM to be imported. After this is enabled, it may take a few minutes before any groups show up.
There are various ways to create computer groups to help you with your queries. Each of these will be discussed in more detail in the following sections.
Adding a computer group from a query
Adding a computer group using a query involves running a query that will return a list of computers and then save that information as a computer group:
- In the Saved Groups section under Computer Groups, click on the Go to Search link to go the Logs page. Enter any query that will generate a listing of computers. Here’s an example:
Heartbeat
| where TimeGenerated > ago(30m)
| distinct Computer
Don’t worry about what the query means, it will be explained in Chapter 5, Using the Kusto Query Language (KQL). For now, this will return a listing of all the computers who have sent a heartbeat to the workspace in the last 30 minutes. Note that you will need to have a server connected to Azure (see the Obtaining information from Azure Virtual Machines and the Connected Sources sections) to get any information from this query.
- Click on the Run button to get a list of computers. If you do not get any computers returned, change 30 to a larger value until you do.
- Once you have a list, click on the Save button to save this query:
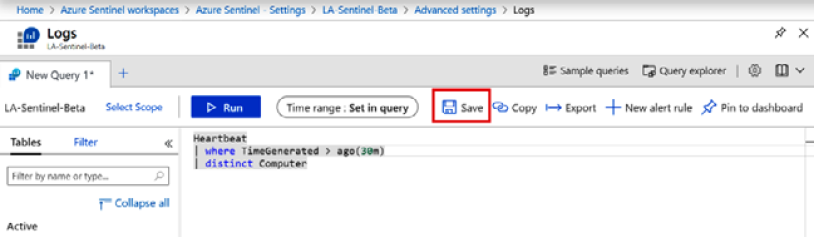
Figure 2.22 – Computer heartbeat query
This will bring up a new blade where you can enter the query information.
- Enter a descriptive name.
- Change the Save as dropdown to Function, as shown in the following screenshot:
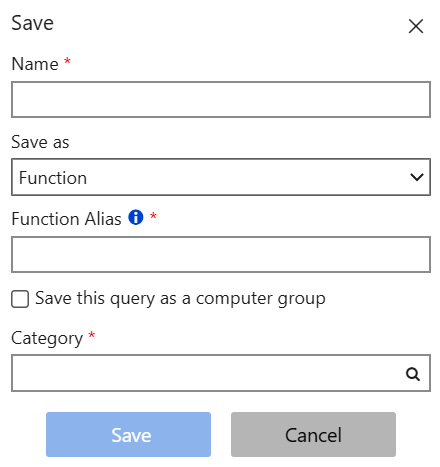
Figure 2.23 – Save query options
- Add a Function Alias, which will be used in the queries later. Make sure to check the Save this query as a computer group option, otherwise it will just save as a query that can be the same as the Name.
- Finally, add a Category, which is just used to group the computer groups together.
- Click the Save button.
When you go back to the Saved Groups page, you will see your saved group, which will look similar to what is shown in the following screenshot:
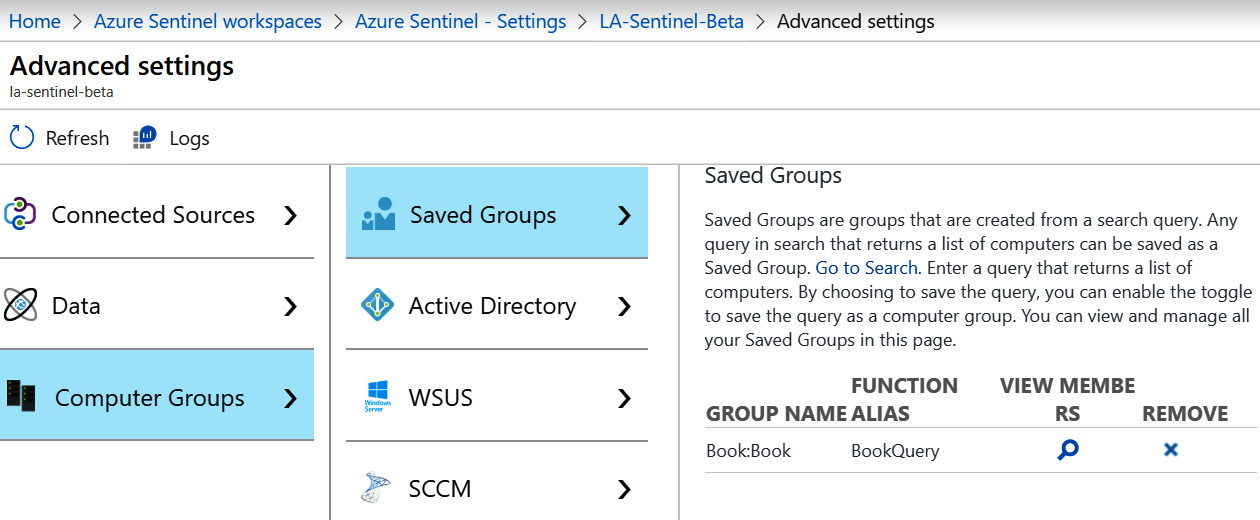
Figure 2.24 – Saved Groups
- Click on the View Members icon, which looks like a magnifying glass, to view the members of the group. It is worth noting that this group is dynamic, so based on the query in this section, the number and names of the computers that show up in the query can change.
- Click on the Remove icon, which looks like an X, to remove a saved group. You will be prompted to verify that you want to remove the saved group before the action occurs.
To use a saved group, enter a query like this:
Perf
| where Computer in (BookQuery)
Substitute BookQuery for the name of the query you just created. Again, do not worry about what this query means, it is just an example of how to use a saved group. It will make more sense after reading Chapter 5, Using the Kusto Query Language (KQL).
Summary
In this chapter, we explored the Azure Monitor Log Analytics solution, including how to create a new workspace using the Azure portal, PowerShell, or CLI, and how to configure the security options to ensure each user has the appropriate level of access. We also looked at how to connect a data source and configure some of the advanced settings. This information is very useful when you need to first configure Azure Sentinel, and in future if you need to make any changes to the Log Analytics platform supporting your operations and business needs.
In the next chapter, we will look at how to select data that is most useful for security threat hunting, which connectors to use to gather the data from any system, and the options available to enable long-term data retention while keeping costs under control.
Questions
Answer these questions to test your knowledge of this chapter:
- What is the name of the query language used in Azure Monitor Log Analytics?
- What is the purpose of Azure Lighthouse?
- Can you list three ways the data is protected in Log Analytics?
- What are the three ways to create a new Log Analytics workspace?
- What are the recommended permissions for an Engineer role?
Further reading
- Agent data sources in Azure Monitor: https://docs.microsoft.com/en-us/azure/azure-monitor/platform/agent-data-sources
- Manage access to log data and workspaces in Azure Monitor: https://docs.microsoft.com/en-us/azure/azure-monitor/platform/manage-access
- Log Analytics agent overview: https://docs.microsoft.com/en-us/azure/azure-monitor/platform/log-analytics-agent