Chapter 3: Managing and Collecting Data
One of the primary purposes of a Security Information and Event Management (SIEM) solution is to centralize the storage and analysis of security events across a diverse range of products that provide protection across your organization’s IT infrastructure. To do this, the solution needs to connect to those data sources, pull the data into a central store, and manage the life cycle of that data to ensure it is available for analysis and ongoing investigations.
In this chapter, we will review the types of data that are most interesting and useful for security operations, and then explore the functionality available to connect to multiple data sources and ingest that data into Azure Sentinel, by storing it in the Log Analytics workspace. Once the data is ingested, we need to ensure the appropriate configuration for data retention to maximize the ability to hunt for events and other security information, while also ensuring the cost of the solution is maintained at a reasonable level.
We will cover the following areas specific to data collection:
- Choosing data that matters
- Understanding connectors
- Configuring Azure Sentinel connectors
Then, we will cover these areas to ensure appropriate data management:
- Configuring Log Analytics storage options
- Calculating the cost of data ingestion and retention
- Reviewing alternative storage options
Choosing data that matters
Quality data management is critical to the success of big data analytics, which is the core basis of how a SIEM solution works. Gathering data for analysis is required in order to find security threats and unusual behavior across a vast array of infrastructure and applications. However, there needs to be a balance between capturing every possible event from all available logs and not having enough data to really find the correlating activities. Too much data will increase the signal noise associated with alert fatigue and will increase the cost of the security solution to store and analyze the information, which, in this case, is Azure Log Analytics and Azure Sentinel, but also applies to other SIEM solutions.
One of the recent shifts in the security data landscape is the introduction of multiple platforms that carry out log analysis locally and only forward relevant events on to the SIEM solution. Instead of duplicating the logs, hoping to fish relevant information from it by using a single security analysis tool (such as a SIEM solution), new security products are focused on gathering specific data and resolving threats within their own boundaries; examples include the following:
- Identity and Access Management (IAM) for continuous analysis and condition-based access, per session
- Endpoint Detection and Response (EDR) for detailed analysis on every host, with centralized analytics across devices for threat mapping and remediation
- A cloud-access security broker (CASB) for use-behavior analytics across firewalls and external cloud-based solutions
- A next-generation firewall (NGFW) for monitoring and responding to dynamic changes in behavior across internal- and external-facing networks
Note
Refer to Chapter 1, Getting Started with Azure Sentinel, for further details about each of these solutions.
Each of these solutions already gather large volumes of data from their respective data sources; therefore, there is no need to duplicate the data in the SIEM log storage. Instead, these solutions can be integrated with the SIEM solution to only send relevant and actionable information, to enable the SIEM to act as the central point of communication for analysis, alerting, and ticketing. The net result is a reduction in duplication and overall solution cost. This idea is summarized in the following screenshot:
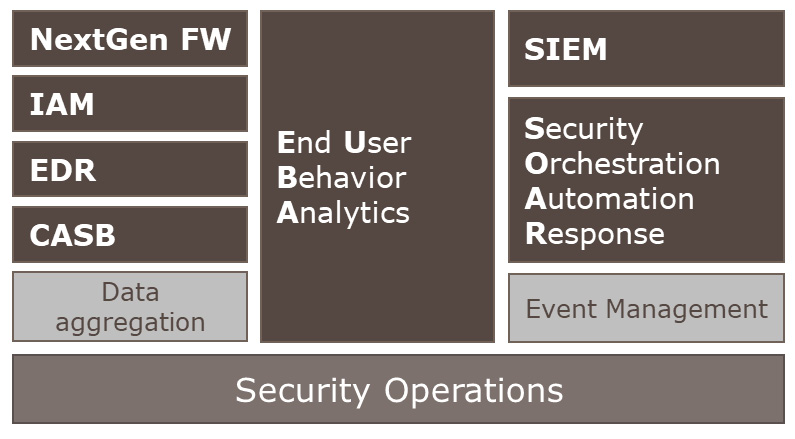
Figure 3.1 – Data for security operations
When dealing with large data volumes, we can use the 7 Vs of Big Data to guide our decisions on what is the right data to collect, based on the priorities assigned:
- Volume: This directly impacts the cost of moving and storing the data.
- Velocity: This impacts the time to respond to an event.
- Variety: Are we including every aspect of apps and infrastructure? Where are the blackspots?
- Variability: Is the information easy to understand and act upon?
- Veracity: Do we trust the source and accuracy of the data?
- Visualization: Can we use this data to create visualizations and comparisons?
- Value: Consistently review the value of the data, reduce waste, and retain value.
Here is an example of how to use each of these values to prioritize and justify the data— for volume, instead of focusing on the volume of data, we need to focus on the quality and variety of the data to provide accurate and actionable information across multiple systems.
A summary of this topic is shown in the following screenshot:
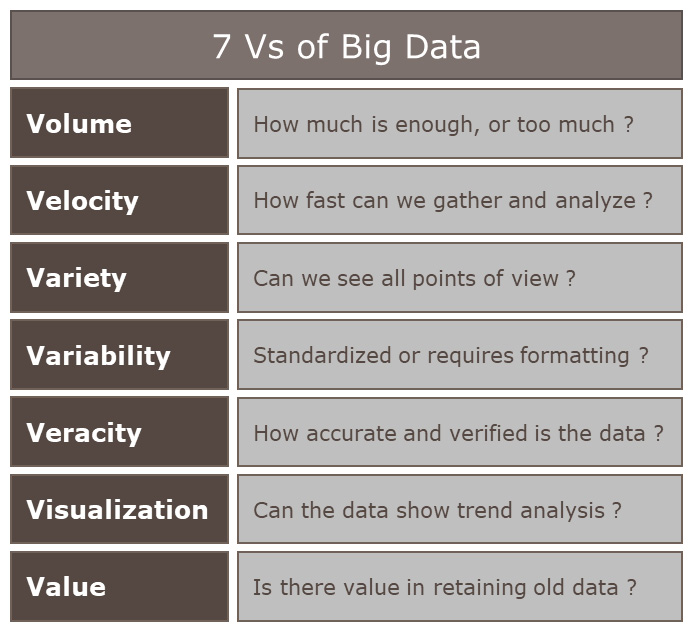
Figure 3.2 – The 7 Vs of Big Data
You can use the chart shown in the preceding screenshot to make your initial assessment of the types of data you need to ingest into Azure Sentinel and that which can be excluded. We recommend you also review this periodically to ensure you are maintaining a healthy dataset, either by adding more data sources or tuning out some of the data that no longer meets the requirements (but which costs to store and process).
Understanding connectors
Azure Sentinel relies on Log Analytics to store large volumes of data, in order to process that data and find useful information about potential risks and security threats. The data required may be located in many different types of resources across many different platforms, which is why we need many different options for connecting to those data sources. Understanding the options available, and how to configure them, is key to developing a strong data architecture to support the Azure Sentinel solution.
A summary of the connectors is shown in the following screenshot:
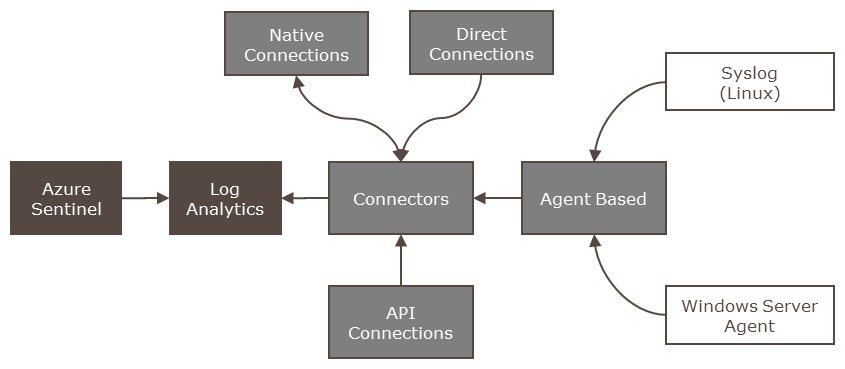
Figure 3.3 – Azure Sentinel connector flow
Connectors can be categorized based on the method used to ingest data from source. Currently, there are four major types:
- Native connections
- Direct connections
- API connections
- Agent-based (Windows Server Agent and Syslog)
Let’s explore each of these types in more detail.
Native connections – service to service
Azure Sentinel has been developed to integrate directly with several resources across the Microsoft security product range, including (but not limited to) the following:
- Azure Active Directory (Azure AD), including the advanced Identity Protection solution
- Office 365, including Exchange Online, Teams, and OneDrive for Business
- Cloud App Security, the CASB and cloud workload protection platform (CWPP) solution
- Azure Security Center, including Microsoft Defender Advanced Threat Protection (ATP)
- Azure ATP
This is the preferred method for connecting to resources, if the option is available. Let’s take a look at direct connectors.
Direct connections – service to service
Some connectors available in Azure Sentinel need to be configured from the source location. The connector will usually provide the information required and a link to the appropriate location. Examples of these connectors include the following:
- Amazon Web Services (AWS), for AWS CloudTrail
- Azure Firewall
- Azure Front Door
- Azure network security groups (NSGs); flow logs and rule activations
- Microsoft Intune; audit logs and operational logs
Now, let’s look at API connections.
API connections
Several security providers have API options that allow connections to be made to their solutions in order to extract the logs and bring the data in to Azure Sentinel. This is the preferred method for connecting to third-party solutions that support it, and you have the option to create your own connectors. For further information on creating API-based connectors, see this article: https://techcommunity.microsoft.com/t5/azure-sentinel/azure-sentinel-creating-custom-connectors/ba-p/864060.
Examples of API-based data connectors include the following:
- Azure Information Protection (AIP)
- Barracuda Web Application Firewall
- Microsoft Web Application Firewall
- Symantec Integrated Cyber Defense Exchange (ICDx)
- Symantec Cloud Workload Protection
The next type of connection is required for services that do not support any of the preceding options; usually for virtual or physical servers, firewalls, proxy, and other network-based devices.
Agent-based
This connector type will allow for the widest range of data connection and is an industry-standard method of shipping logs between resources and SIEM solutions. There are three types of connectors to consider; you may deploy one or more depending on your needs, and you may deploy multiple of the same type too. Let’s discuss them in detail.
Windows Server Agent
Any server running Microsoft Windows can forward logs for Domain Name System (DNS), security events, Windows Firewall, and AD.
Syslog server
This is an agent deployed to a Linux host that can act as a concentrator for many resources to send logs to, which are then forwarded on to Log Analytics for central storage. For detailed guidance on implementing a Syslog server, please see this article: https://docs.microsoft.com/en-us/azure/sentinel/connect-syslog. Examples of third-party solutions that support this method include (but are certainly not limited to) the following:
- Carbon Black
- Cisco (IronPort Web Security, Meraki, and others)
- Citrix
- F5 BIG-IP
- McAfee ePolicy Orchestrator (ePO)
- NetApp
- Palo Alto Cortex
- Trend Micro
While these options provide a wide range of options for data sources to gather, there is another method that, if available from the service provider, will give a richer dataset. Let’s take a look at the Common Event Format (CEF) option next.
Syslog server with CEF
This is very similar to the Syslog server deployment mentioned previously. For more detailed information, see this article: https://docs.microsoft.com/en-us/azure/sentinel/connect-common-event-format. The difference is that the source supports the CEF for logs. Examples of solutions that support this method include the following:
- Cisco (Umbrella, Cloud Security Gateway, and others)
- CyberArk
- F5 Firewall
- McAfee Web Gateway
- Palo Alto Networks Firewall
- Varonis
- Zscaler
With this range of connectors available, it is possible to connect to and gather information from multiple resources across all your operating environments, including on-premises, a hosted service, the public cloud, and even industrial operations environments or the Internet of Things (IoT).
Configuring Azure Sentinel connectors
The Azure Sentinel - Data connectors page shows the total number of connectors, how many are currently connected, and how many are in development. An example of the Data connectors page is shown in the following screenshot:
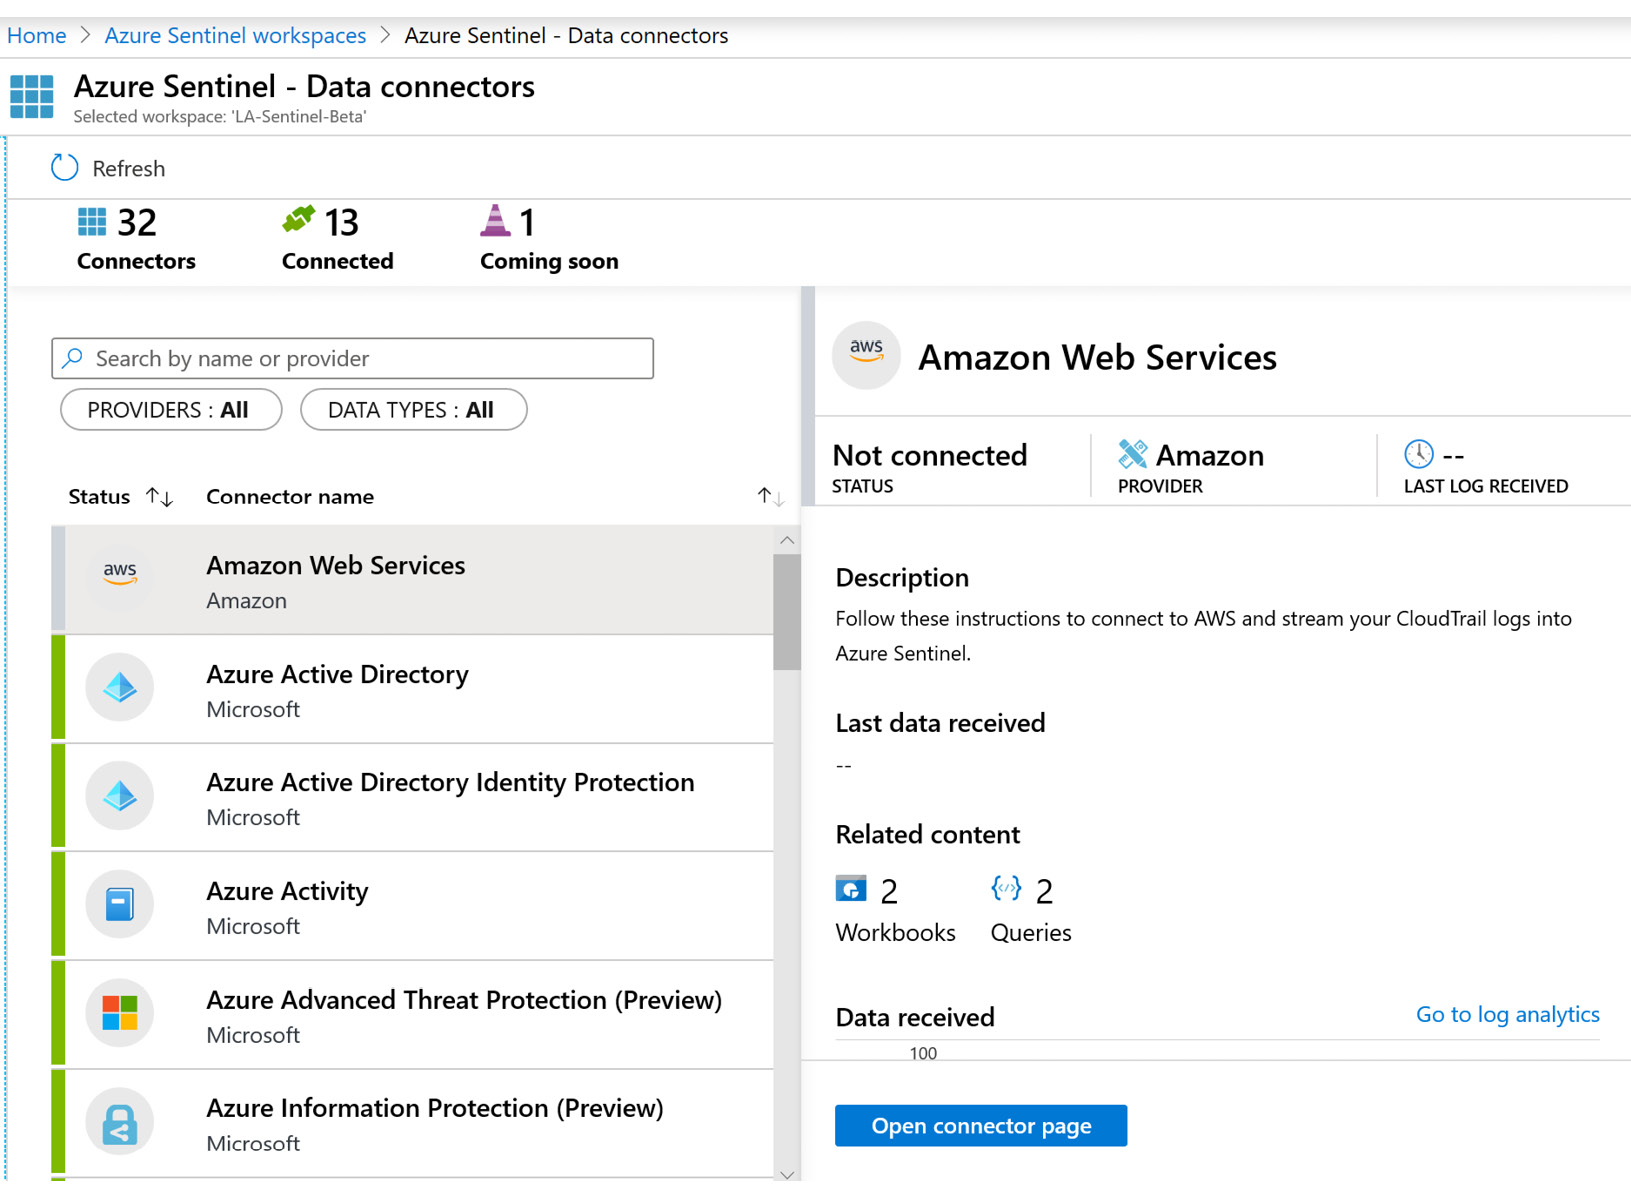
Figure 3.4 – Azure Sentinel Data connectors page
As you can see in the preceding screenshot, there are currently 32 connectors available to implement in this Azure Sentinel workspace. The list is likely to grow over time as more solutions become natively integrated, which is why you can see the ability to filter the list and search for specific data connectors. By selecting the connector on the left-hand side, we can view the connector details on the right-hand side. For this example, we will use the data connector for AWS, as shown in the following screenshot:
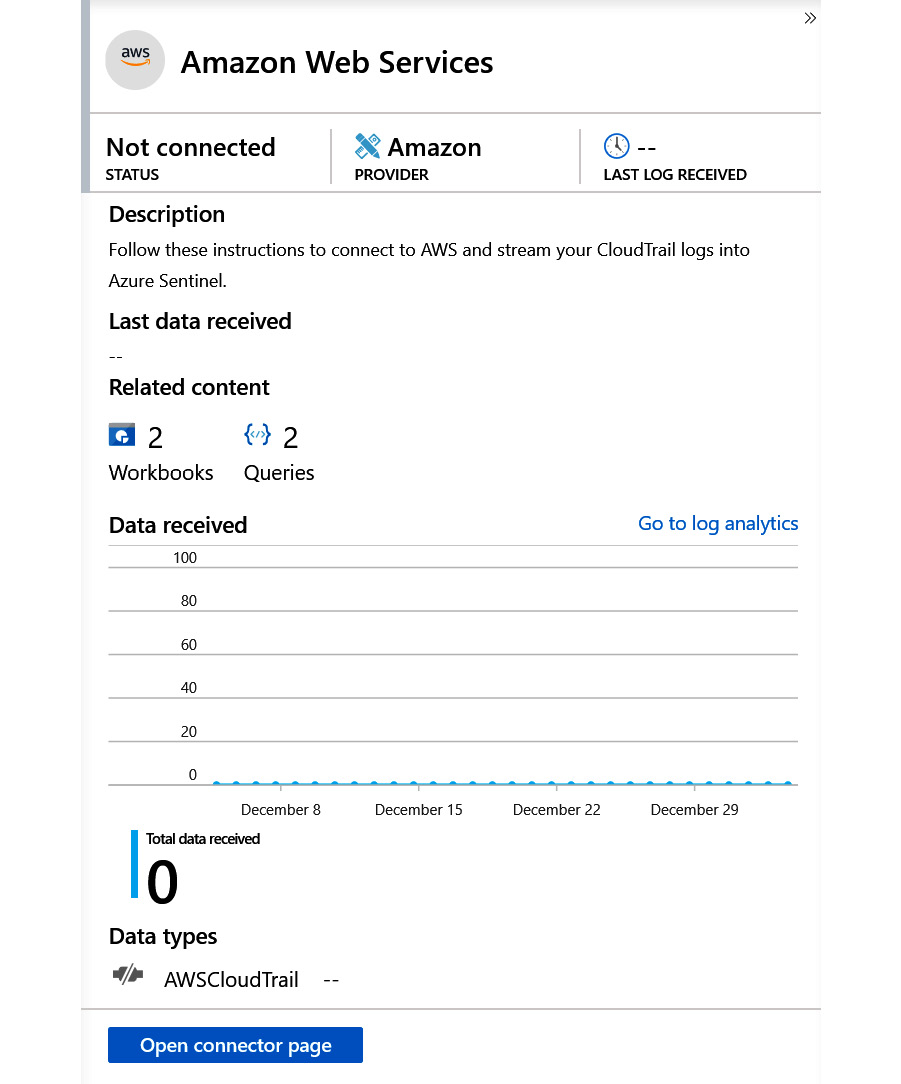
Figure 3.5 – Data connector details
At the top of the page in the preceding screenshot, we can see the STATUS of the connector (Not connected), the provider (Amazon), and the LAST LOG RECEIVED date/timestamp (empty due to a disconnected state).
The next section provides a description and further details about the connector, including a graph that will show the last few days of active log ingestion rate (when connected).
At the bottom of the page, we can see the Data types that are included in this connector; in this example, we are expecting to retrieve the AWS CloudTrail logs, when enabled.
Click on the Open connector page button to go to the next screen and start the configuration process, as shown in the following screenshot:
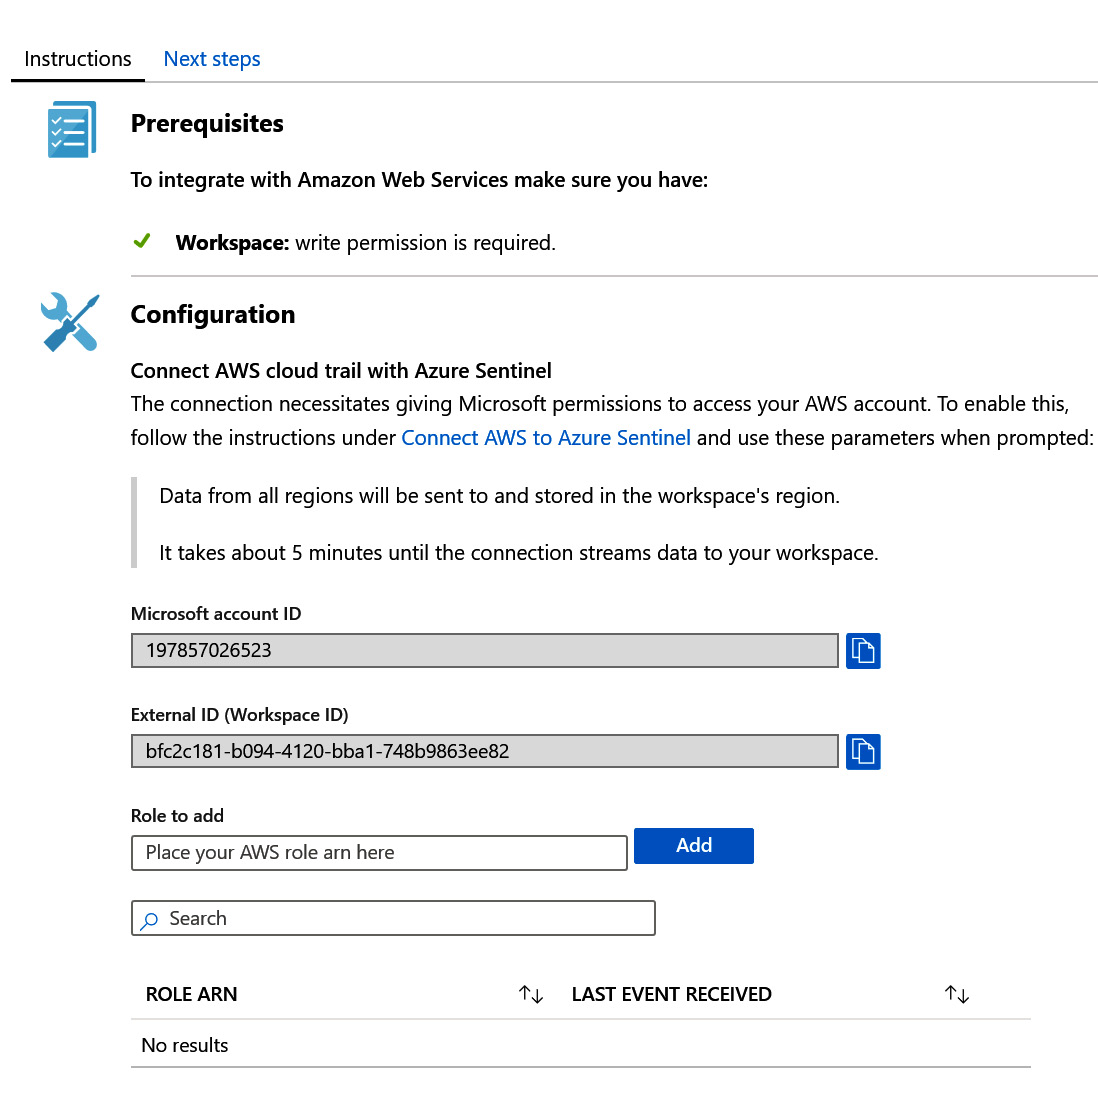
Figure 3.6 – Data connector configuration instructions
Each connector will show a slightly different screen, depending on the type of connector (native, direct, API, or agent) and the steps required to complete the configuration. In this example, the AWS connector is an API-based connector, and instructions are provided on how to set up the required permissions for Azure Sentinel to access the AWS account via the API. Once completed, you can select the Next steps tab to view the available workbooks and other resources available for this data connector, as shown in the following screenshot:
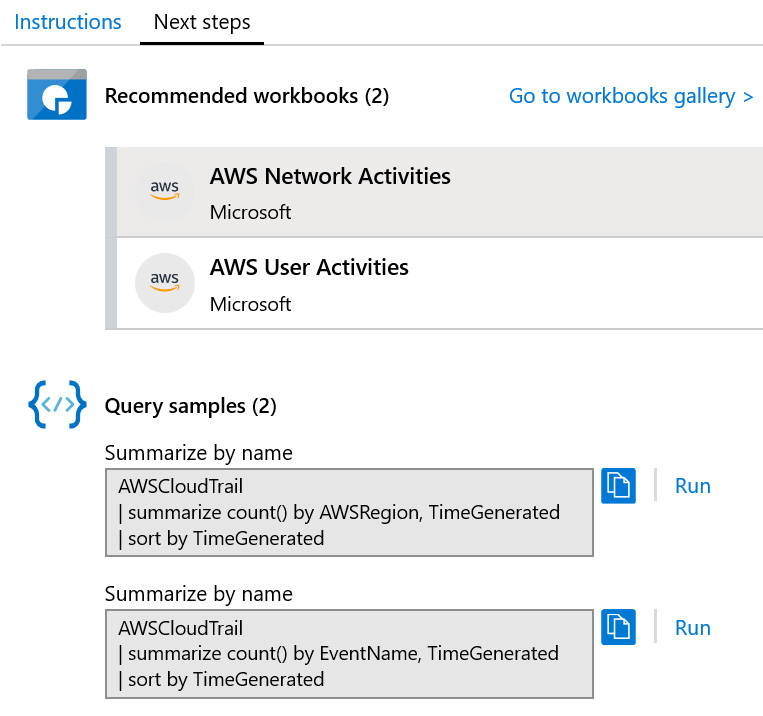
Figure 3.7 – Data connector configuration instructions
As we can see in the preceding screenshot, the AWS connector has the following two workbooks associated:
- AWS Network Activities
- AWS User Activities
Each of these workbooks is configured based on the information available in the AWS CloudTrail logs. The page also provides example queries you can use to get started with interrogating the logs for your own requirements. Further information about how to use workbooks can be found in Chapter 8, Introducing Workbooks.
Now, when we look at a data connector that has been successfully configured, we can view the same pages and see the differences, as shown in the following screenshot:
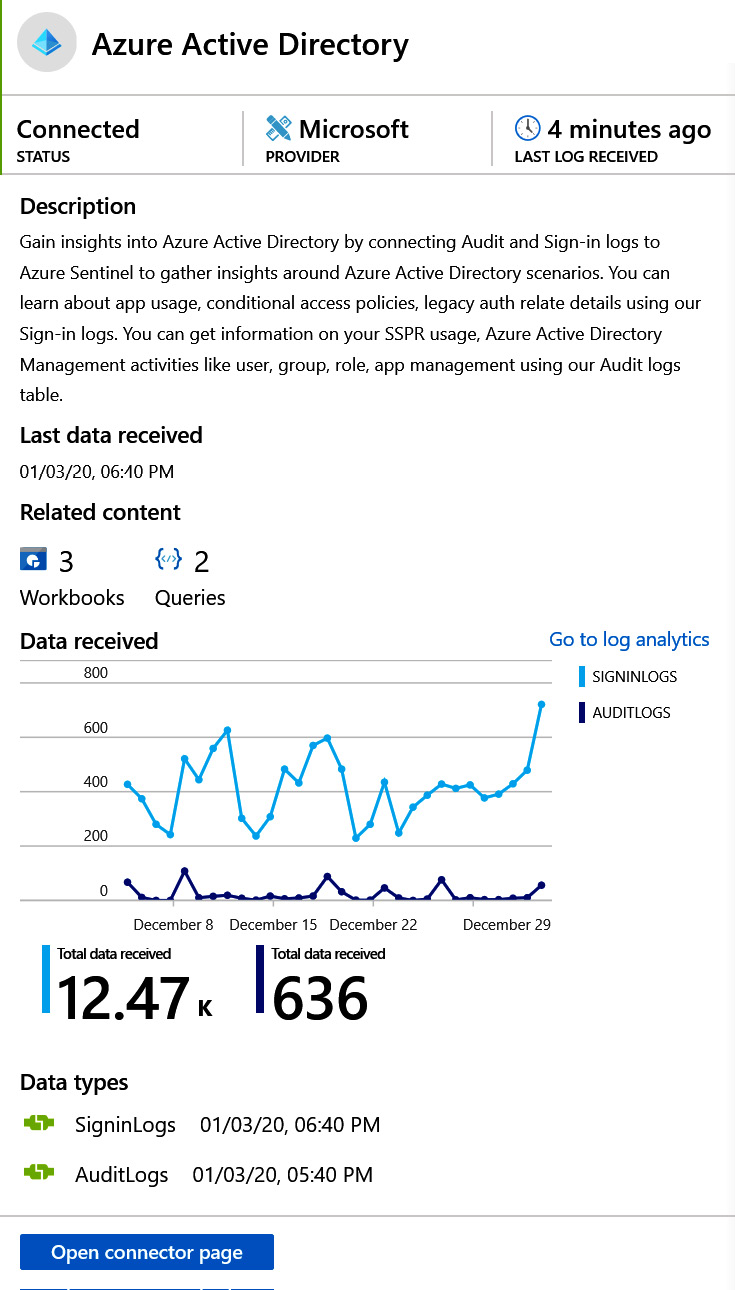
Figure 3.8 – Azure AD connector
We can see in the data connector page for Azure AD that this data source is connected and has received logs 4 minutes ago. We can see that 3 workbooks and 2 queries are using this data connector, and a regular flow of data has occurred over the last 3 weeks (December 8 to December 29). By selecting the Open connector page button, we get a view of the details of this connector, as shown in the following screenshot:
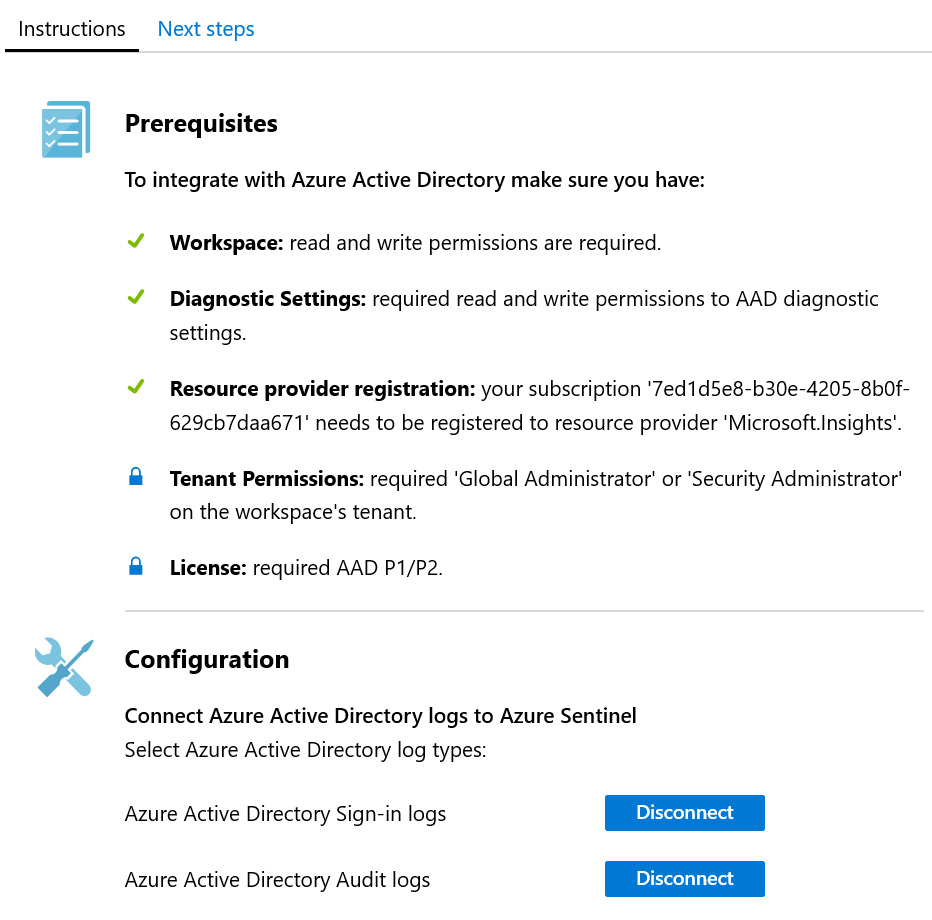
Figure 3.9 – Azure AD connector configuration
On the Instructions page, we see check marks to indicate the successful configuration of each element, with some padlocks to indicate other aspects that are also required. In the Configuration section, both the Azure Active Directory Sign-in logs and the Azure Active Directory Audit logs are connected. If you click on either of the blue buttons for Disconnect, this will stop the logs from being ingested to Azure Sentinel. Selecting the Next steps tab will show more information about what we can do with this connector, as shown in the following screenshot:
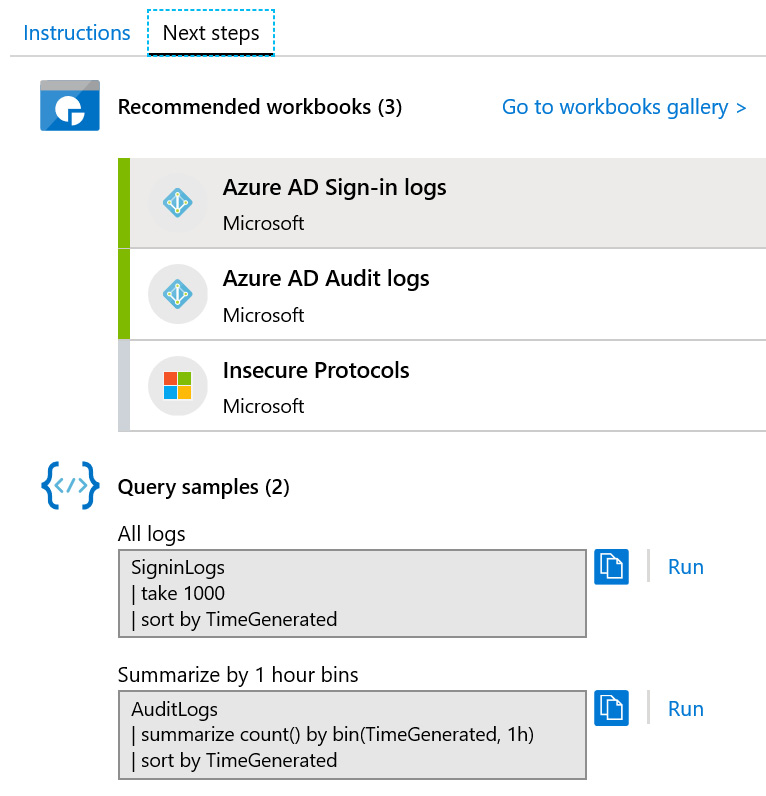
Figure 3.10 – Azure AD-enabled workbooks
On the Next steps page, we can see three recommended workbooks. Two of them have been enabled, shown by the bar on the left-hand side, and one of them is available but not yet enabled.
In this section, we walked through the setup of the data connectors to enable data ingestion. In the next section, we will move on to look at how we manage that data to ensure we retain enough information to be useful, without storing so much that it becomes expensive.
Configuring Log Analytics storage options
Once you have completed the configuration of a few data connectors, you will begin to see how much data you will ingest and store in Log Analytics on a daily basis. The amount of data you store and retain directly impacts the costs—see Chapter 1, Getting Started with Azure Sentinel for further details. You can view the current usage and costs by navigating to the Log Analytics workspace, then selecting Usage and estimated costs from the General menu, as shown in the following screenshot:
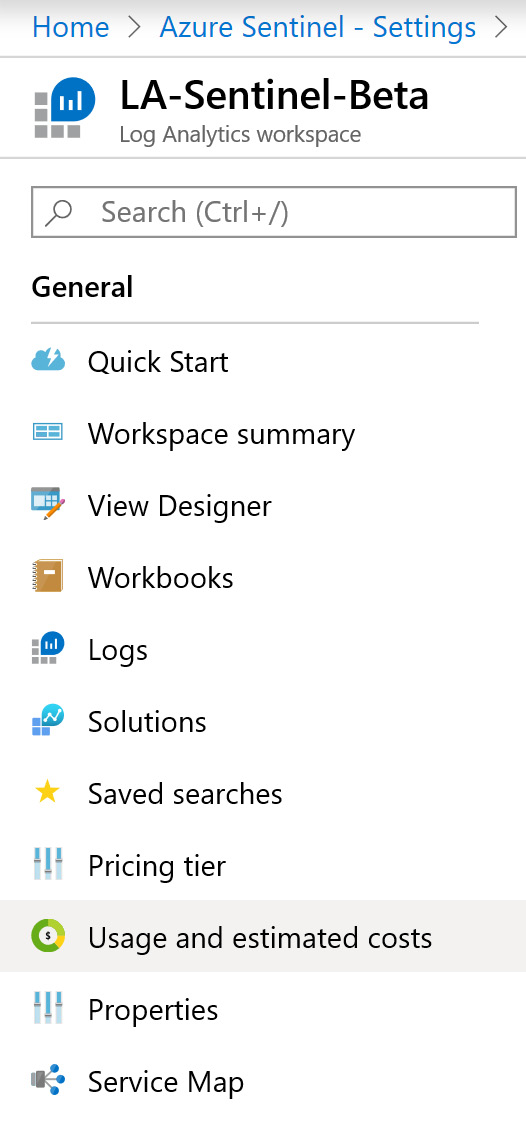
Figure 3.11 – Log Analytics navigation menu
Once selected, you are then presented with a dashboard of information that will show the pricing tier and current costs on the left-hand side and graphs on the right-hand side, to show the variation in consumption on a daily basis for the last 31 days. A second graph shows the total size of retained data, per solution. An example of the dashboard is shown in the following screenshot:
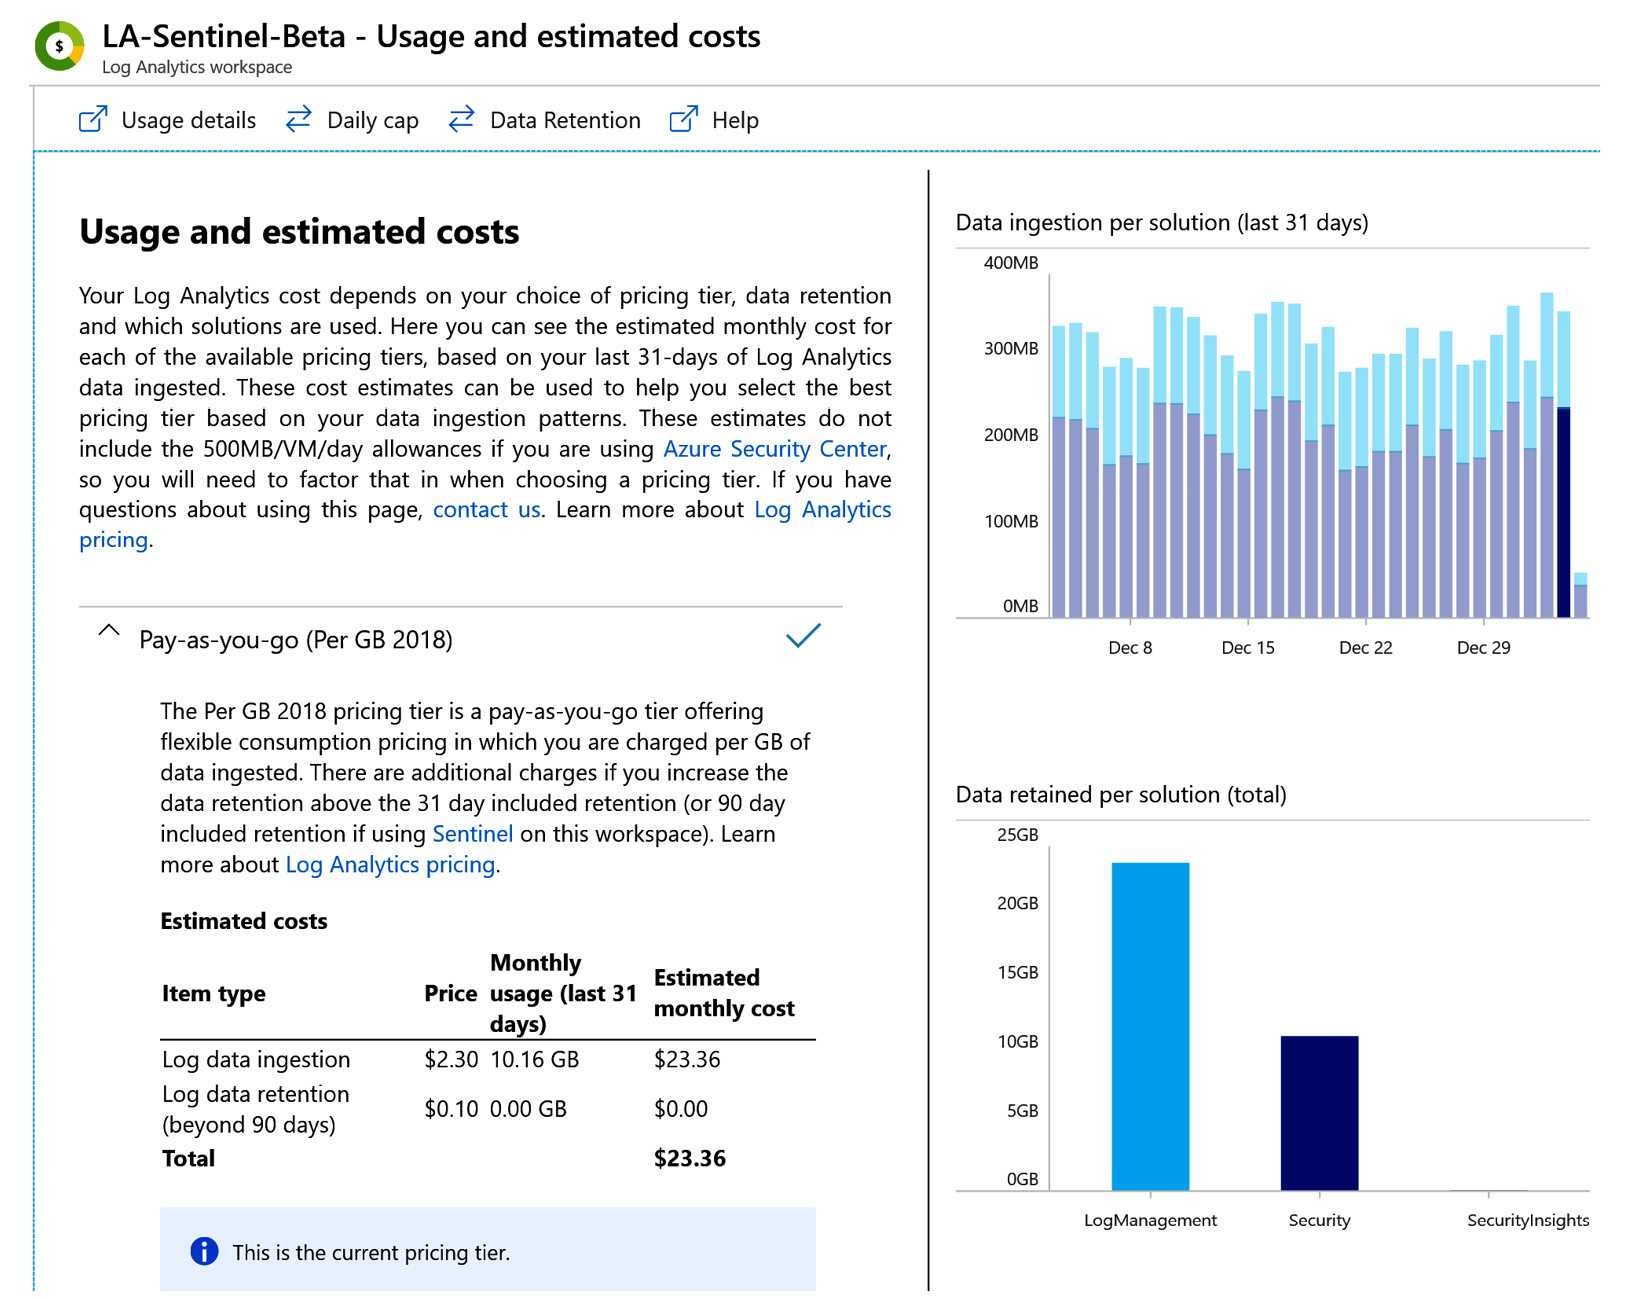
Figure 3.12 – Log Analytics usage and cost dashboard
From this page, explore two of the options available along the top menu bar:
- Daily cap: With this option, you can enable or disable the ability to limit how much data is ingested into the Log Analytics workspace on a per-day basis. While this is a useful control to have to limit costs, there is a risk that the capped data will result in a loss of security information valuable for detecting threats across your environment. We recommend only using this for non-production environments.
- Data Retention: This option allows you to configure the number of days data should be retained in the Log Analytics workspace. The default for Log Analytics is 31 days; however, when Azure Sentinel is also enabled on the Log Analytics workspace, the default free amount is 90 days. If you choose to increase beyond 90 days, you will be charged a set fee per gigabyte (GB) per month.
In the next section, we will look at how we calculate the costs involved in data ingestion and retention for Azure Sentinel and Log Analytics.
Calculating the cost of data ingestion and retention
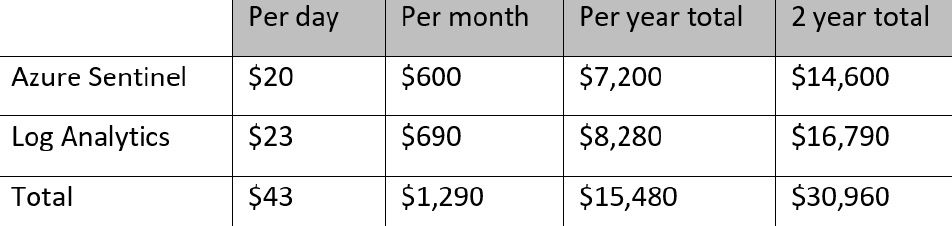
Many organizations have a need to retain security log data for longer than 90 days, and budget to ensure they have enough capacity based on business needs. For example, if we consider the need to keep data for 2 years, with an average daily ingestion rate of 10 GB, then we can calculate the cost of the initial ingestion and analysis, then compare to the cost of retention. This will provide an annual cost estimate for both aspects.
The following table shows the cost for ingesting data into Log Analytics and analyzing that data in Azure Sentinel. This price includes 90 days of free retention:
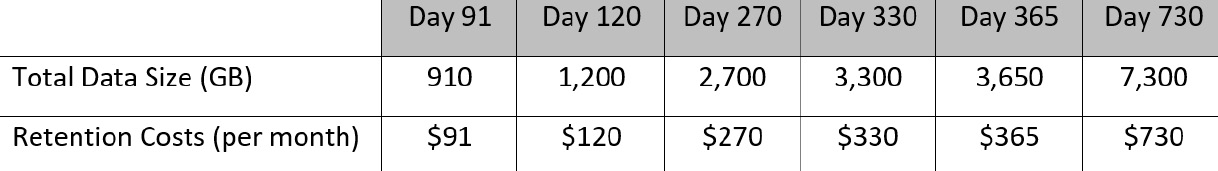
The following table shows the amount of data being retained past the free 90 days included in the preceding pricing, based on ingesting 10 GB per day:
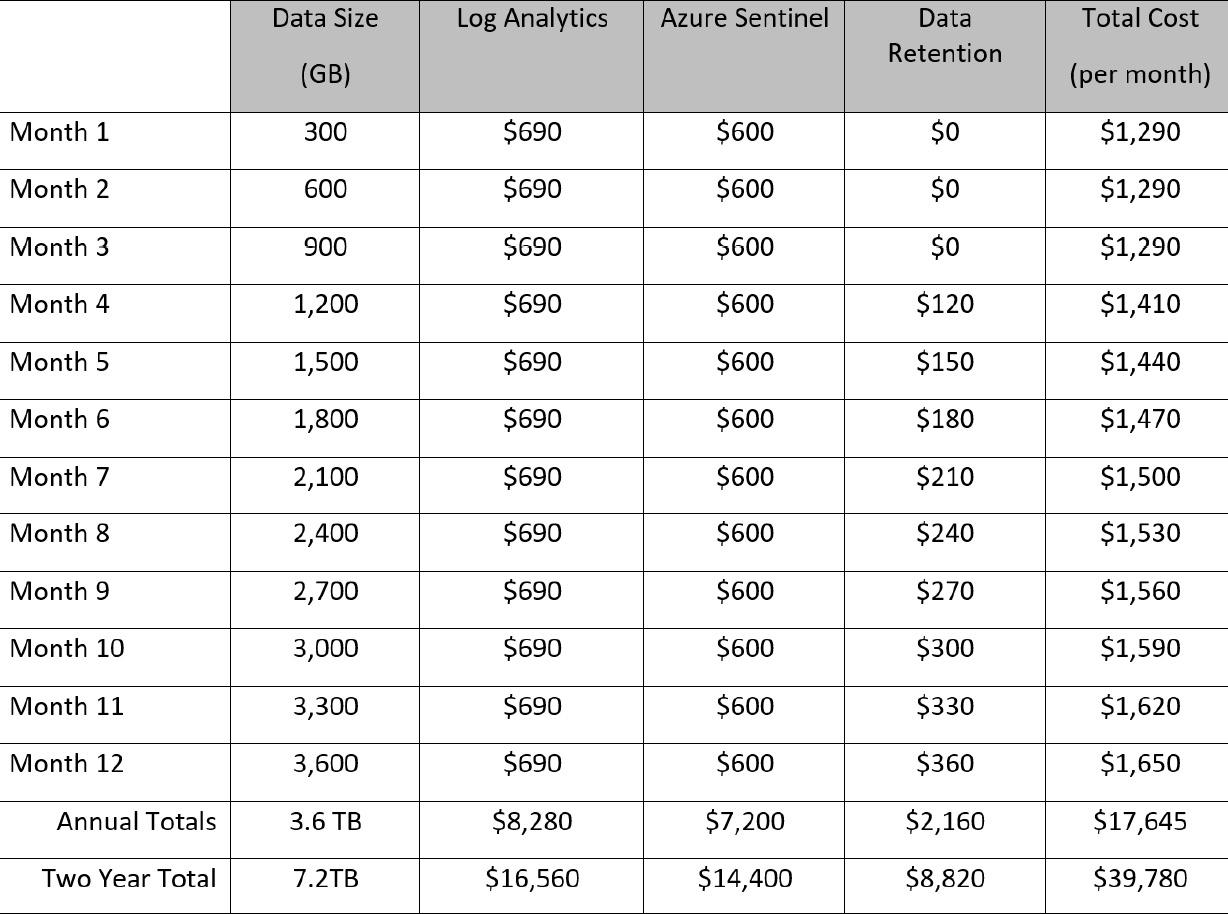
Now, if we add these together, we can see the total cost of the solution over a 12-month period, shown in the following table:
Note
These prices are based on the current rates applicable to the US East Azure region, and figures are rounded to simplify. Actual data usage may fluctuate each month.
Based on these examples, the total cost for running Azure Sentinel, ingesting 10 GB per day and retaining data for 2 years, would be $39,780. Data retention accounts for 22% of the cost.
Because the charges are based on the volume of data (in GB), one way of maintaining reasonable costs is to carefully select which data is initially gathered, and which data is kept long term. If you plan to investigate events that occurred more than 90 days ago, then you should plan to retain that data. Useful log types for long-term retention include the following:
- IAM events such as authentication requests, password changes, new and modified accounts, group membership changes, and more
- Configuration and change management to core platforms, network configuration, and access controls across boundaries
- Creation, modification, and deletion of resources such as virtual machines, databases, and cloud applications (Platform- as- a- Service (PaaS) and Software- as- a- Service (SaaS) resources)
Other data types can be extremely useful for initial analysis and investigation; however, they do not hold as much value when the relevance of their data reduces. They include the following:
- Information from industrial control solutions
- Events streamed from IoT devices
Also, consider that some platforms sending data to Azure Sentinel may also be configured to retain the original copies of the log data for longer periods of time, potentially without additional excessive costs. An example would be your firewall and CASB solutions.
Reviewing alternative storage options
The benefit of retaining data within Log Analytics is the speed of access to search the data when needed, without having to write new queries. However, many organizations require specific log data to be retained for long periods of time, usually to meet internal governance controls, external compliance requirements, or local laws. Currently, there is a limitation, as Log Analytics only supports storage for up to 2 years.
The following solutions may be considered as an alternative for long-term storage, outside of Log Analytics:
- Azure Blob Storage: You can create a query in Azure Monitor to select the data you want to move from the Log Analytics workspace and point it to the appropriate Azure Storage account. This allows for filtering of the information by type (or select everything), and only moving data that is about to come to the end of its life, which is the limit you have set for data retention in the Log Analytics workspace. Once you have the query defined, you can use Azure Automation to run PowerShell and load the results as a CSV file, then copy to Azure Blob Storage. With this solution, data can be stored for up to 400 years! For further information, see this article: https://docs.microsoft.com/en-us/azure/azure-monitor/platform/powershell-quickstart-samples.
- Azure SQL: Data that is stored in Azure Blob Storage can be then be ingested into Azure SQL (Database or Data Warehouse), which enables another method for searching and analyzing the data. This process utilizes Azure Data Factory to connect the Azure Blob Storage location to Azure SQL Database/Data Warehouse, automating the ingestion of any new data. For further information, see this article: https://azure.microsoft.com/en-us/documentation/articles/data-factory-copy-data-wizard-tutorial/.
- Azure Data Lake Storage Gen2: As an alternative to Azure Blob Storage, this option enables access to the data via open source platforms such as HDInsight, Hadoop, Cloudera, Azure Databricks, and Hortonworks. The data does not need to be transferred (as with Azure SQL), and this solution provides easier management and increased performance and is more cost-effective. For further information, see this article: https://docs.microsoft.com/en-us/azure/storage/blobs/data-lake-storage-introduction.
As you can see, there are plenty of options available to store the data in alternative locations, both for extended archive/retention and for additional analysis with alternative tools. We expect Microsoft will increase the number of options available.
Summary
In this chapter, we reviewed the importance of data quality, using the 7 Vs of Big Data as a guide to selecting the right data. We also looked at the various data connectors available to retrieve logs from a wide variety of sources, and the importance of constantly reviewing the connectors for updates and additional resources, such as workbooks. You now have the skills required to set up data connectors to begin ingesting data for later use in analysis and threat hunting.
Ongoing data management plays a key part of this solution, ensuring you maintain cost efficiency of the solution without losing valuable information that can help identify risk and mitigate potential loss. Use the information in this chapter to apply to your own environment, and review regularly.
In the next chapter, you will learn how to integrate threat intelligence feeds into Azure Sentinel, in order to enrich your data with insights from security experts and make your investigations more effective.
Questions
Use these questions to test your knowledge of this chapter:
- Can you list the 7 Vs of Big Data?
- What are the four different types of data connectors?
- What is the purpose of a Syslog server?
- How long is data stored in Azure Sentinel without extra cost?
- What are the alternative storage options for log retention?
Further reading
The following resources can be used to further explore some of the topics covered in this chapter:
- Azure Sentinel: Creating Custom Connectors https://techcommunity.microsoft.com/t5/azure-sentinel/azure-sentinel-creating-custom-connectors/ba-p/864060
- Connect your external solution using Syslog https://docs.microsoft.com/en-us/azure/sentinel/connect-syslog
- Connect your external solution using CEF https://docs.microsoft.com/en-us/azure/sentinel/connect-common-event-format
- Azure Monitor PowerShell quick start samples https://docs.microsoft.com/en-us/azure/azure-monitor/platform/powershell-quickstart-samples
- Tutorial: Create a pipeline with Copy Activity using Data Factory Copy Wizard https://azure.microsoft.com/en-us/documentation/articles/data-factory-copy-data-wizard-tutorial/
- Introduction to Azure Data Lake Storage Gen2 https://docs.microsoft.com/en-us/azure/storage/blobs/data-lake-storage-introduction