In osCommerce, an online merchant has access to several built-in reports in the default installation of the system. Although some are useful (like Bestselling products report), it's definitely not enough to give the online merchant a clear and detailed picture of the overall status of the business, and more information about whether it's possible to improve the business further, make it more profitable, and more efficient.
In fact, one of the main reasons to run and use reports in osCommerce is to constantly consider opportunities to improve the online business.
The good news is that all (or almost all) the information that is required to build extra reports already exists in the database of an osCommerce-based online store. Some data would have to be taken from third-party tracking solutions (like the ones used to calculate the number of visitors to a website).
Creating new reports is a complex task, but, as soon as they are ready, the online merchant will have all the required information to make educated executive decisions regarding the online business.
In this chapter, we will review different groups of reports, how to create them in osCommerce or using third-party solutions, and, most importantly, how to understand and use those reports to produce the maximum positive benefit for the business. Our goals are to make the business more profitable, and more efficient.
Note
Some of the reports we will be talking about require minor updates to the standard osCommerce database (such as adding the Cost field to the products). We will assume those updates have already been done and also that all products already have their costs set in the database.
The number of visitors to an online store usually changes on a day-to-day basis, even on an hour-to-hour basis. Other parameters that change include the regions the visitors come from, the time they spend on the website, and the pages they view.
For an online merchant, or for an e-commerce manager, it's crucial to have access to that information, be able to understand it, and act accordingly, to increase conversions from visitors to customers, and make the business more efficient and profitable.
The number of visitors that the website has daily depends on many factors. But quite often, website owners are able to detect a certain pattern in how the number of visitors changes depending on the month of the year, day of the week, or hour of the day. There will be some times when most of the orders are made, and there will be some quieter times, when the website doesn't receive many visits.
Of course, if the online store sells locally or nationwide, the online merchant would not normally expect the customers to buy during the night hours. If the online store sells internationally, and a number of prospective customers live in countries with different time zones, the online store may truly work (i.e. sell) 24 hours a day!
If the statistics show certain ups and downs in the number of visitors every week, the online merchant should try to minimize the number of "downs" or at least minimize the difference between the number of visitors in the "up" day and "down" day.
For example, a day before the "down" day of the week, the online store can send a newsletter to its subscribers, attracting them to come to the site to see new hot offers and products. Also, some special offers providing customers with a really good discount could be put up during the "down" days of the week to attract as many prospective customers as possible, and ensure higher conversion rates on those days.
The same approach can work when checking the hours when the online store sells most of its products, and when there's a quieter period. Time-limited special offers could be introduced then to stimulate more customers. A special price countdown timer can be displayed alongside the product to hasten the customers in making their decisions.
Many solutions that track the behavior of website visitors can identified the most popular pages that many customers visit (or that they spend a significant amount of their time browsing).
No matter why those pages attract the visitors to the website, it's important to be able to track if they eventually convert visitors into customers. If a page of an online store is very popular and receives a significant number of visitors daily, but doesn't convert visitors into customers, it's a clear sign the page needs to be redesigned, improved, and its content changed, so that it more actively "sells" products to effectively convert visitors into customers. It may be that the page looks confusing to prospective customers, or they may not be finding enough information on the page to place an online order. All those possibilities need to be explored and decisions made on how to improve popular, but non-converting, pages.
On the other hand, if a web page of an online store converts a good number of visitors into customers, it may make sense to use that page to advertise more products in order to increase sales. It also makes sense to ensure that the products that appear on that page (if any) are the ones with the greatest possible difference between the sale price and the cost, to ensure that each sale brings maximum profit to the online merchant.
Except for the "Who is Online?" tool, osCommerce doesn't have built-in tools for monitoring visitors to the website. Therefore, it makes sense to use third-party tools to track visitors and monitor their activity on the website.
It should be noted that different third-party solutions use different techniques to calculate the number of visitors and monitor their activity, so results gathered by different solutions will also be different.
Some third-party solutions (like, for example, Google Analytics) require further integration into the online store. There is a contribution for osCommerce that integrates Google Analytics into the site. Not only visitors, even customers can be monitored by Google Analytics as it has a special e-commerce add-on to track down online orders.
Other third-party solutions (like, for example, WebAlizer) do not require integration into online store as they fetch data directly from the web server's log files.
This latter approach doesn't slow down the page loading speed unlike the former ones, but doesn't allow for such comprehensive statistics as can be provided by integrated solutions.
It should be noted that the difference between the "Who is Online?" and tools such as Google Analytics or WebAlizer is that the "Who is Online?" feature allows for real-time tracking to website visitors, whereas other solutions provide information about past visitors of the website.
Knowing the number of unique visitors and also the number of online orders received during the day, it's very easy to calculate the general conversion rate of an online store.
Solutions like Google Analytics can do it automatically. If corresponding goals are set then the conversion rate for each goal can be calculated. A goal is actually a web page of the online store. As soon as the customer reaches a certain page of the website, the goal is fulfilled. Additional filters can also be applied. For example, a goal can be considered fulfilled only if a visitor or a customer has reached the goal coming from or through certain other web pages of the online store.
By knowing the online store's day-to-day conversion rates, it's possible to calculate the average conversion rate during a certain time period. It's also possible to see how conversion rates change in time, and what factors (like the start or end of advertising campaigns in certain media or referring sources, season of the year, day of the month, etc.) affect the conversion rates.
Knowing the average conversion rate in the industry is a requirement when creating a business plan for an online store. The minimum number of visitors to the online store to supply the minimum turnover and the minimum profits required to run the business depend on the average conversion rate. Also dependent on the average conversion rate is the advertising cost required to attract that minimum number of visitors effectively.
Online stores often advertise in different media and correspondingly have different referring sources for their prospective customers. It's essential to be able to see how each individual referring source performs during a certain period of time, and what is the conversion rate per referring source.
Conversion rate per referring source shows how efficient a certain referring source is, and tells the online merchant or e-commerce manager how to spread the advertising budget among the referring sources with the maximum efficiency.
Of course, it's sometimes not only about the efficiency but also about the volume—there could be some referring sources that are not that efficient in converting visitors into customers, but which supply higher volumes of sales than others. Also, there could be some referring sources that are free to use (nowadays it's natural/organic search results in search engines), and so their conversion rates do not really affect the advertising budgets of the online store.
For each referring source, it's required to know for a certain period of time:
Number of visitors referred
Number of visitors converted into customers
Conversion rate per referring source
Number of orders placed
Volume of sales generated
Volume of profits generated
Average spend by every referred visitor
Average spend by every referred customer (i.e. average order amount)
Bestselling products
Bestselling categories of products
Bestselling product brands/manufacturers
Knowing the amount of profits referred by a certain referring source, for a certain period of time, it is possible to calculate its average return on investment by dividing the amount of profits by the amount of advertising costs for that period of time.
If ROI is greater than 1, it means the referring source actually produces certain gross profits. If ROI is 1 or less than that, it may mean the referring source is not worth investing money into, as it doesn't produce any gross profit at all. Every time we use the word "profit" in this chapter, except for special occasions, it's the gross profit, i.e. profit based on margin without any other business costs taken into account.
There could be an exception here. It's when the online store uses some referring sources more for brand awareness and less for attracting customers. If that's the case, ROI on such referring sources will not make any difference, as those referring sources serve another purpose.
By knowing the ROI of a referring source, the online merchant or e-commerce manager can plan gross profits by planning the advertising budget for that referring source ahead, assuming of course, that the ROI will not change.
If ROI is well greater than 1, and the generated gross profits turn into net profits, it makes sense to increase the advertising budget for such a referring source. If ROI is 1 or even less than that it makes sense to try to negotiate a better advertisement rate based on the fact the online store actually loses money by putting advertising into the referring source, re-consider the advertising budget for such referring source, and reconsider the content of the advertisement published there. And if none of those measures helps to improve the situation, it makes sense to cease advertising in that particular referring source and invest the money saved into more profitable ones.
Various referring sources may supply different types of visitors to the online store.
It is important to be able to see what sort of visitors are provided by each referring source, as it allows adjusting the content of the advertisement used to attract visitors from the corresponding referring source. The average spend, by visitor, and by customer, will show the online merchant or e-commerce manager if those visitors who are usually referred by that referring source are ready to buy products online, and if they are ready to buy more expensive products/several products at a time.
Looking into the report by bestselling products, brands, and categories of products by referring source, the online merchant may decide to reconsider the content of the advertisement put into that referring source. If bestselling products sell well because of their price, considering the profile of the average visitor referred by that referring source, it may make sense to highlight that fact in the advertisement. If the online store has exclusive rights to offer some products (or even brands!) online, it may make sense to highlight this fact as well in the advertisement.
Of course, besides the current figures, it's always important to be able to monitor the trends, i.e. how certain figures change in time. For example, what the conversion rate of the referring source was the very same month a year ago, or last month, or last quarter. Or what was the average spend by customers and visitors referred by that referring source. Knowing trends also helps to predict how this or that referring source is likely to perform in the future, and plan advertising budget and sales figures accordingly.
It is possible to improve an osCommerce online store and save statistics by visitors and customers referred by referring sources using the "Referred by" parameter of the HTTP request. This parameter is sent to the online store when a visitor clicks the advertisement link in the referring source. Information about the visit can be stored in the database. It would include the name of the referring source, the date and time of the visit, and certain special keywords or parameters provided in the HTTP request. Also, the name of the referral source could be stored on the user's local computer in a special cookie. Later on, when the user decides to place an order, the online store would extract the name of the referral source from the cookie from the user's computer and save it into the database along with the order. In this way it will be possible to calculate the number of visitors and customers referred by each individual referring source.
Using third party solutions (like Google Analytics) may make this process easier, and will allow the online merchant or e-commerce manager to do without the need to modify the online store.
Some visitors to an online store would either know the URL and type it directly in their web browser, or would see the link to the online store on another website and click it.
But many visitors would search for products or services, the same as or similar to the ones promoted by the online store in search engines, and would then click the link to the online store that appears either in the natural search results section, or in the paid search results section on the search engine's website.
It's very important to know what keywords and key phrases these visitors search for to find the link to the online store.
Search engines, of course, should be considered referring sources too in that situation.
The list of columns in this report would usually be identical to the list of columns in the Report by Referring Source. Of course, instead of referring sources all figures would be calculated on a per keyword/key phrase basis.
Knowing which keyword or key phrase performs better than others allows for adjusting the advertising budget, and investing into those better performing keywords and key phrases.
Sometimes, it makes sense to stop paid advertising on certain keywords if they do not perform well enough to produce gross profit, and spend that part of the budget on better performing keywords. Alternatively, it may make sense to increase the advertising budget on poorly performing keywords as the competition may be too strong and the current budget may simply not be enough to start winning more visitors.
Also, having that information filtered by a referring source may be of a great help to the online merchant or e-commerce manager of the online store. It will then allow monitoring how one and the same keyword or key phrase performs in different referring sources. If performance (i.e. the number or amount or sales, amount of profits, ROI) differs a lot, this is a signal to check advertising budgets as competition on certain keywords may be too strong in some referring sources.
As with the referring sources, the report on keywords is probably easier to run using such third-party tools such as Google Analytics. But it's possible to modify osCommerce (in the same way as modifying it for tracking referring sources) to store keywords used by visitors and customers of the site in the database, and retrieve that stored information later on for the report.
Sales in osCommerce can be monitored in different ways. We will consider those later in this chapter, and in the mean time review how sales can be tracked more generally.
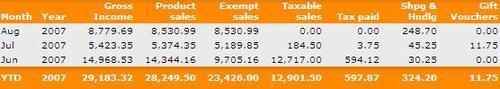
Interestingly, the general sales statistics of an online store are not available in the default installation of osCommerce. A number of solutions and contributions have been developed that make this information available to the online merchant. Like for example a contribution that makes it possible to see sale statistics grouped by months and years, including taxes, net prices, shipping, and of course totals, which is available from http://addons.oscommerce.com/info/539.
It gives statistics per time periods (like months and years) and demonstrates changes in gross income, product sales, taxable, and tax exempt sales.
It is possible to run a slightly different report that helps to not only understand how the general sale figures tend to change with time, but also allows for applying filters by order status or time, and also splits sales into net sale, tax, shipping fee, discount coupons, and gift vouchers (if corresponding functionality is a part of the online store).
It is fairly important to be able to see statistics of sales by certain time patterns like for example, sales by day of week or sales by hour of a day. Repeating each week or each day (or each month, or each year!), such a report helps the online merchant to understand when the number of orders needs to be improved, and also find out when the target customer audience is in a mood to buy products and services offered by the online store.
For example, if based on that report Monday is not a very good day for online sales, the online merchant may want to send a regular weekly newsletter to subscribers with the latest hot offers on Sunday (or even on Friday), trying to make the customers interested in buying products in the beginning of the next week (i.e. on Monday). Or if the customers tend to buy more products on Tuesday, Wednesday, and Thursday, the newsletter can be sent on Monday to inform existing subscribers about hot offers and new products, and also advertising budgets could be increased on Tuesday, Wednesday, and Thursday so that more and more visitors are converted into customers—as obviously the conversion rates are likely to be better those days.
For some osCommerce online stores, the time of the year or the day of the month mean a lot. If an online store sells seasonal products (like sunglasses, swim suits, and other products for summer holidays), it obviously makes sense to increase advertising budgets just before the holiday season hits, as more customers will be buying such products during that time.
Or if the online store sells quite expensive products, it may make sense to increase advertising budgets and send newsletters during those days of the month when the target audience are likely to get paid at work, and have money to spend on quite an expensive purchase.
Of course, using such a report requires a very good understanding of prospective customer behavior.
There is no built-in default sales forecasting solution for osCommerce, but there are certain third-party solutions that osCommerce merchants could have integrated with their online stores.
One such solution is available at www.lokad.com.
Based on the number of visitors, customers, and the amount of sales during a certain time period, a prediction could be made of future sales volumes.
osCommerce features a report by bestselling products as a part of its default installation.
Standard report allows for seeing the bestselling products, but at the same time, it doesn't allow for applying filters (at least by time, category, the number of sales, etc.) and seeing summary by category and brand/manufacturer.
Therefore, an additional report like the one described below would be convenient for online merchants to be able to manage their online store effectively. It could be based on a copy of the existing bestselling products report, or created as a new module of the Reports section of the osCommerce back end.
The report can have a number of columns, filters by start and end date may be applied, and the following information can be made available to the online merchant or e-commerce manager:
Product name
Product code
Manufacturer
Category
Number of products ordered
Total turnover
Total profit
Minimum cost (based on sales)
Maximum cost (based on sales)
Free stock
Current cost
Current sale price
Average margin (in %)
Date when the stock is likely to run out (based on previous sales)
Being able to sort data on the report by each of the above columns would be beneficial for whoever works with the report. Besides the time filter, it should be also possible to set the filter by:
Minimum number of sales for period
Brand/manufacturer
Category
Free stock
Region where the customer lives
Average margin
Based on the report by bestselling products, the online merchant can make an educated decision as to how the product catalog should be re-arranged, if at all.
For example, by comparing the bestselling products for different time periods and seeing a product with a good margin dropping from the leading positions, the online merchant may want to check if the price is still competitive and possibly lower it a bit to bring the product back to the top of the list.
On the other hand, the price of a product with a lower margin that always dominates in the list of bestselling products can be altered and its margin made higher, so that even by making less sales, the online store will still be making approximately the same amount of profits.
Also, it's possible to check using the report whether all bestselling products are available in free stock, as such products are very likely to be running out of stock very often. And, having calculated the approximate date when the stock of a certain product is likely to run out, it's possible to see if the supplier or the manufacturer of the product offers better rates if more products are ordered together, and add that product (which probably still has certain amount left in free stock) to the purchase order knowing that should the sales go same way as before, the stock of that product will run out by approximately the calculated date.
By changing the region filter, it's possible to find out what are the preferred products for customers who live in different regions and to adjust local advertising campaigns, accordingly.
Finally, if an online store also has a warehouse, it may make sense to lower price on products that are still in free stock but are not very likely to be sold soon to free up the space to buy other products with a good margin that are more likely to be sold to customers.
These two reports can be run against an osCommerce database similar to the Bestselling Products report. Columns in both reports will be similar, with only the exception of the Bestselling Categories report having one more column—parent category, where the Bestselling Manufacturers report won't have one—as there is no support for multilevel brands/manufacturers in the default installation of osCommerce.
Information in both reports may help the online merchant to rearrange the product catalog in the most efficient way. Only, instead of having statistics on each individual product, those two reports will have sales statistics on groups of products.
Like the Bestselling Products report, Bestselling Categories and Bestselling Brands reports could be used to:
Check if the average sale price of products that belong to a particular category or are produced by a particular manufacturer is competitive, or, on the contrary should be increased.
Check if there's enough free stock in bestselling categories, and when that free stock is likely to run out, so that the online merchant could plan further purchase orders from suppliers wisely.
Find out customers of which region prefer products of which category or brand, and how this tendency changes in time—hence advertising campaigns could be improved in particular regions by concentrating on promotion of certain categories or brands.
Find out which categories or brands do not sell well, and where there's still free stock—so that whole categories or brands could be discounted to get free space for products that sell better. Later on the online merchant may decide to discontinue certain categories and brands on the site to make it (the site) more competitive by being focused on a niche market.
The report by the most profitable products is actually a part of the Bestselling Products report. It allows seeing the products that bring the most profits to the online store, whether it's a relative profit (profitability, actually the margin the online store can get when it sells a product at a certain sale price) or the absolute gross profit (where the result depends not only on the margin, but also on the number of sales).
The profitability of a product is very important, but if the product doesn't sell well, its gross profits could be lower than the gross profits of some less profitable products.
In either case, the most profitable products can be marked as "featured" products, i.e. the products that are most likely to be noticed by customers of an online store and bought by them.
The Product Listing routine of osCommerce could be changed, so that once a product gets marked as featured, it starts to appear at the very top of each product listing page. Hence, there are more chances for a featured product to be noticed and purchased by customers.
The most profitable brands/manufacturers and categories can be found out in the same way as the bestselling brands/manufacturers and categories, except this time the report will concentrate on profits (as with most profitable products, it's about relative and gross profit).
A special report displaying sales by region of one country, or by countries if the online store trades internationally can help the online merchant to see differences in how customers from different regions or countries buy products, and adjust advertising campaigns in the corresponding regions or countries to ensure the best sale figures.
Alternatively, if customers living in a certain region or country do not buy enough products to even pay for the advertising budget dedicated to that region or country, it may make sense to cease pushing products in that particular region or country, and use the spare budget in other areas where customers are more willing to buy products offered by that particular online store.
There could be multiple reasons why sales by region may differ. But of course, the main one is that some regions would have more prospective customers who are members of the target customer group, and some less. It may also depend on if the online store sells products that most customers would prefer to buy from a more local supplier, or if it doesn't matter if the product comes from another region or even from another country—it's only the product itself and/or its price that matters.
It's important to be able to apply time filters to see how statistics of purchases change.
When looking at the report of sales by region, it also make sense to apply a filter by distance from a certain point, like from a certain post code. Online merchants in many countries can get data that helps to calculate a rough distance between the two post codes. Therefore, it's possible to see how the sale figures change along with the distance from a certain post code.
This could be from the post code of where the online store is located, or where the warehouse is located, or where the most of the target audience is supposed to live.
The report can provide the following information:
Region name (or post code)
Country name (if the online store trades internationally)
Total number of sales
Total number of visitors
Total number of customers
Total amount of sales
Total amount of profits
Average spend by visitor
Average spend by customer (i.e. average order amount)
What part of the online store's profits the region is responsible for (in %)
Some online stores reward their best-buying customers with certain special offers, discount coupons, and so on. Also, if the online store has several customer groups, it's important to be able to see how each customer group performs (i.e. orders online).
The report may contain the following information:
Customer name
Customer email address
Customer group (if there are several customer groups in the online store)
Address (country, region, city/town, and post code is usually enough)
Number of orders placed
Number of products purchased
Total amount of purchases
Total profit
What part of the online store's profits the customer is responsible for (in %)
The summary by customer group can be run as a separate report with similar columns.
It's important to be able to apply filters by:
Customer name
Total amount of purchases
Number of orders placed
Number of products purchased
Address (country, region, city/town, and post code)
Customer group (if there are several customer groups in the online store)
Referring source
And of course, time period
Best-buying customers could be rewarded by a discount coupon. Or their customer group could be changed to reward them with better prices on products should they choose to buy from the same online store in the future.
One of the most important reports for an online merchant is the report by net profit. It's the report that actually shows how the online store performs and how efficient the business is, and what should be changed or improved to help the online store perform better and achieve certain targets.
This report could be run as a relatively simple MS Excel spreadsheet. Before it can be compiled, it requires the online merchant to already know certain parameters of the business, such as:
Average number of orders per day
Average order amount
Average margin (in %)
Average order processing cost (P & P)
General conversion rate from visitors into customers
Average cost per paid visit
How many paid visitors does the online store have compared to the total number of visitors (in %)
Non-operational expenses (such as rent, website support, bank monthly fees, etc.)
Once those business parameters are known, it's possible to compile a report that would show:
Required number of visitors to achieve a desired number of orders per day
Turnover based on the desired number of orders per day
Gross and net profits, again based on the desired number of orders per day
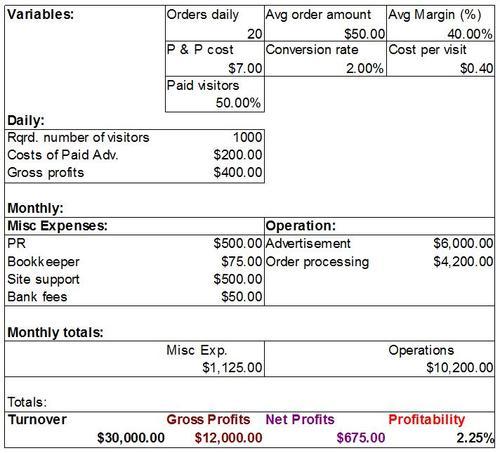
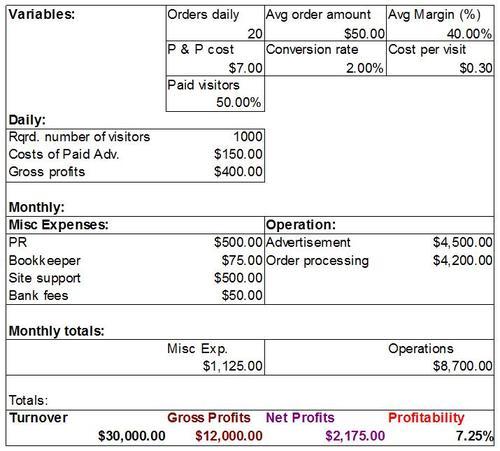
Here, the required number of visitors per day is calculated by dividing the desired number of daily orders by general conversion rate.
Cost of paid advertising (pay-per-click advertising here) is calculated as a multiplication of the required number of daily visitors, average cost per visit (click), and average percent of visitors referred by the pay-per-click means of advertising.
Gross Profits is a multiplication of the desired number of daily orders, average order amount, and average margin.
Net Profits is the difference between the turnover (which, in its turn is the multiplication of the average order amount, the desired number of daily orders, and the number of days in a month—30 in this example) and operational expenses (order processing and pay-per-click advertising), and miscellaneous expenses (such as PR costs, bookkeeper services, support of the website, and bank monthly fees in this particular example).
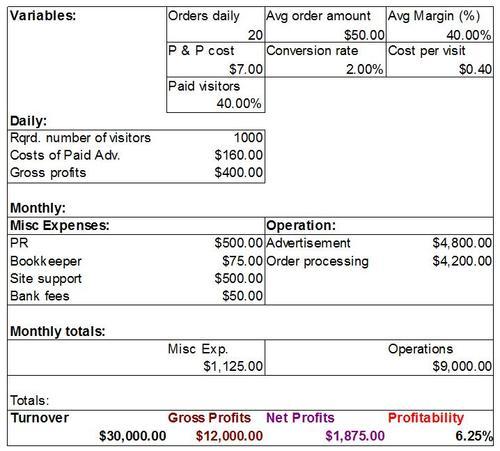
This sample report shows that having 20 orders per day, with average order about of $50, and average margin of 40%, order processing cost $7, conversion rate from visitors to customers 2%, average cost per paid visit $0.40, and at least 50% of visitors referred to the online store by the pay-per-click advertisement, also having certain non-operational monthly expenses $1,125 in total, the online store can actually make only $675 net profit per month, despite having a turnover of approximately $30,000! The profitability of such business is only 2.25%.
This clearly shows us that the business is not very profitable after all, and the online merchant should work hard on improving the situation in order to make enough money.
For example, the online merchant may want to put 30 orders per day as a goal.
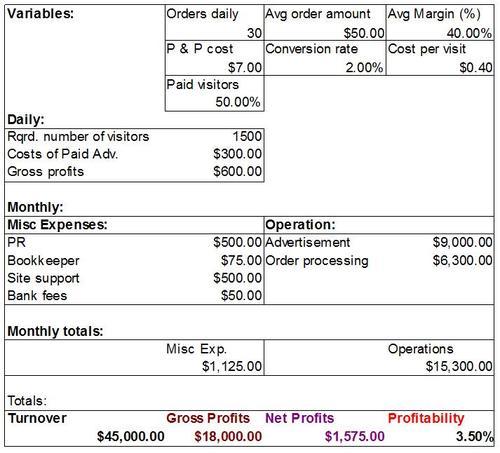
If that goal is achieved, with all other parameters left intact, net profits of the business will be approximately $1,575 per month with monthly turnover of $45,000. It's already a bit better, as the profitability of the business will grow to 3.5% then.
By increasing the number of orders placed by visitors to the website, the online merchant reduces the effect of order processing costs and cost per paid visit on net profit figures. Note that in order to achieve the required 30 orders per day the online store would have to attract at least 1,500 visitors daily.
The good news is that this report doesn't take into account orders placed by repeat customers—such orders are more profitable as there's no expenditure on advertising involved there, and cost per customer acquisition is spread across several orders placed by the customer.
We will continue learning how different parameters affect the efficiency of the business.
If the online merchant manages to increase the average order amount to $60, leaving the number of daily orders equal to 20, it will make a significant impact on the profitability of the business keeping all other costs the same.
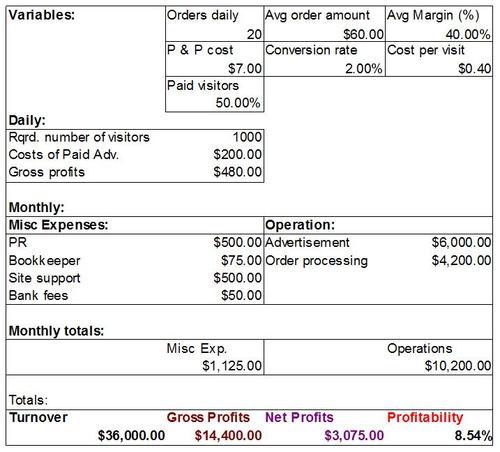
With a turnover of $36,000, the online store would produce $3,075 worth of net profits per month, and the profitability of the business would then grow to to 8.54%!
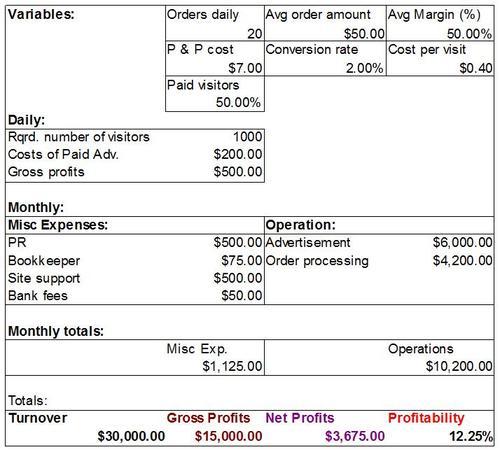
If the online merchant could negotiate better terms with suppliers, and the average margin grew to 50%, it would make an even more dramatic affect on the profitability of the business, because with the same turnover of $30,000, the online store would be now making $3,675 net profits each month—it's a 12.75% profitability.
If the online merchant could improve the order handling process and the order processing fee dropped to $5, making the same turnover of $30,000, the online store would be now making $1,875 at 6.25% profitability level.
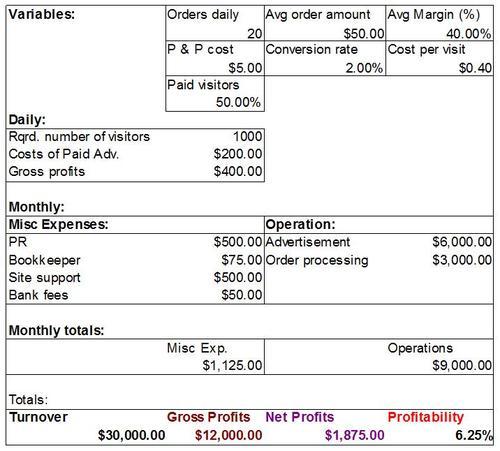
This shows that changes in order handling and processing fee affect profitability of the business, but not as much as changes in the average order amount, and average margin.
Looking into how the conversion rate affects the business profitability, we can see that changing the conversion rate to 3% from 2% changes business profitability from 2.25% to 8.92%, leaving the turnover intact.
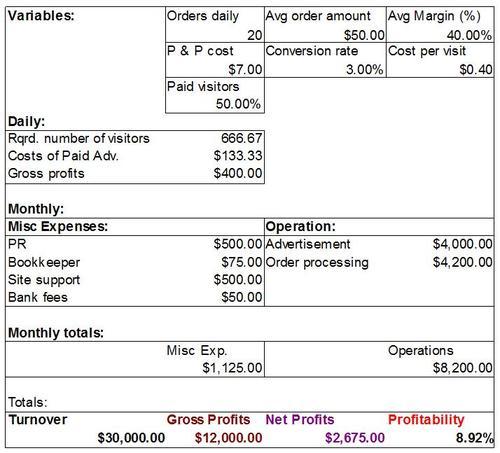
Of course, it's not very easy to improve the general conversion rate of an online store; this requires a lot of work and sometimes serious investments in improvements of usability of the website.
How does the cost per paid visit affect the business's profitability? If the online merchant can negotiate better costs per click with other websites, say to $0.30 per click instead of $0.40 per click, or find other websites ready to provide the same amount of traffic for lower pay, it will affect the profitability of the online store too, in fact, it will improve to 7.25%, giving $2,175 net profit with the same turnover of $30,000.
By working hard on search engine optimization of an online store, by making it more search engine friendly, the online merchant can also achieve better profitability of the business. If the number of users referred either by other means of advertising than pay-per-click, or simply by search engines grows to 60%, leaving the number of users referred by pay-per-click advertising at 40%, it will change the profitability of the business to 6.25%, which with the same turnover of $30,000 gives the online merchant $1,875.
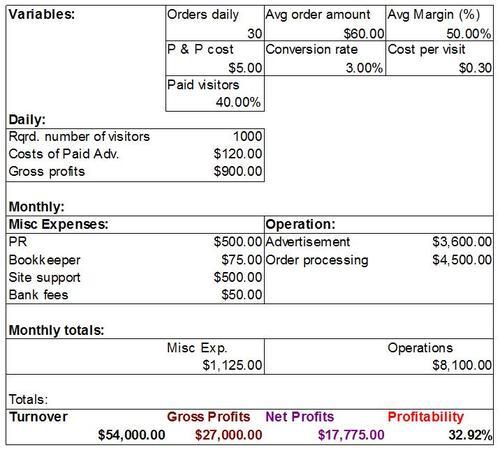
In an ideal situation, which may never be achievable but is still something the online merchant needs to try to achieve, all those parameters would be improved as in the following table. Priftability would have changed to a fantastic 32.92% then, making the online merchant $17,775 each month with the turnover being $54,000.
As a conclusion, the online merchant should constantly work on increasing the average order amount, average margin, general conversion rate, and the number of visitors referred by search engines and by means of advertising other than pay-per-click. The online merchant should also work hard on reducing order processing costs, and cost per visit in pay-per-click advertising to ensure the constant growth of profitability of the business and amount of net profits.
Depending on the number of orders the online store receives daily, parameters like order processing costs and cost per visit/click may have a stronger or weaker affect on the profitability of the online store.
If the business setup of an online store includes warehouse and stock management, it becomes essential to know which products are in stock, which products are likely to be out of stock soon, and when products ordered from suppliers are to come back to stock.
There is no built-in report for stock management in osCommerce, therefore new reports should be created.
This report can be the basic and most important for stock management in osCommerce. It should list all products with their stock figures, allow for applying various filters, and display summary by category and manufacturer/brand.
The report may include the following columns:
Product name
Product model
Product category
Product manufacturer
Product cost
Free stock quantity
Free stock amount (multiplication of product cost and free stock quantity)
Allocated stock quantity (i.e. product's stock allocated to all orders with status different from "dispatched")
Calculated "run out" date (based on the previous sale history for a particular product)
Back to stock date
Filters by the following parameters could be applied:
Product name
Product code
Category
Manufacturer
Free stock
Allocated stock
Run out date
Finding products belonging to the same manufacturer that have the same or very similar calculated "run out date" allows the online merchant to place larger purchase orders with suppliers of products. This usually allows for buying the products more cheaply and eventually, increasing business profitability.
Further similar reports could be created for categories and manufacturers/brands. The following columns could be included into such reports:
Name (of either category or manufacturer/brand)
Average product cost
Total free stock quantity
Total free stock amount (sum of all products' free stock amounts)
Total allocated stock quantity
The report by product stock could be used for stock take. It should be printed by the online merchant or the warehouse manager and then all stock could be checked against figures on that printout.
The turnaround report (which can be created either for manufacturers/brands or categories) is a report that displays how fast the orders are processed from the moment the customer places an order to the moment the order is sent to the customer.
Turnaround depends on whether the online store has enough products in stock, and of course on how fast the order is processed by the Administration or the warehouse team of the online store. If the online store doesn't use its own warehouse and doesn't have any stock, the turnaround report will not play an important role in determining efficiency of the online store because turnaround on all or most of the orders will always be immediate.
The report can be run on either manufacturers or categories; the following columns could be made available on that report:
Name (category or manufacturer/brand)
Allocated stock (i.e. stock assigned on orders with status other than dispatched)
Average turnaround
The turnaround report can help the online merchant to determine manufacturers/brands or categories that are usually dispatched to customers very promptly, and those manufacturers/brands or categories that usually delay dispatches.
Corresponding measures could be taken to improve the situation, and reduce the order processing time. The faster the orders are processed, the sooner the space in the warehouse will be free again to put new products there, and the sooner the online store gets paid, as many online stores do not charge the customer the full order amount until the goods are dispatched. Also, the sooner the order is dispatched, the sooner the customer gets the order. This affects the customer's satisfaction with the delivery service, and with the online store overall.
Knowing your customers, being able to communicate with different customers and accordingly to address their needs and stimulate to them to order is one of the most important tasks of an online merchant.
The standard installation of osCommerce doesn't provide reports that could help the online merchant to see how customers buy online; also there are no built-in facilities for getting the lists of customers who bought certain products but didn't buy other products, or created an account with the online store but never placed an order, etc.
This report can help an online merchant or marketing manager of an online store to split customers into target groups by their previous order history.
As soon as customers belonging to this or that group are identified, the list of customers could be used to send a special newsletter, discount coupons, etc.
Columns on the report would not be very much different from those of the report on best-buying customers, and would include:
Customer name
Customer email address
Customer group (if there are several customer groups in the online store)
Number of orders placed
Address (country, region, city/town, and post code is usually enough)
Number of products purchased
Total amount of purchases
Total profit
What part of online store's profits the customer is responsible for (in %)
It's the filters that would make that report different and especially useful for marketing purposes:
Customers who bought a certain product (by name and model)
Customers who bought products of a certain manufacturer/brand
Customers who bought products belonging to a certain category
Customers who first created an account during a certain period of time
Customers who placed orders during a certain period of time
Customers who live in a certain area
Customers who didn't buy certain products, or products of a certain manufacturer/brand, or products belonging to certain categories
Customers who didn't buy during a certain period of time
Customers who do not live in a certain area
Customers who placed not less than a certain number of orders
Customers who placed not more than a certain number of orders
By implementing those filters and making them work together when required, it becomes possible to easily split customers into target groups for marketing purposes.
The list of customers brought up by such a report could be exported into CSV or XML format for further use.
Having multiple lists of customers who placed orders with the online store or, on the contrary, never did buy from the online store allows for very flexible marketing approaches.
For example, customers who bought product A and didn't buy product B from the online store could be offered product B with a discount as product B is related to product A (like customers who bought a digital camera, product A, may be interested in a tripod, product B, and vice versa). To get the list of such customers, the online merchant or marketing manager of the online store would specify a filter—customers who ever bought product A, and never bought product B—then get the list of customers, and contact them with special offers on product B (or on the category of products that product B belongs to).
Another example would be to get a list of customers who used to buy from the online store, but didn't order for the last couple of months. Filtering by the total number of orders placed by the customer, by customer account registration date, and by the date when the last order had been placed will help to get the desired customer list.
A brief reminder letter could be sent to such customers, with the newest product catalog entries advertised there and possibly with a question asking why the customer has stopped ordering products from the online store.
It makes sense to announce new products of certain brand to customers who bought products of either that brand or the same category before. It also makes sense to send the latest industry news and news received from manufacturers to such customers.
Those customers who registered their account with the online store but never placed any online orders could be sent an email reminder, and again, the newest products and special offers could be a part of that email.
Customers on the lists could be sent a newsletter to, using either the standard osCommerce newsletter feature, or some third-party solution.
Technical aspects of sending newsletters to customers have been covered in Chapter 2 of this book.
It makes sense to use osCommerce when the hosting company where the online store is located allows for sending newsletters to a reasonable number of recipients, and the number of customers in the list complies with those requirements. It makes sense to use third-party services otherwise, when there are too many customers on the list, or when the online merchant would like to get some better tracking of customer responses, bounced back emails, unsubscribe requests, etc.
Time of the day, day of the week, and day of the month may be important when sending a newsletter to customers. Ideally, the newsletter should arrive to the customer's mail box when the customer has free time to read it, and also is likely to be ready to buy products.
If it's known that most of the prospective customers get paid by their employers on the 20th of each month, it makes sense to send a newsletter on the 19th of the month, to ensure the customers have seen it a day before or on the very day when they get paid. Or if it's known that a large number of prospective customers would use the Internet at home during the weekend, it makes sense to send a newsletter on Friday lunch time, so that the customers would be able to see it and think over the announced special offers over the weekend.
The standard installation of osCommerce doesn't provide the online merchant with enough reporting facilities that could help the online merchant to improve the product catalog, improve communication with the customers, and make the online business more efficient.
Fortunately, as always with osCommerce, it's a very flexible solution and can be improved. A number of additional reports can be created to assist the online merchant when making business decisions. Each report should be sortable by its columns, it should be possible to apply filters, totals or average value for each column should be calculated, and it should be possible to export the report into either CSV or XML, or print it out.
Obviously, it's very important not only to be able to create those reports, but to read and understand them.
Reports can help an online merchant to plan the advertising budget, re-arrange advertising campaigns, track and to some degree forecast sale figures, find bestselling and most profitable products, manufacturers, and categories and highlight certain products by marking them as featured, locate best-buying customers and reward them, track stock and ease re-ordering of the most popular products from suppliers, track customers and use previous order history for marketing purposes, send targeted newsletters to customers, and even plan the online store's net profit figures and its profitability.
In the next chapter, we will consider how the online store can benefit from having repeat customers, and how to convert customers into repeat customers.