
Chapter 13. Document processing and reporting
- Reading and writing CSV data
- Generating daily reports
- Producing a comparison report
- Generating customized printable reports
Though we’d all love to be video game programmers or lead developers for the Next Big Web 2.0 multimedia experience, most programmers have less glamorous problems to solve. This inevitably includes processing documents exported from sources, ranging from legacy systems to industry-standard SQL databases. Of course, collecting the data and translating it into a useable form is only half the challenge. Aggregated data then needs to be manipulated, analyzed, and formatted in ways that clearly communicate what that data represents. The field of reporting ranges from quick sales reports for a small business to massive statistical analyses for the enterprise.
There are numerous canned solutions for processing one form of document and translating it to another, or for running standard reports against data. For many uses, these applications are the way to go. However, these solutions aren’t golden hammers. When developing custom software, it’s often desirable to get exactly the kinds of results you’re looking for, instead of using prebuilt solutions that may or may not be what you need. For this kind of problem, Ruby shines.
In this chapter, we’ll be looking at several solutions to common reporting problems. We’ll cover processing and formatting libraries such as FasterCSV, and we’ll look at the lightweight reporting system, Ruport. Through these solutions, you’ll be able to see how rolling your own solutions isn’t as scary as it sounds. By providing a solid but malleable foundation to work from, Ruport provides a way to quickly build your own customized reporting applications.
We’ll start with simple CSV processing to show off FasterCSV’s feature set, then show how to use Ruport’s code generator to trivially script a database-backed report that automatically emails its results when run. We’ll then show how you can use Ruby’s text-processing capabilities to compare a CSV file to a nonstandard data format. After covering the ins and outs of data manipulation, we’ll dive into printable documents, showing how you can leverage Ruport and PDF::Writer to generate attractive customized PDF reports. Finally, we’ll talk about how to optimize for performance when dealing with large datasets in Ruport.
13.1. Processing CSV data
One of the most common tasks in document processing is handling CSV data. Used as a generic text format for tabular data from any range of sources, the CSV format is simple and fairly easy to process. However, Ruby’s standard library for handling CSVs is a bit awkward, and also very slow. Luckily, James Edward Gray II’s FasterCSV library has become the de facto standard for CSV processing in Ruby. We’ll take a look at a simple example to show the library in action, and then we’ll go over some of the key features that you might find useful.
To install FasterCSV, simply install the gem:
gem install fastercsv |
Since FasterCSV is pure Ruby, it should work without modification on all platforms.
Problem
You need to read and write CSV data efficiently in Ruby via FasterCSV.
Solution
We’re going to implement a simple currency conversion tool to show FasterCSV in action. The CSV data we will use for this example is quite simple:
Currency,Code,USD/1 Unit,Units/1 USD Andorran Franc,ADF,0.1339,7.4659 Andorran Peseta,ADP,0.005372,186.167 Utd. Arab Emir. Dirham,AED,0.2723,3.6741 Afghanistan Afghani,AFA,0.01998,50.25 Albanian Lek,ALL,0.01136,91.678 Armenian Dram,AMD,0.002895,345.41 NL Antillian Guilder,ANG,0.5682,1.8 |
The small utility shown in listing 13.1 performs conversions to and from any of the currencies listed in the CSV file, using USD as the base currency for interchange.
Listing 13.1. Currency converter
require "rubygems" require "fastercsv" class CurrencyConverter def self.load_data(file,currency="USD") @to_us = {"USD" => 1} @from_us = {"USD" => 1} FasterCSV.foreach(file, :headers => true, :converters => :numeric) do |r| @from_us[r["Code"]] = r["Units/1 USD"] @to_us[r["Code"]] = r["USD/1 Unit"] end end def self.convert(amount,options={}) from = options[:from] || "USD" to = options[:to] || "USD" amount * @to_us[from] * @from_us[to] end def self.high_low_report high, low = @from_us.partition { |code,ratio| ratio < 1 } write_file high, "high.csv" write_file low, "low.csv" end private def self.write_file(data,filename) FasterCSV.open(filename,"w") do |csv| csv << ["Code","USD/1 Unit"] data.each { |record| csv << record } end end end |
As you can see, nothing about the implementation is particularly surprising. Two lookup tables are generated for rates when CurrencyConverter.load_data() is called. It is then possible to make arbitrary currency conversions. For example, you could convert 100 USD to Andorran francs:
CurrencyConverter.convert 100, :to => "ADF" |
You can go in reverse as well (back to USD):
CurrencyConverter.convert 12240.0, :from => "ADF" |
The implementation also allows for non-U.S. to non-U.S. conversion:
CurrencyConverter.convert 100, :from => "ADF", :to => "AMD" |
In addition to this conversion feature, you can see that this little utility also offers a simple reporting facility. It will determine which currencies are higher and which are lower in value than the USD and generate two CSV files, high.csv and low.csv. Providing that you have loaded a CSV file with the exchange ratios, generating this report is easy:
CurrencyConverter.high_low_report |
We end up with two output files:
high.csv: Code,USD/1 Unit XPT,0.0007819 OMR,0.386 GRD,0.7345 ITL,0.7345 DEM,0.7345 low.csv: Code,USD/1 Unit XCD,2.725 SAR,3.7509 RUB,25.6764 NOK,5.8243 NIO,18.743 |
As you can see, FasterCSV makes the task of CSV processing nearly trivial. Of course, it’s worth discussing in a little more detail how the library works, as well as the advantages it offers over Ruby’s built-in CSV standard library.
Discussion
As the name implies, FasterCSV is much faster than Ruby’s standard CSV processor. In most cases, it is about 800 percent faster. Plus, it has more advantages than speed alone. If we look back at the currency conversion code, the CSV processing seems to take a back seat, letting us focus on the actual problem we’re trying to solve. It seems this way because there are a lot of nice things that FasterCSV is handling for us.
If you work with Ruby’s standard CSV processor, there is no direct support for CSV headers. This means that instead of saying r["Code"], you’d be saying r[2] in our example, or rolling your own mapping of names to indices. Whenever you give any of FasterCSV’s reading methods the option :headers => true, it will try to use the first line of a CSV file as the headers, and will automatically allow you to refer to cells by column name in addition to their ordinal position.
Because CSV files might have nonunique column names, FasterCSV supports minimum ordinal indices. The following simple Interactive Ruby (IRB) session shows how a row with two a columns can still be nicely handled using this feature:
>> a = FasterCSV.read("simple.csv", :headers => true) >> a[0].to_a => [["a", "1"], ["b", "2"], ["c", "3"], ["a", "4"]] >> a[0]["a"] => "1" >> a[0]["a",1] => "4" |
Rubyists often enjoy using symbols for keys rather than strings. FasterCSV allows arbitrary conversions of data and has a built-in converter, which makes this trivial:
>> a = FasterCSV.read("simple.csv", :headers => true, ?> :header_converters => :symbol) >> a[0].to_a => [[:a, "1"], [:b, "2"], [:c, "3"], [:a, "4"]] >> a[0][:a] => "1" >> a[0][:a,1] => "4" |
In addition to header conversions, FasterCSV allows you to do conversions on your entire dataset, which we’ll now take a look at. One thing you’ll notice from our calculations is that we never explicitly converted the ratio fields to Float objects. However, it’s pretty clear why we didn’t have to, if you look at the main loading code in listing 13.1:
FasterCSV.foreach(file, :headers => true, :converters => :numeric) do |r| #... end |
The :converters => :numeric code tells FasterCSV to use a built-in formatter to inspect the fields and convert numeric values to their proper Ruby objects (Fixnum, Float, etc.). This comes in handy, as it prevents us from having to do explicit to_f calls for each field that needs to be converted. Other built-in converters are available, such as :date, :datetime, :integer, and :float.
It is also quite easy to build your own converters, if needed. The process is essentially as simple as passing Proc objects that accept a field as an argument and do any necessary manipulations. You might have noticed in listing 13.1 that FasterCSV.open() looks a whole lot like File.open(). Listing 13.2 shows this method in use again.
Listing 13.2. File output for currency converter
FasterCSV.open(filename,"w") do |csv| csv << ["Code","USD/1 Unit"] data.each { |record| csv << record } end |
The primary difference is that instead of a File object, a FasterCSV object is yielded. This object will automatically convert arrays into CSV rows, doing any necessary escaping.
If we had wanted to output to a string instead of a File object, you can use FasterCSV.generate. Our original code could be rewritten as follows:
csv_string = FasterCSV.generate do |csv| csv << ["Code","USD/1 Unit"] data.each { |record| csv << record } end |
This especially comes in handy when generating CSV files in the context of web applications, where you may wish to build files on the fly for download without ever storing them server-side.
For the most part, the fact that FasterCSV acts a lot like a Ruby I/O object makes life a lot easier, since it is very rare to be working with CSV data without the need for I/O operations. We have only scratched the surface here, of course.
Most programmers will encounter CSV processing jobs from time to time. Though we didn’t cover all the edge cases, most jobs will involve some of the basic techniques shown here. You can consult the FasterCSV documentation on its website (http://fastercsv.rubyforge.org/) or in the gem package for more information on special cases.
Of course, CSV processing is only part of the picture. We’ll now take a look at Ruby Reports, which is a comprehensive reporting foundation that makes use of FasterCSV and other popular Ruby libraries to make building custom reporting applications a whole lot easier.
13.2. Generating and emailing daily reports
A common task in reporting is generating scheduled reports. These take on several flavors, but they usually share the same core process: query a database for records that match a given date or time period, process the report, then send it somewhere for use or archival. Here we’ll look at how to solve this type of problem for a basic sales report in Ruport.
Ruport is a gem, so installation is straightforward. We’ll want to grab the latest versions of ruport, ruport-util, and acts_as_reportable, so the easiest way to do this is to grab the ruport/murdoch meta-gem, which can be installed as follows:
sudo gem install murdoch |
Problem
You need to produce simple custom reports based on raw SQL queries, and automatically email their results, all using Ruport.
Solution
We’ll use Ruport’s code generator, called rope, to script away the boilerplate code and cut down on hand configuration. The rope tool is part of the ruport-util package, which is officially maintained by the Ruby Reports developers.
The following commands create a basic code skeleton and then create templates for our report and its controller:
$ rope store_reports $ cd store_reports $ rake build report=daily_sales $ rake build controller=sales |
Our report will run against a MySQL database and email it automatically upon generation. The configuration in listing 13.3 is the minimum necessary to allow us to do so.
Listing 13.3. Rope Configuration (config/environment.rb)
require "ruport" # Uncomment and modify the lines below if you want to use query.rb # Ruport::Query.add_source :default, :user => "root", :dsn => "dbi:mysql:storefront" Ruport::Mailer.add_mailer :default, :host => "mail.adelphia.net", :address => "[email protected]" |
We set up our main report to execute a simple query, and we tell the report to render with the Sales controller. The code in listing 13.4 generates text and PDF output for the report, and emails both upon execution.
Listing 13.4. Sales Report (lib/reports/daily_sales.rb)
require "lib/init" require "lib/controllers" class DailySales < Ruport::Report renders_with Sales def renderable_data(format) query %q{ select product,quantity,customer_name from sales where sale_date = ? order by quantity }, :params => [today] end def today Date.today.strftime('%Y-%m-%d') end end DailySales.generate do |report| report.save_as("sales_report.pdf") report.send_to("[email protected]") do |m| m.subject = "Sales Report for #{report.today}" m.text = report.to_text m.attach "sales_report.pdf" end end |
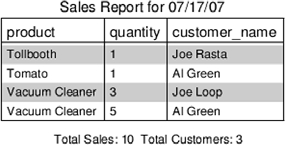
Our controller for this report is fairly simple, as you can see in listing 13.5. It simply calculates the total number of items sold in a day and the number of customers. The formatters display this information, as well as the table that is returned from the SQL query.
Listing 13.5. Sales Report Controller (lib/controllers/sales.rb)
require "lib/init" class Sales < Ruport::Renderer stage :report_table module Helpers def today Date.today.strftime("%m/%d/%y") end def total_sales data.sum("quantity") end def total_customers data.column("customer_name").uniq.length end end formatter :text do build :report_table do output << "Sales Report for #{today} " render_table(data) output << " Total Sales: #{total_sales} " << "Total Customers: #{total_customers}" end end formatter :pdf do build :report_table do title = "Sales Report for #{today} " render_table(data,:formatter => pdf_writer, :table_format => { :title => title }) pad(10) do add_text "Total Sales: #{total_sales} " << "Total Customers: #{total_customers}", :justification => :center end end end end |
The report is invoked by running the following command:
$ rake run report=daily_sales |
You can see the text output next, which is sent as the body of the email:
Sales Report for 07/17/07 +---------------------------------------------+ | product | quantity | customer_name | +---------------------------------------------+ | Tollbooth | 1 | Joe Rasta | | Tomato | 1 | Al Green | | Vacuum Cleaner | 3 | Joe Loop | | Vacuum Cleaner | 5 | Al Green | +---------------------------------------------+ Total Sales: 10 Total Customers: 3 |
The PDF output (shown in figure 13.1) is sent as an email attachment.
Figure 13.1. Ruport’s PDF output
By using rope, you’re automatically given a common structure for your application that is ideal for this sort of problem. At this point, the only task remaining is to hook up scheduling software (such as cron)—but we’ll leave that part up to you.
Discussion
Now let’s look at the parts of this application in more detail. When you run the rope command, you’re actually generating a simple skeleton for Ruport applications. The files generated are listed on the screen when the command is run:
$ rope store_reports creating directories.. store_reports/test store_reports/config store_reports/output store_reports/data store_reports/data/models store_reports/lib store_reports/lib/reports store_reports/lib/controllers store_reports/templates store_reports/sql store_reports/log store_reports/util creating files.. store_reports/lib/reports.rb store_reports/lib/helpers.rb store_reports/lib/controllers.rb store_reports/lib/init.rb store_reports/config/environment.rb store_reports/util/build store_reports/util/sql_exec store_reports/Rakefile store_reports/README |
In our report, we needed to configure our database and mailer information, which was done in config/environment.rb (listing 13.3). For both of these, we showed the most basic form of configuration. If you need to authenticate your SMTP session, the following configuration can be used to connect to an SMTP mail server that requires authentication:
Ruport::Mailer.add_mailer :default, :host => "mail.adelphia.net", :address => "[email protected]", :user => "joe", :password => "secret", :auth_type => :login |
As you can see, it’s simply a matter of providing a username and password and specifying that the mail server uses login authentication. You can also use the following configuration to specify a database username and password and a remote location of your database.
Ruport::Query.add_source :default, :user => "joe", :password => "secret", :host => "192.168.1.101", :dsn => "dbi:mysql:storefront" |
If you are working with a database other than MySQL, you can set the :dsn accordingly. For example, if you’re working with ODBC it would look like this:
:dsn => "dbi:odbc:storefront" |
You can consult the RubyDBI documentation (or our information about DBI in chapter 9) to find out what DSN to use for your data source.
You can see that for both the Mailer and Query configurations in listing 13.3, we’ve called our configurations :default. This is because Ruport will use these sources if others are not specified, but it can handle multiple sources. For example, you could easily define a test database:
Ruport::Query.add_source :test, :user => "root" :dsn => "dbi:mysql:storefront_test" |
In our report, we could rewrite our query to use this test database, as follows:
query %q{ select product,quantity,customer_name from sales where sale_date = ? order by quantity }, :params => [today], :source => :test |
Mailer works in a similar fashion and can be configured through the Report#use_mailer() method if needed.
We’ll now take a look at Report objects and how they tie in with the rest of Ruport.
The main purpose of Ruport’s Report class is to keep report definitions from looking like a shell script. It’s entirely possible to live without it, and when working within other frameworks, it is even advisable to do so. For standalone reports with reasonably basic needs, Report provides a handy base class that simplifies common Ruport tasks.
If we look back at our report definition (listing 13.4), you’ll see it is more or less split into two parts. The first part simply ties a query’s result set to the controller and provides a helper method for formatting dates:
class DailySales < Ruport::Report renders_with Sales def renderable_data(format) query %q{ select product,quantity,customer_name from sales where sale_date = ? order by quantity }, :params => [today] end def today Date.today.strftime('%Y-%m-%d') end end |
The renderable_data method will pass its return value as the :data option to the controller specified by renders_with() when you generate your report.
The second part of our definition is our output generation code, which sends an email of PDF and text output when it is run:
DailySales.generate do |report| report.save_as("sales_report.pdf") report.send_to("[email protected]") do |m| m.subject = "Sales Report for #{report.today}" m.text = report.to_text m.attach "sales_report.pdf" end end |
One thing you might notice is that when you save files to disk, Ruport ensures that the proper formatter is called. This means that this code
report.save_as("sales_report.pdf") |
is equivalent to this code:
File.open("sales_report.pdf","wb") { |f| f << report.to_pdf } |
This should work with arbitrary format definitions, so that save_as("foo.something") will be equivalent to this line:
File.open("foo.something","w") { |f| f << report.to_something } |
By structuring your reports this way, you gain the ability to swap out data sources very easily. It can be useful to work with CSV dumps to design a report, and later hook it up to the actual database. As long as the data is represented in the same way, Ruport doesn’t care where it’s coming from.
This means that if you had a CSV dump of your sales table, you could rewrite just the renderable_data method and not touch anything else:
class DailySales < Ruport::Report renders_with Sales def renderable_data(format) Table("products.csv") end end |
With that in mind, we’ll look at how to avoid raw SQL by using ActiveRecord instead. The change is surprisingly simple. We can get our model hooked up via a simple rake task:
$ rake build model=sale |
We won’t need to change anything for this report, but you can see that the model definition in data/models/sale.rb is quite basic:
class Sale < ActiveRecord::Base acts_as_reportable end |
This allows us to use a method called report_table to get a Ruport::Data::Table back from an ActiveRecord find. Listing 13.6 shows our new ActiveRecord-backed report definition. The Report.generate code and renderer needn’t be changed at all.
Listing 13.6. Sales Report, modified for AR (lib/reports/daily_sales.rb)
require "lib/init" require "lib/controllers" require "data/models" class DailySales < Ruport::Report renders_with Sales def renderable_data(format) Sale.report_table(:all, :only => ["product","quantity","customer_name","sale_date"], :conditions => ["sale_date = ?", today], :order => "quantity") end def today Date.today.strftime('%Y-%m-%d') end end |
You’ll also notice that our controllers don’t look any different from when we used them in the context of rope (in listing 13.5). They’re just the same as you’d use anywhere else. The only particularly interesting bit about these controllers is that they make use of a helper module to encapsulate tasks common to the formatters:
module Helpers def today Date.today.strftime("%m/%d/%y") end def total_sales data.sum("quantity") end def total_customers data.column("customer_name").uniq.length end end |
This module allows us to call these methods in our formatters and fit them into our format as needed. There is nothing tricky going on here—the Helpers module is mixed into the formatters at render time.
You’ve seen here how rope provides a way to partition your code so it can easily be reused without having to write a ton of boilerplate code. The common task of writing a quick report that’s capable of being run by a scheduler and delivered via email to the people that need it should be easy, and rope tries to make sure that it is. We’ll now take a look at how to use Ruport with data that isn’t coming from a convenient source, such as a database or CSV file.
13.3. Comparing text reports to well-formed data
Although it is desirable to report against well-formed data, it’s not always an option. Most systems we deal with from day to day make use of relational databases, or at least offer standardized export formats, but this isn’t true for our legacy systems. Luckily, Ruby is an excellent text-processing language, so it can handle most obscure data formats with ease.
Problem
You need to produce a comparison report that analyzes a flat file and compares it to a CSV data source. Your data looks like the files in listings 13.7 and 13.8.
Listing 13.7. Transaction report, legacy data file
Transaction Report 1/1'6 Through 11/16'6 11/16'6 Page 1 ETS Checking Date Num Description Category ------------------------------------------------------------------------ BALANCE 12/31'5 1/2'6 38-487 misc adj Misc 1/3'6 38-490 John Parlian Sales 1/3'6 38-491 Tolland Sales 1/3'6 38-492 New Alliance... Misc 1/4'6 38-494 James Farall... Misc 1/4'6 38-495 Returned Check Misc 1/4'6 38-496 Craig Winter... Dinners 1/4'6 38-497 York Dinners 1/4'6 38-498 York Misc 1/4'6 38-499 York Sales 1/4'6 38-500 York Sales 1/4'6 38-501 Wooster Sales 1/5'6 38-502 Tolland Sales 1/5'6 38-503 Bankcard Ser... Dinners |
Listing 13.8. Transaction report, CSV database dump
Date,Num,Description,Category 1/2/2006,38487,misc adj,Misc 1/2/2006,38489,John Parlian,Salary 1/3/2006,38490,John Parlian,Sales 1/3/2006,38491,Tolland,Sales 1/3/2006,38492,New Alliance...,Msc 1/4/2006,38493,James Farell...,Salary 1/4/2006,38494,James Farall...,Misc 1/4/2006,38495,Returned Check,Misc 1/4/2006,38497,York,Misc 1/4/2006,38498,York,Misc 1/4/2006,38499,York,Sales 1/4/2006,38500,York,Sales 1/4/2006,38501,Wooster,Sales 1/5/2006,38502,Tolland,Sales |
Solution
The report in listing 13.9 is quite simple, but useful. At work, we use this to catch synchronization issues with a two-way bridge between a legacy system and a standard SQL server. It parses both files to create Table objects, which can then be compared to see which records are missing from each, and which records are different, based on their record numbers.
Listing 13.9. Transaction report analysis script
require "rubygems" require "ruport" require "ruport/util" module Analysis module_function def process_text_file(filename) Table(%w[Date Num Description Category]) do |t| File.foreach(filename) do |r| next unless r =~ /Ad+/d+'d+s{4}d/ row = r.split(/ss+/) row[0].sub!(/'d+/) { |m| "/#{m[1..-1].to_i + 2000}" } row[1].delete!("-") row[-1].chomp! t << row end end end def missing_data(options = {}) from,compare,by = options.values_at(:from,:compared_to,:by) keys = compare.column(by) - from.column(by) compare.sub_table { |r| keys.include?(r[by]) } end def unmatched_data(options = {}) grouping = Grouping(options[:old] + options[:new], :by => options[:by]) Table(options[:old].column_names + ["file"]) do |t| grouping.each do |n,g| if g.length == 2 && g[0] != g[1] t << g[0].to_hash.merge("file" => "old", "Num" => n) t << g[1].to_hash.merge("file" => "new", "Num" => n) t << [] end end end end end table_from_txt = Analysis.process_text_file("checking.txt") table_from_csv = Table("checking.csv") |
The final report generation is fairly simple:
puts "The following data was missing from the Text file " puts Analysis.missing_data( :from => table_from_txt, :compared_to => table_from_csv, :by => "Num") puts " The following data was missing from the CSV file " puts Analysis.missing_data( :from => table_from_csv, :compared_to => table_from_txt, :by => "Num" ) puts " The following data did not match in the two files " puts Analysis.unmatched_data( :old => table_from_txt, :new => table_from_csv, :by => "Num" ) |
This outputs a nicely formatted text report that shows what data is out of sync between the two files:
The following data was missing from the Text file +-------------------------------------------------+ | Date | Num | Description | Category | +-------------------------------------------------+ | 1/2/2006 | 38489 | John Parlian | Salary | | 1/4/2006 | 38493 | James Farell... | Salary | +-------------------------------------------------+ The following data was missing from the CSV file +-------------------------------------------------+ | Date | Num | Description | Category | +-------------------------------------------------+ | 1/4/2006 | 38496 | Craig Winter... | Dinners | | 1/5/2006 | 38503 | Bankcard Ser... | Dinners | +-------------------------------------------------+ The following data did not match in the two files +---------------------------------------------------------+ | Date | Num | Description | Category | file | +---------------------------------------------------------+ | 1/3/2006 | 38492 | New Alliance... | Misc | old | | 1/3/2006 | 38492 | New Alliance... | Msc | new | | | | | | | | 1/4/2006 | 38497 | York | Dinners | old | | 1/4/2006 | 38497 | York | Misc | new | | | | | | | +---------------------------------------------------------+ |
Though the solution for this is basically straightforward, we’re playing with some of the most powerful features in Ruby and Ruport. We’ll take some time to go through some of the more interesting parts in depth, so that you can use these tricks in your own reports.
Discussion
The first task we must deal with, before doing any comparisons or formatting, is parsing the text file input. Our process_text_file() method handles this, building up a table of data as it iterates through the lines of the text file. An individual record in our text file looks like this:
1/2'6 38-487 misc adj Misc |
To keep things simple, we tell our processor to skip any rows that don’t have this basic format:
next unless r =~ /Ad+/d+'d+s{4}d/ |
The actual check is fairly simple. In English, you can read this as: Starting at the beginning of the line, match one or more digits followed by a / character, followed by one or more digits, followed by a ' character, followed by four spaces, followed by a digit.
This means that the pattern is really only matching the following part of the preceding record:
1/2'6 3 |
As there are only three types of data present in our file—header data, empty lines, and records—this check turns out to be sufficient. Only records will match this pattern. By jumping to the next line if this check fails, we can immediately skip processing headers and blank lines.
If we’ve matched a record, we then process it to make it into well-formed data for comparison. Let’s look at it line by line.
Split by at least two spaces:
row = r.split(/s{2,}/) row #=> ["1/2'6","38-487","misc adj","Misc "] |
Convert the year into a four-digit year:
row[0].sub!(/'d+/) { |m| "/#{m[1..-1].to_i + 2000}" } row[0] $=> "1/2/2006" |
Remove the dashes from the Num column:
row[1].delete("-") row[1] #=> "38487" |
Remove the newline from the Category column:
row[-1].chomp! row[-1] #=> "Misc" |
This provides us with a nicely formed record, looking something like this:
row #=> ["1/2/2006","38487","misc adj","Misc"] |
Notice that each field is now in a comparable format to the records in our CSV data. We append the record to the table we’re building up, and the final result of the process_text_file() method a Table object with all the processed records aggregated. Because the CSV is well formed, there is no need to manipulate the data, and it is loaded via a simple call:
table_from_csv = Table("checking.csv") |
With both files processed, we can begin our comparison report.
Figuring out what data is in one file but not the other is simple, because all records have a unique primary key in their Num field. Our missing_data() method definition follows:
def missing_data(options = {}) from,compare,by = options.values_at(:from,:compared_to,:by) keys = compare.column(by) - from.column(by) compare.sub_table { |r| keys.include?(r[by]) } end |
We invoke this method twice: once to show what is missing from the text file, and once more to show what is missing from the CSV file.
In either case, this performs a simple set difference on the values in the Num field to find out which keys are present in one file but not in the other:
keys = compare.column(by) - from.column(by) |
In our “missing from text file” report, this results in keys being set to the two values that are not present in the text file’s Num field, which are:
["38949","38503"] |
We then create a subtable from the CSV data, including only those records that are missing from the text file:
compare.sub_table { |r| keys.include?(r[by]) } |
The result is our familiar text table output, looking like this:
+-------------------------------------------------+ | Date | Num | Description | Category | +-------------------------------------------------+ | 1/2/2006 | 38489 | John Parlian | Salary | | 1/4/2006 | 38493 | James Farell... | Salary | +-------------------------------------------------+ |
The same process is repeated to find the records that exist in the text file but not in the CSV file. As you can see, it is fairly trivial to do this kind of filtering, so long as you have a unique key to work with.
The more interesting part of this report is seeing which records exist in both files but do not match. We use a Grouping object in unmatched_data() to simplify things. The very first line joins the two tables together and then groups them:
grouping = Grouping(options[:old] + options[:new], :by => options[:by]) |
The real purpose of this grouping is to collect the data in groups by their Num fields. This leaves us with two possible group lengths, either 1 or 2. The length 1 groups are ones that exist in only one file, and the length 2 groups are ones that exist in both files. As we’re building up the table for our report, we immediately reject the data that isn’t in pairs, and then compare the first record to the second record to see if they are equal. If they aren’t, we add them to our report:
Table(options[:old].column_names + ["file"]) do |t| grouping.each do |n,g| if g.length == 2 && g[0] != g[1] t << g[0].to_hash.merge("file" => "old", "Num" => n) t << g[1].to_hash.merge("file" => "new", "Num" => n) t << [] end end end |
In the preceding code, we are yielded the group name and actual group object for each iteration. Our group name represents the Num value for the records, and our group object contains our tuple of records, with the old values preceding the new values. We simply append these values to the table we are building up, adding an empty row as a spacer for each group. The resulting table looks familiar:
+--------------------------------------------------------+ | Date | Num | Description | Category | file | +--------------------------------------------------------+ | 1/3/2006 | 38492 | New Alliance... | Misc | old | | 1/3/2006 | 38492 | New Alliance... | Msc | new | | | | | | | | 1/4/2006 | 38497 | York | Dinners | old | | 1/4/2006 | 38497 | York | Misc | new | | | | | | | +--------------------------------------------------------+ |
This allows us to inspect the data very easily and see the rows with unmatched values.
That finishes off all the interesting implementation details of the actual report. However, it’s worth making a comment about the structure of our report definition, as it deviates a little from the norm.
Our solution finds itself very near the crossroads between a quick one-off script and a more structured application. Ruby’s object-oriented model is very pleasant to work with, but to a minimalist, it might seem a little excessive for a problem like this. For this reason, we use a modular design.
By using module_function, we can create modules that encapsulate functions that can be called directly on the module itself, rather than needing to be mixed into another object. This means we don’t need to define a class to hold our functions; the module alone will do.
This provides a namespace for our code to live in, which means that we can reuse bits of this code in other scripts without worrying about a method name like process_text_file clashing with other definitions. This sort of structure is ideal for scripts that are around this size and complexity. It makes the code still easy to test, which is something you throw away with one-off scripts, and it still prevents you from having to manage state, which is inevitable if you use an object-oriented solution.
It’s very common to reuse bits and pieces of reporting code, so structuring your scripts in this way may make it easier for you to do so without having to think much about design.
As you can see, it is quite easy to quickly parse a nonstandard text format and then compare it to other data using Ruby’s regular expressions and Ruport’s table-manipulation capabilities. Though this report was somewhat basic, the general approach is useful for more complex applications as well.
We’ve covered a lot of useful material so far, but you can’t exactly call the reports we’ve been generating beautiful. We’ll now take a look at how Ruport handles printable document output, which provides some better eye candy than we’ve been offering so far.
13.4. Creating customized documents for printing
Generating customized printable reports is something most programmers will need to do from time to time. Though Ruport handles the most common cases without any modification, you’ll often need to extend its PDF formatter to get the results you need. We’ll walk through a common PDF formatter extension to show how to begin customizing your reports.
Problem
You need to produce sharable documents from data groupings, and you want to generate custom PDF documents.
Solution
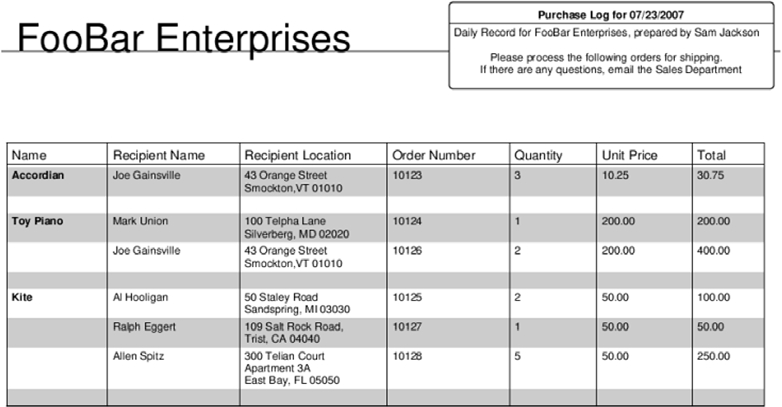
The controller and formatter in listing 13.10 takes a CSV file and does a simple grouping operation on the data. The result is then displayed on a landscaped page, with a header and information panel in addition to the table of grouped data.
Listing 13.10. Purchase Notes PDF renderer and formatter
require "rubygems" require "ruport" class PurchaseNotes < Ruport::Controller prepare :report stage :header, :info_panel, :table formatter :pdf do def prepare_report options.paper_orientation = :landscape end build :header do draw_text "FooBar Enterprises", :font_size => 36, :left => 50 hr end build :info_panel do info = "Daily Record for FooBar Enterprises," << " prepared by #{options.preparer} " << "Please process the following orders for shipping. " << "If there are any questions, email the Sales Department" rounded_text_box(info) do |o| o.radius = 3 o.width = 300 o.height = 80 o.heading = "Purchase Log for #{Date.today.strftime('%m/%d/%y')}" o.font_size = 12 o.x = 450 o.y = 580 end end build :table do move_cursor -50 render_grouping data, :style => :separated, :table_format => { :width => 700 }, :formatter => pdf_writer end end end |
The following code shows how this controller is used:
t = Table("products.csv") puts PurchaseNotes.render_pdf(:data => Grouping(t,:by => "Name"), :preparer => "Sam Jackson") |
Our input CSV is fairly simple:
Name,Recipient Name,Recipient Location,Order Number,Quantity,Unit Price,Total Accordian,Joe Gainsville,"43 Orange Street Smockton,VT 01010",10123,3,10.25,30.75 Toy Piano,Mark Union,"100 Telpha Lane Silverberg, MD 02020",10124,1,200.00,200.00 Kite,Al Hooligan,"50 Staley Road Sandspring, MI 03030",10125,2,50.00,100.00 Toy Piano,Joe Gainsville,"43 Orange Street Smockton,VT 01010",10126,2,200.00,400.00 Kite,Ralph Eggert,"109 Salt Rock Road, Trist, CA 04040",10127,1,50.00,50.00 Kite,Allen Spitz,"300 Telian Court Apartment 3A East Bay, FL 05050",10128,5,50.00,250.00 |
After grouping and applying the formatting we’ve specified, we get nice PDF output, as shown in figure 13.2.
Figure 13.2. The PDF output from our Purchase Notes renderer and formatter
Although it definitely involves rolling up your sleeves, you can see that it isn’t terribly difficult to get really fine-grained control over document rendering.
Discussion
Most customized formatting jobs in Ruport begin with defining a controller. This class is responsible for describing the process that should be carried out by formatters, and it serves as the interface to rendering data in whatever formats you wish to support. For this particular application, our definition is quite simple:
class PurchaseNotes < Ruport::Controller prepare :report stage :header, :info_panel, :table # ... end |
With the preceding definitions, when told to render a specific format, the following hooks will be called on the formatter, in order:
* prepare_report * build_header * build_info_panel * build_table |
Any hooks that are not implemented are simply ignored. This allows the formatters to retain some degree of independence from the renderers. This independence is actually necessary, because the controllers do not need to know about the formatters at all when they are defined. Take a look at our formatter definition:
formatter :pdf do # ... end |
This shortcut interface is simply syntactic, and it is functionally equivalent to this code:
class PDF < Ruport::Formatter::PDF renders :pdf, :for => PurchaseNotes # ... end |
It is this callback that allows us to render our results as follows:
puts PurchaseNotes.render_pdf(:data => Grouping(t,:by => "Name"), :preparer => "Sam Jackson") |
This turns out to be a handy feature. As there is no need to follow a specific convention, format names are simply labels. So for example, if we had used this code,
renders :landscaped_pdf, :for => PurchaseNotes |
our call would look like this:
puts PurchaseNotes.render_landscaped_pdf( :data => Grouping(t,:by => "Name"), :preparer => "Sam Jackson" ) |
Now that we’ve gone through the basic structure of a formatting extension, we can walk through each of the stages of the report and take a look at what’s going on. The first thing to notice is that we are working on a subclass of Ruport::Formatter::PDF, which allows us to gain access to a number of helper methods to do customized PDF output. Because this particular report has many columns, we want a landscaped report. We can set an option for this in our prepare_report hook:
def prepare_report options.paper_orientation = :landscape end |
It is important to set this option before calling any methods that would draw on the PDF object. Once you begin drawing, you cannot change the paper orientation. For this reason, our prepare hook is the best place to put this instruction to ensure it is called before anything else.
Once we’ve established the paper orientation, we can begin drawing our report. Starting with the header, we need our company name in large font, followed by a horizontal rule:
build :header do draw_text "FooBar Enterprises", :font_size => 36, :left => 50 hr end |
We’re doing a bit of measured text here, describing a specific distance from the left margin in pixels. We could have also specified this in terms of ruler measurements, so long as we converted the values before passing them. This would require us to make use of a PDF::Writer helper. For example, if we wanted to place our text two inches from the left margin, we could do something like this:
draw_text "FooBar Enterprises", :font_size => 36, :left => pdf_writer.in2pts(2) |
Of course, you don’t always need to be so specific about where text is placed on the screen. If you want Ruport’s PDF formatter to handle flow control for you, the add_text() method works fine.
In our report, we overlay a rounded text box with additional information. This text box has dynamic elements to it, but they’re mostly trivial. Let’s look at this stage so we can talk about what’s going on with it.
build :info_panel do info = "Daily Record for FooBar Enterprises," << " prepared by #{options.preparer} " << "Please process the following orders for shipping. " << "If there are any questions, email the Sales Department" rounded_text_box(info) do |o| o.radius = 3 o.width = 300 o.height = 80 o.heading = "Purchase Log for #{Date.today.strftime('%m/%d/%Y')}" o.font_size = 12 o.x = 450 o.y = 580 end end |
The rounded_text_box method is fairly straightforward. We provide the body text info as an argument, and set the formatting details and our text box header via the block. All of these fields (with exception of heading) are required to create a rounded text box, so be sure to include them. If you have to draw several similar boxes, you can, of course, create a helper method that simplifies things.
The more interesting part of this code is that we make use of formatting options, allowing us to pass in extra data at rendering time to populate the dynamic parts of our report. If you look back at the code that actually renders the report, you’ll see we pass an option as :preparer => "Sam Jackson". In the preceding code, this is represented by options.preparer. Ruport’s formatting-option system is very simple, and this is one of three ways to use it.
Another way you can invoke this is to use the block form of rendering to access the options object directly:
PurchaseNotes.render_pdf do |r| r.data = Grouping(t,:by => "Name"), r.options.preparer = "Sam Jackson" end |
The options object is shared by the controller and whatever formatter it invokes, so you can actually make use of it in both the formatter and controller as needed. They can also be accessed like an indifferent hash, such as options["preparer"], which can come in handy for highly dynamic reports.
If you want to be sure an error is raised when this option is not set, you can use required_option() in your renderer definition. This will make it so that an invocation like the following will raise a RequiredOptionNotSet error:
PurchaseNotes.render_pdf(:data => Grouping(t,:by => "name")) |
Whether or not you choose to use this feature is entirely up to you, and will probably depend on your needs.
That essentially covers things you can do with options processing in Ruport, so let’s take a look at how data is handled by the formatting system.
The data object we’re passing in is a Ruport::Data::Grouping, and because this already has a built-in formatter that will work for our needs, we don’t need to reinvent the wheel. We can make use of a simple rendering helper to call that formatter. The only caveats are that we need to pass our PDF::Writer object into it to make sure that the grouping renders on our object instead of creating a new PDF file, and that we need to manually position it on our document. The following code does exactly that:
build :table do move_cursor -50 render_grouping data, :style => :separated, :table_format => { :width => 700 }, :formatter => pdf_writer end |
The move_cursor call lets us move our drawing cursor down the page 50 pixels, leaving sufficient room between the start of the table and the end of the header content. When we call render_grouping, we simply pass it our data object, and tell it to use the separated grouping style. We also set some PDF::Writer objects via :table_format. Any attributes you specify via this method are used to set accessors on the underlying PDF::SimpleTable object, which means that you have full control over the table generation. For more details on this, check the Ruport API documentation for Ruport:: Formatter::PDF and possibly the PDF::Writer documentation.
We’ve walked through a nontrivial PDF report that hits some of the common elements you will need: custom headers, text boxes, and tabular output. Though it can get to be a little low-level, you can more or less accomplish anything you might need with PDF::Writer and a little help from Ruport. There are copious PDF examples for Ruport distributed with the source, but you may be able to get by with what you’ve seen here for the most common cases.
One thing worth mentioning is that PDF::Writer has notable performance issues. With this in mind, we’ll now talk a little about doing performance optimizations while working with Ruport.
13.5. Reporting against large datasets
It’s no secret that Ruby is a slow language. Combine this with the common task of generating reports based on anywhere from ten thousand to ten million records, and it seems as if you’re asking for trouble. However, in many cases, it is still possible to squeeze out enough performance to make it worthwhile to stick to Ruby.
Problem
You need to report against a very large dataset without eating up all the resources available to your server.
Solution
For this solution, we’ll build a row-based processor to generate text, HTML, and PDF reports. Although Ruport is most comfortable with processing and formatting tables, it isn’t impossible to work with rows. In fact, Ruport has a built-in row-rendering system that can be easily customized. For this example, we have trivial data, but it spans over 20,000 lines. Here is a small sample of what it looks like:
date,chart,amount 2/20/2007,453175.2S,$325.00 2/20/2007,453175.2S,$300.00 2/20/2007,453175.2S,$250.00 11/17/2006,233089,$58.00 11/17/2006,233089,$58.00 11/17/2006,233089, $- 11/17/2006,233089,$58.00 11/17/2006,233089,$58.00 1/22/2007,233089,$84.00 1/22/2007,233089,$84.00 1/22/2007,233089,$84.00 |
The code in listing 13.11 uses Ruport, PDF::Writer, and FasterCSV to process this data and do the necessary format conversions.
Listing 13.11. Custom row rendering report
require "rubygems" require "ruport" require "pdf/writer" require "fastercsv" class MyPDF < Ruport::Formatter::PDF renders :pdf, :for => Ruport::Controller::Row def build_row pdf_writer.start_new_page if cursor < 50 pad(5) do ypos = cursor draw_text data[0], :y => ypos draw_text data[1], :y => ypos, :left => 150 draw_text data[2], :y => ypos, :left => 250 end horizontal_rule end end pdf = PDF::Writer.new renderer = Ruport::Renderer::Row widths = [10,12,10] File.open("out.txt", "w") do |text| File.open("out.html", "w") do |html| html << "<table>" FasterCSV.foreach("big.csv") do |r| next unless r[2] =~ /d|(amount)/ html << renderer.render(:html, :data => r) text << renderer.render(:text, :data => r, :max_col_width => widths, :ignore_table_width => true) renderer.render(:pdf, :data => r, :formatter => pdf) end html << "</table>" end end pdf.save_as("out.pdf") |
If you noticed, it seems like we’ve unraveled the system a bit, creating our own custom PDF renderer, using ordinal values instead of column-based access, and even resorting to using some of the methods of Ruport’s dependencies directly. The reasons for this can be summed up in two words: speed and memory.
On our machines, this takes about one minute to run. Better than 75 percent of that time is spent generating the PDF, which is over 500 pages long. Since this is all done in pure Ruby, speed usually comes at the cost of elegance.
We’ll now take a closer look at the different techniques used and get a feel for how to attack similar problems when you encounter them.
Discussion
When dealing with smaller datasets, it’s often convenient to think and work in terms of tables rather than rows. This becomes less and less feasible the larger your dataset gets. This is a problem where with every new row, your cost increases in both time and space. By cutting the tables out of the equation, we can process, manipulate, and format each row as we receive it, then let garbage collection pick up the discarded ones as needed.
That’s why in the code, you’ll notice that we only need to store one row at a time, instead of having the whole result set in memory:
FasterCSV.foreach("big.csv") do |r| next unless r[2] =~ /d|(amount)/ text << renderer.render(:text, :data => r, :max_col_width => widths, :ignore_table_width => true) html << renderer.render(:html, :data => r) renderer.render(:pdf, :data => r, :formatter => pdf) end |
The drawbacks of row-based processing are that it makes for uglier code. If we weren’t trying to be conservative about resources, the preceding code could be written like this:
table = Table("big.csv") table.reduce { |r| r.amount =~ /d/ } text << table.to_text html << table.to_html pdf << table.to_pdf |
Nothing here is particularly efficient, and it falls down and dies under high data volumes. You can see in the latter case that column names are automatically detected, but that in our row processor, we need to check for them explicitly:
next unless r[2] =~ /d|(amount)/ |
Though it’s ugly, this lets us filter a specific column without applying the filter to the header row. In cases where simple pattern matching like this won’t work, you may need to take a different approach. Because our data isn’t being rendered as a table, but rather as a series of rows, we need to roll up our sleeves a bit here. Ruport provides a base-row renderer for HTML, text, and CSV, but not PDF. It also requires a little tweaking to make use of the text formatter.
For HTML, you’ll notice that we don’t need to provide any special directives:
html << renderer.render(:html, :data => r) |
HTML turns out to be an excellent format for streaming, because we don’t need to worry about column widths, page breaks, or anything like that for the basic cases. We really just need to generate something like this for each row:
<tr><td>1/22/2007</td><td>233089</td><td>$84.00</td></tr> |
This is exactly what the preceding line of code does, with some whitespace considerations for easier hand-editing. It is implemented very efficiently, and if we were only rendering HTML in this report, it would take less than five seconds to generate the HTML from our CSV.
You’ll notice that the text formatting isn’t nearly as straightforward. We need to make use of fixed column widths and turn off table-width detection:
text << renderer.render(:text, :data => r, :max_col_width => widths, :ignore_table_width => true) |
The problem with doing row-based text output is that in order to format the rows properly, we need to set fixed widths for the columns. For example, if we did not specify column widths, we’d likely end up with something like this:
| a | this is a long field | | bc | this is short | | d | this is another long field | |
By specifying fixed widths, we can get better looking output, more like this:
| a | this is a long field | | bc | this is short | | d | this is another long field | |
In the preceding code, :ignore_table_width => true simply tells Ruport not to try to truncate the table to fit the console, making it suitable for output to file.
As another minor performance note, the text-generation code might have read a little more clearly if we embedded the widths directly:
text << renderer.render(:text, :data => r, :max_col_width => [10,12,10], :ignore_table_width => true) |
However, the problem here is that Ruby would create a new array each time a new record was rendered, and since these values do not change from row to row, we can speed things up a little by defining these values before entering the loop.
Ruport is capable of generating very nice tables using PDF::SimpleTable. This tool is notoriously slow and becomes painful to work with when you have a relatively small number of pages. The reason for this is similar to why tabular output of text is tricky: every cell needs to be inspected in order to figure out the right column widths, and for PDFs, tables also need to properly span pages, reprinting the column names when needed.
Our approach here is to create a very simple, fixed-width PDF output that properly spans pages and is easy to read. The following chunk of code does exactly that:
class MyPDF < Ruport::Formatter::PDF renders :pdf, :for => Ruport::Controller::Row def build_row pdf_writer.start_new_page if cursor < 50 pad(5) do ypos = cursor draw_text "Date: #{data[0]}", :y => ypos draw_text "Chart: #{data[1]}", :y => ypos, :left => 150 draw_text "Amount: #{data[2]}", :y => ypos, :left => 250 end horizontal_rule end end |
This formatter produces the simple output seen in figure 13.3
Figure 13.3. Row-based PDF output
date | chart | amount |
|---|---|---|
2/16/2007 | 170831 | $210.00 |
2/16/2007 | 170831 | $270.00 |
12/29/2006 | 450316 | $330.00 |
12/29/2006 | 450316 | $330.00 |
12/2/2006 | 439626S | $58.00 |
12/2/2006 | 439626S | $58.00 |
12/18/2006 | 288087S | $150.00 |
12/18/2006 | 288087S | $150.00 |
You may have more complex needs for your reports, and you can certainly tweak the formatter a whole lot more before it becomes too costly. You’ll notice that we manually check to see whether we need to advance the page before rendering a new row. This prevents records from spanning multiple pages and provides us with a buffer zone between the end of the page and our last record on the page.
Also remember that PDF is not a format that can easily be streamed, and even if it were possible, the PDF::Writer API does not provide a way to do it. This is why you’ll notice that we need to instantiate the PDF::Writer object outside of the main processing loop:
pdf = PDF::Writer.new |
We then pass this to our row renderer so that it uses this object instead of creating a new PDF::Writer object with a single row each time:
renderer.render(:pdf, :data => r, :formatter => pdf) |
Finally, we can save the full PDF once it has been generated:
pdf.save_as("out.pdf") |
In practice, we’ve found that this approach scales fairly well, so long as you stick to primitive drawing methods, text rendering, and manual page advancement. It’s when you need to either inspect the entire data source before producing a report, or when you need to do complex checks to determine whether or not your data will fit properly on a page or in a column that things slow down greatly.
The general patterns shown here should help when you need to squeeze a little more speed out of a report or conserve some memory. The CSV file in this example can be replaced with any streaming data source, including result sets from databases or other sources, such as files processed with StringScanner.
The key things to remember here apply to most applications, but they’re worth repeating:
- Avoid loading full data structures in memory if they can be streamed
- Use lightweight data structures if possible
- Avoid repeatedly creating new objects with the same values in loops
- Use fixed column widths if possible in formatted output
- Disable as much auto-detection as possible, and tune for your specific problem
- Use lower-level tools when necessary to avoid overhead
If you’re generating batch reports at night, or have processes that can run for a few minutes without causing problems, it’s entirely feasible to use Ruby to process large datasets. If you’re not in that boat, you’ll need to consider ways to parallelize your task, or think about writing C extensions. However, for a lot of common cases, this general approach should do the trick.
13.6. Summary
The five recipes in this chapter should give you a solid base in building reporting applications with Ruby and Ruport, and you should be able to adapt the examples to solve your actual problems. Ruport is ultimately more about helping you define your reporting process and helping with the low-level bits than it is about solving any particular reporting problems. The general approach here will be sufficient to get you well on your way with your work.