
Chapter 5 – Aggregation Function
"Netezza climbed the Aggregate Mountain and delivered a better way to Sum It."
Tera-Tom Coffing
Quiz – You calculate the Answer Set in your own Mind
Aggregation_Table
Employee_No |
Salary |
423400 |
100000.00 |
423401 |
100000.00 |
423402 |
NULL |
SELECT AVG(Salary) as "AVG"
,Count(Salary) as SalCnt
,Count(*) as RowCnt
FROM Aggregation_Table ;
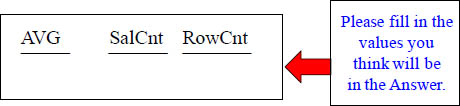
What would the result set be from the above query? The next slide shows answers!
Answer – You calculate the Answer Set in your own Mind
Aggregation_Table
Employee_No |
Salary |
423400 |
100000.00 |
423401 |
100000.00 |
423402 |
NULL |
SELECT AVG(Salary) as "AVG"
,Count(Salary) as SalCnt
,Count(*) as RowCnt
FROM Aggregation_Table ;
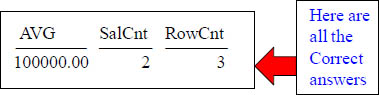
Here are your answers
The 3 Rules of Aggregation
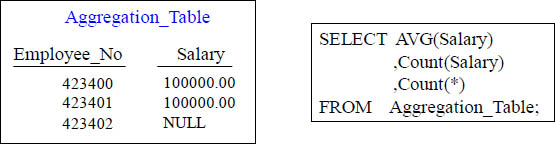
1) Aggregates Ignore Null Values.
2) Aggregates WANT to come back in one row.
3) You CAN'T mix Aggregates with normal columns unless you use a GROUP BY.
![]()
There are Five Aggregates
Aggregation_Table
Employee_No |
Salary |
423400 |
100000.00 |
423401 |
100000.00 |
423402 |
NULL |
There are FIVE AGGREGATES which are the following:
MIN – The Minimum Value.
MAX – The Maximum Value.
AVG – The Average of the Column Values.
SUM – The Sum Total of the Column Values.
COUNT – The Count of the Column Values.
Quiz – How many rows come back?
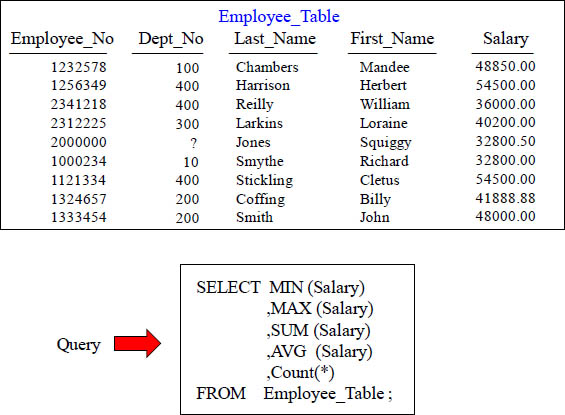
How many rows will the above query produce in the result set? The answer is one
Troubleshooting Aggregates
How many rows will the above query produce in the result set? This query errors!
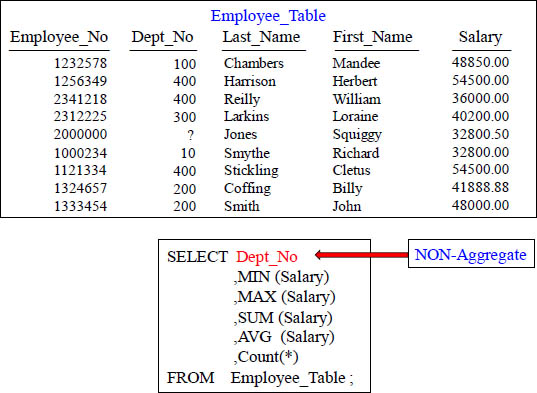
GROUP BY when Aggregates and Normal Columns Mix
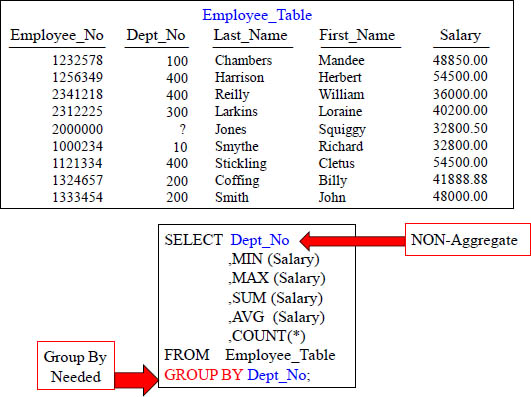
A GROUP BY statement is needed when mixing aggregates and non-aggregates
GROUP BY Delivers one row per Group
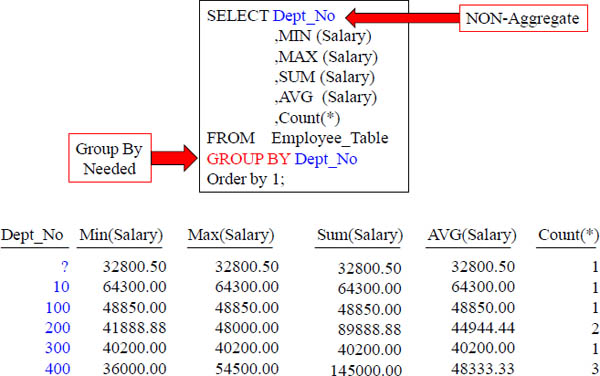
The Group By Dept_No allows for the Aggregates to be calculated per Dept_No.
GROUP BY Dept_No or GROUP BY 1 the same thing
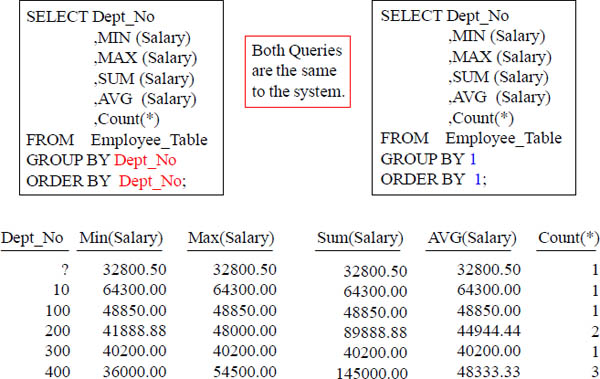
Both queries above produce the same result. The GROUP BY allows you to either name the column or use the number in the SELECT list, just like the ORDER BY.
Aggregates and Derived Data
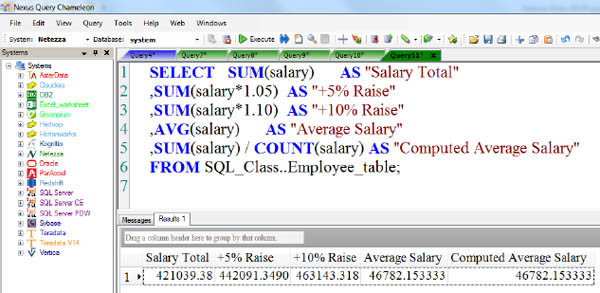
The various aggregates can work on any column. However, most of the aggregates only work with numeric data. The COUNT function might be the primary one used on either character or numeric data. The aggregates can also be used with derived data. The SELECT example above (using the Nexus Query Chameleon) totals the salaries for all employees and show what the total salaries will be if everyone is given a 5% or a 10% raise.
Limiting Rows and Improving Performance with WHERE
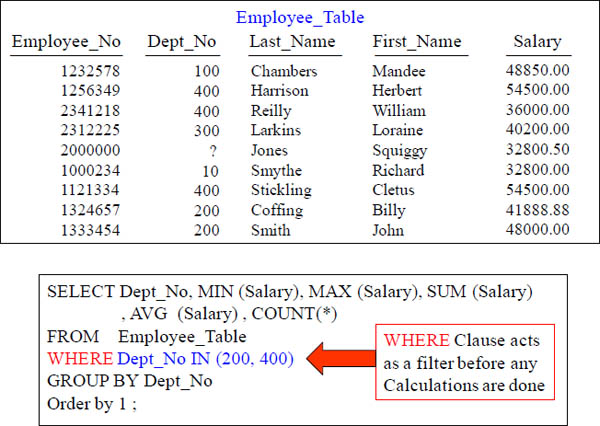
Will Dept_No 300 be calculated? Of course, you know it will...NOT!
WHERE Clause in Aggregation limits unneeded Calculations
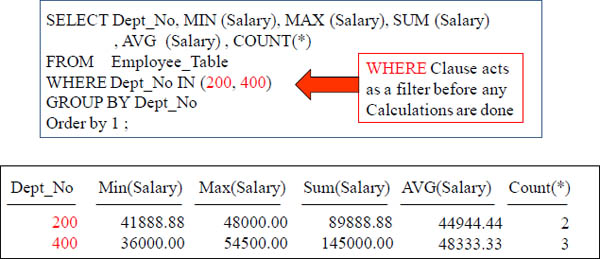
The system eliminates reading any other Dept_No's other than 200 and 400. This means that only Dept_No's of 200 and 400 will come off the disk to be calculated.
Keyword HAVING tests Aggregates after they are Totaled
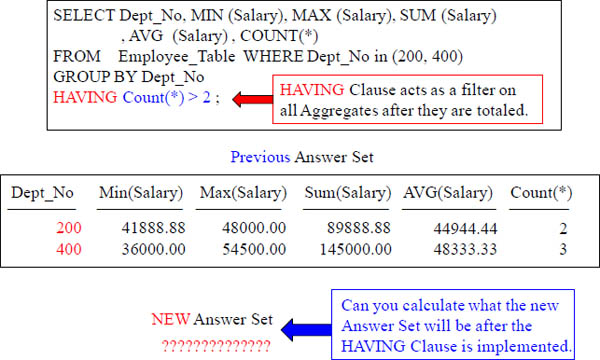
The HAVING Clause only works on Aggregate Totals. The WHERE filters rows to be excluded from calculation, but the HAVING filters the Aggregate totals after the calculations, thus eliminating certain Aggregate totals.
Keyword HAVING is like an Extra WHERE Clause for Totals
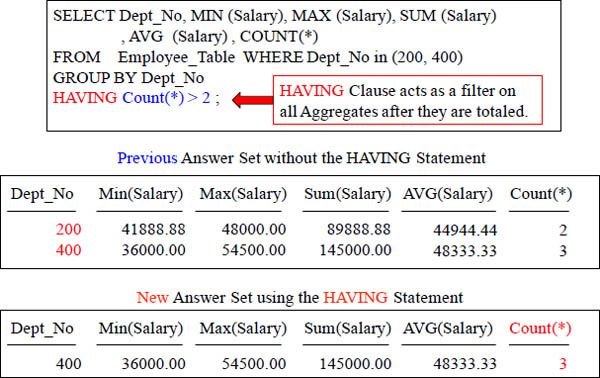
The HAVING Clause only works on Aggregate Totals after they are totaled. It is a final check after aggregation is complete. Now, only the totals with Count(*) > 2 can return.
Getting the Average Values Per Column
SELECT 'Product_ID' AS "Column Name"
,COUNT(*) / COUNT(DISTINCT(Product_ID)) AS "Average Rows"
FROM Sales_Table ;
Column Name |
Average Rows |
Product_ID |
7 |
SELECT 'Sale_Date' AS "Column Name"
,COUNT(*) / COUNT(DISTINCT(Sale_Date)) AS "Average Rows"
FROM Sales_Table ;
Column Name |
Average Rows |
Sale_Date |
3 |
The first query retrieved the average rows per value for the column Product_ID. The example below did the same, but for the column Sale_Date.
Average Values Per Column For all Columns in a Table
SELECT 'Product_ID' AS "Column Name"
,COUNT(*) / COUNT(DISTINCT(Product_ID)) AS "Average Rows"
,'Sale_Date' AS "Column Name2"
,COUNT(*) / COUNT(DISTINCT(Sale_Date)) AS "Average Rows2"
FROM Sales_Table ;
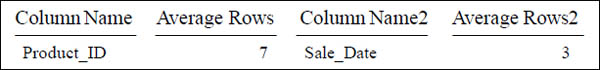
The query above retrieved the average rows per value for both columns in the table.
Three types of Advanced Grouping
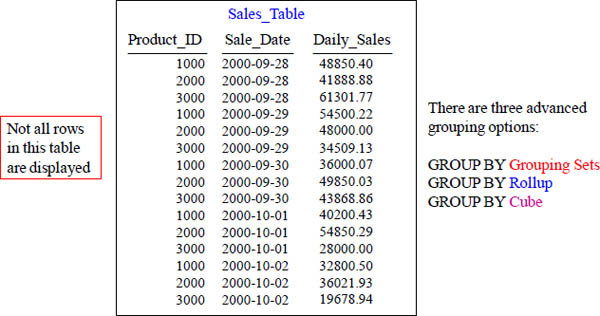
Be prepared to be amazed. There are three advanced options listed above for grouping data. Each is more powerful that the one before. The next pages will give great examples.
GROUP BY Grouping Sets
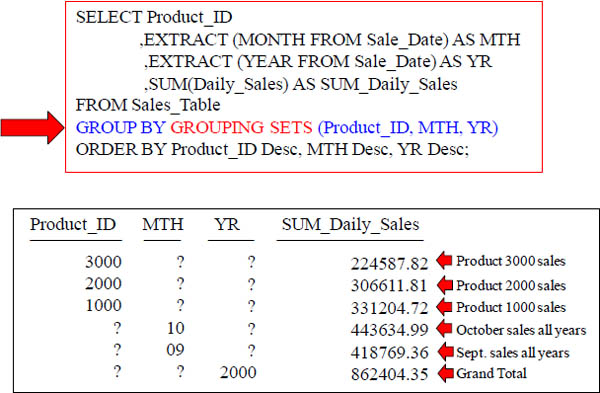
GROUP BY GROUPING Sets above will show you what your Daily_Sales were for each Product_ID, for each month, and for each year.
GROUP BY Rollup
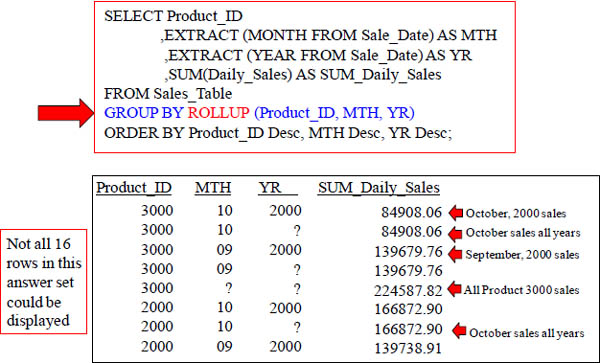
GROUP BY ROLLUP displays what the Daily_Sales were for each Product_ID, for each distinct month, for each month per year, and for each year, plus a grand total.
GROUP BY Rollup Result Set
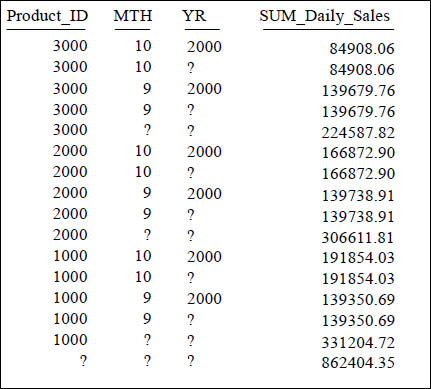
This is the full result set from the previous GROUP BY ROLLUP query.
GROUP BY Cube
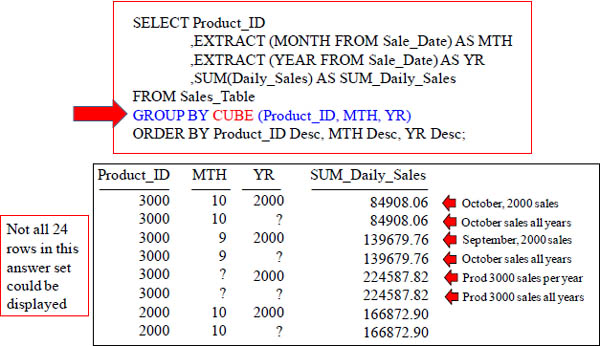
GROUP BY ROLLUP displays what Daily_Sales were for each Product_ID, for each distinct month, for each month per year, and for each year, plus a grand total.
GROUP BY CUBE Result Set
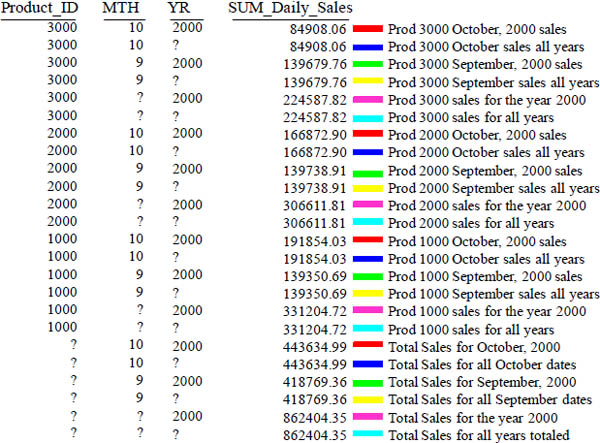
GROUP BY CUBE Result Set
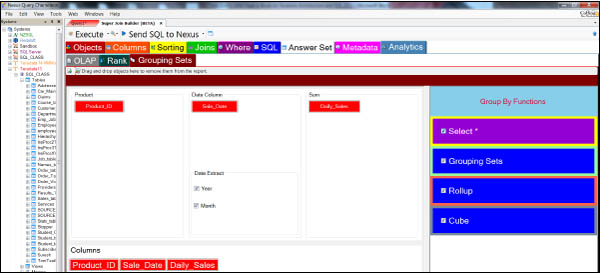
In Nexus, just right click on the Sales_Table and choose Super Join Builder. Then, select all the columns. Then, choose the Analytics tab on the top right. Choose Grouping Sets in the Analytics Tab. Then, drag the Product_ID column to the Product. Drag the Sale_Date to the Date Column. Then, drag the Daily_Sales column to the Sum. Then, Check Box all the Group By Functions on the right of the screen. Then, hit Execute or Send SQL to Nexus. Done!
Testing Your Knowledge
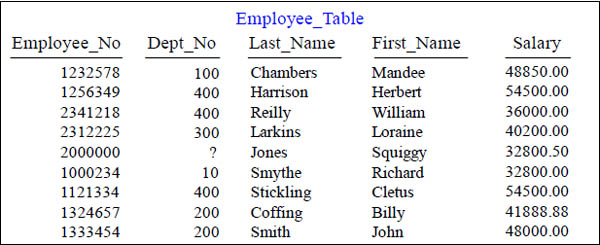
First, SELECT the AVERAGE Salary from the Employee_Table.
Testing Your Knowledge

Now , SELECT the AVERAGE Salary and the SUM of the Salary from the Employee_Table.
Testing Your Knowledge

Now , SELECT the AVERAGE Salary and the SUM of the Salary from the Employee_Table but PER DEPARTMENT(Dept_No).
Testing Your Knowledge

After that, SELECT the AVERAGE Salary and the SUM of the Salary from the Employee_Table but PER DEPARTMENT(Dept_No). However, I only want to see the people from Department 200, 300, 400.
Testing Your Knowledge
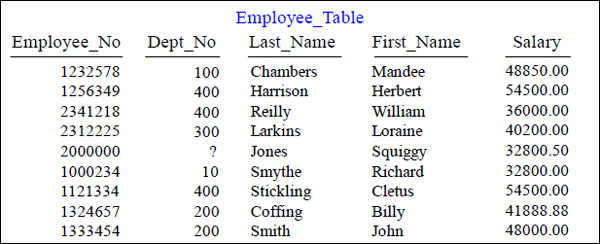
After that, SELECT the AVERAGE Salary and the SUM of the Salary from the Employee_Table but PER DEPARTMENT(Dept_No). However, I only want to see Department 200, 300, 400 which has an AVERAGE Salary of over 43,000.
Final Answer to Test Your Knowledge on Aggregates
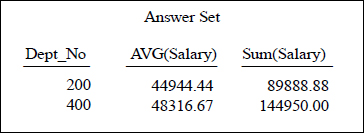
Select Dept_No, AVG(Salary), SUM(Salary)
From Employee_Table
Where Dept_No IN (200, 300, 400)
Group By Dept_No
Having AVG(Salary) > 43000
This should be your final answer set. The query under it should be approximately what you wrote to attain such an answer set. How'd you do?
.