4
Population and Family Planning
S. N. Jha
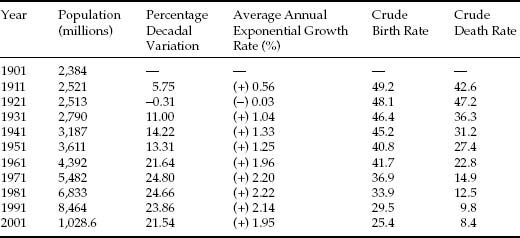
Population and family planning (FP) have formed significant national policy concerns since Independence. The family planning programme (FPP), launched in India in 1952, was one of the largest public health initiatives in the world. India, at that time, was a typically agrarian, low-income country with high birth and death rates. The death rate, at about 28 per thousand in the decade 1941–1950, reflected poor diet, insufficient sanitation, and an absence of effective health services. The birth rate was 40 per thousand in this period, so the rate of natural increase worked out to 12.6. In the 1920s, a historically unprecedented sustained decline in the death rate set in, and, with birth rates still at a high level, population growth was explosive. Birth rates have since declined, but the fall in the death rate has been far greater. In absolute terms, the increase in numbers has continued to be explosive, though, in recent decades, the rate of population growth has shown a tendency to fall (Table 4.1).
Table 4.1
Population growth, birth rates and death rates, India, 1901–2001
Sources:
- Average Annual Exponential Growth Rate:
- 1901–1911 to 1981–1991: Census of India 2001. Provisional Population Totals. Paper 1 of 2001. Statement 2: Population and Its Growth, India, 1901–2001.
- The rates prior to 1971 are calculated from vital registration sources. Due to deficiencies in the Vital Registration System, it could be expected that the rates prior to 1971 are underestimated. Yet, we see an overall trend of CBR and CDR decline.
- For 1981–1991 to 1991–2001: Primary Census Abstract 2001, in Selected Socio-Economic Statistics India 2006, Table 1.5: Growth of population in India over the years. Central Statistical Organization, Ministry of Statistics and Programme Implementation, Government of India.
- Crude Birth Rate and Crude Death Rate:
- 1901–1961: Registrar General, India. Cited on the Web site of the Ministry of Health and Family Welfare, Government of India. “Population Growth, Crude Birth, Death Rates and Sex Ratio India, 1901–2001’. http://mohfw.nic.in/dofw%20website/Health%20&%20Poulation%20Indicators/hpi%20frame.htm
- 1971–2001: Selected Socio-Economic Statistics India 2006, Table 1.20: Vital statistics by sectors over the years based on Sample Registration System in India. Central Statistical Organization, Ministry of Statistics and Programme Implementation, Government of India.
Notes:
- Crude Birth Rate (CBR) and Crude Death Rate (CDR)
- CBRs and CDRs for 1971 onwards are based on the Sample Registration System (SRS) of the Registrar General's office. The SRS was introduced in a full-fledged manner in 1969–1970, with the Registration of Births and Deaths Act, 1969 making registration of births and deaths compulsory. (As reported by the office of the Census Commissioner and Registrar General, Government of India: http://www.censusindia.gov.in/Vital_Statistics/SRS/Sample_Registration_System.aspx). The rates prior to 1971 are calculated from vital registration sources.
- Data on CBR and CDR exclude Bihar and West Bengal for 1971–1978, and for Mizoram from 1995 onwards.
- Growth Rates
- 1991 population includes interpolated figures for Jammu and Kashmir, while 1981 population includes figures interpolated for Assam (interpolations by the Census of India).
- In 1951, the population of Tuensang district (7,025 in 1951) was not censused.
- For calculating the growth rate between 1951 and 1961, the populations of Tuensang (83,501) and Mon (5,774) district of Nagaland were excluded, as they were censused for the first time in 1951 and corresponding figures for the previous census were not available.
THE FAMILY PLANNING PROGRAMME'S CHANGING FACE—CHARTING SHIFTS IN POLICY
Independent India's Family Planning Programme (FPP), which commenced with the adoption of the First Five-Year Plan, was, in its first decade of life, a cautious start to gauge public reaction to the idea of FP; a mere 0.033 per cent of the total plan outlay was allotted to the FPP. The Second Plan, like the first one, emphasized the need to reduce fertility as an important condition for improvement in the level of living. The approach was clinic-based, one of providing FP services for those who voluntarily came forth. This approach was not very successful, however. At the end of the Second Five-Year Plan, only 411 clinics were set up, all failing to attract the expected number of clients. By 1961, the population growth rate had reached about 2 per cent per annum. The failure could be partly attributed to a high level of illiteracy, weak transport and communication networks and, last but not the least, a high mortality rate (which gives an impetus to high fertility as a compensatory mechanism).1
Following a rethinking of the clinic-based character of the programme, an education extension approach was introduced in the Third Plan (1961–1966), in which health workers were to visit women of child-bearing age to motivate them to limit family size. Further, the FPP was made an integral part of the public health departments of all the states, and of the services rendered by all the government hospitals and public health agencies. The allocation in the funds for the programme also increased significantly.
The education extension approach was, however, soon eclipsed by the departmental preoccupation with targets—what Srinivasan has called the HITTS model (health department operated, incentive-based, target-oriented, time-bound and sterilization-focused programme).2 In 1966–1967, annual targets were fixed for the number of acceptors for the different methods of contraception, and the service providers were given targets to fulfil.3 There were incentives not only for the acceptors of vasectomy and tubectomy but also for the motivators. A department of FP was set up at the Centre and the departments of health in the states became Departments of Health and Family Planning.
The allocation of plan funds to the programme in the Fourth Five-Year Plan (1969–1974) increased to almost 2 per cent of the total plan outlay, and there was a massive expansion of infrastructure. Sterilization camps were held on a mass scale, abortion was legalized (the Medical Termination of Pregnancy Act came into effect in 1972) and the minimum age of marriage for girls was increased to 18 years.
Later, the FPP came to be included in the priority sector initiatives of the Fifth Plan (1974–1979) and was, in the plan period, marked by an increasing integration of FP services with those of health, nutrition and maternal and child health (MCH). It is encouraging to also note that the Minimum Needs Programme that was formulated in this plan combined the three sectors of health, nutrition and fertility reduction. At the same time, the earlier, target-based elements in the programme were retained. The plan document fixed a demographic goal of lowering the birth rate from 35 per thousand at the beginning of the plan to 30 per thousand by 1978–1979, and sterilization camps were organized with increased frequency. A coercive element came to the fore with the imposition of the Emergency in 1975. Enforcement of targets became rigid, and compulsory sterilization was introduced.
In 1977, a comprehensive National Population Policy (NPP) was framed for the first time. It called for ‘frontal attack on the problems of population’. Central government assistance to the states was linked to the states’ performance in the sphere of FP, and allotment of jobs, promotions, housing and loans were made subject to family size. The minimum age at marriage for girls and boys was sought to be enforced with rigidity, and the representation in the state legislatures and in the Parliament was frozen up to the year 2001, according to the population enumerated in the 1971 census, to safeguard against the possibility of a state having to lose out on political representation on account of its successful fertility control programme. In spite of the stringent and coercive measures, however, the targets spelled out in the plan document could not be met, and even at the end of the Sixth Plan period, the birth rate was 33 per thousand. One of the main reasons for the gap between target and achievement was poor performance in the states of Uttar Pradesh, Bihar and Rajasthan. Government evaluations identified the failure to adequately generate active interest in the public and an absence of adequate community participation in the programme as the reasons behind the shortfall in achievement. Moreover, the acceptance of the small family norm was problematic; lack of motivation was a major constraint.
With the coming in of a new government in the post-emergency period, the FPP underwent a drastic change. It was renamed the Family Welfare programme, and the policy of coercion to meet the target figures for sterilization was completely given up. The policy statement ‘Family Welfare Programme, 1977’,4 reaffirmed the voluntary nature of the Family Welfare Programme. The emphasis was more on education and motivation rather than targets. Subsequently, the period 1977 to 1980 also saw a massive decline in the figure for the acceptors of FP, particularly vasectomies.
The Sixth Plan, for the period 1980–1985, continued the emphasis on the voluntary nature of the programme, in spite of the change in government. The plan document called for greater participation of the states; greater decentralization and intensification in the role of voluntary agencies; public participation for social change; and an attitudinal acceptance of FP. The plan document set the long-term demographic goal of achieving a net reproduction rate (NRR) of unity for the country as a whole by 1996 and for all the states by 2001. The target-based and time-bound programme was revived, with greater emphasis on birth spacing and child survival rather than on sterilization. The earlier strategy of mass camps and aggressive pushing of sterilization was given up. In this period, tubectomy was on the rise. It became the dominant method of FP, as, given the memories of the emergency period, fewer males came forth for vasectomies. Also, the availability of birth-spacing methods was limited.
As evidence of the continued importance given to FP, a Working Group of Population Policy was set up by the Planning Commission in 1980. The group identified a ‘synergistic relationship’ between population and development programmes, and pointed out that a failure to recognize this would have grave social, economic and political consequences for the country. A two-pronged strategy was called for to develop the necessary level of demand and to supply the services needed by the people. Health care, education, water supply and economic factors such as employment, per capita income and urbanization were identified as the principal factors with linkages to fertility. Organizational features were considered important as well; an institutional framework in the Planning Commission and the Government of India was thought necessary to bring about a better coordination at all levels. The need for the creation of an extensive database and a comprehensive health information system too were emphasized.
This plan period also saw the introduction of a new National Health Policy aimed at ‘securing the small-family norm, through voluntary efforts and moving towards a goal of population stabilisation’.5 The policy stressed a range of issues, including removal of bias against the female child, importance of immunization, care of pregnant and lactating mothers, popularization of acts such as medical termination of pregnancy (MTP) act and Minimum age at Marriage Law, by effective and imaginative use of multimedia and interpersonal communication strategies; making services more accessible; greater public participation by involving the elected peoples’ representatives, Village Education Committees, and Mahila Mandals in the programme; effective enforcement of laws such as the minimum age at marriage law; and close monitoring and regular follow-ups. West Bengal, Uttar Pradesh, Bihar and Madhya Pradesh were identified as states requiring special attention.
More specifically, two factors were identified as critical to the improvement of the demographic profile. The first of these, infant mortality, continued to be at disturbingly high levels. From the demographic point of view, this has a special import, for it is only when couples are confident of child survival will they be willing to opt for fewer children; consequently, reductions in the infant mortality rate (IMR) are critical to the acceptance of the two-child norm. The major causes of the high IMR were identified to include infection (such as respiratory disease, diarrhoeal disease and others), dehydration and malnutrition. High morbidity and mortality among infants and children were attributed also to common communicable diseases like diphtheria, whooping cough, tetanus, poliomyelitis, childhood tuberculosis and typhoid fever. These were to be controlled through the immunization programme under each plan period. Efforts were to be directed towards achieving self-sufficiency in the production of vaccines, and extensive immunization programmes were to be popularized with the help of media.
The second of the two critical factors—the high level of maternal mortality—reflects the need for better medical attention for expectant mothers.6 ‘Health care for mothers and children’ was sought to be strengthened through the primary health care (PHC) approach, which included integrated, comprehensive MCH care and strengthening of referral services. While the Medical Termination of Pregnancy Act (1971) provided the legislative measure for improving maternal health through the stipulation of conditions under which pregnancies may be terminated, the gradual progress in the programme required making MTP readily available to women. The popularizing of MTP included both intensive education and publicity. At a more fundamental level, the care of pregnant and nursing mothers was to be popularized through education, as also through the media.
Overall, the framework of FP sought to provide greater flexibility to the states with respect to the programmes relating to birth-spacing and ‘couple protection’, especially for the younger age group. Special Information, Education and Communication (IEC) campaigns were to be organized to remove the bias against female children, and the media was to play an important role in this regard. Village Health Committees and mahila mandals were to be actively involved in these programmes.
The Seventh Plan (1985–1990) continued with the emphasis on the voluntary nature of the programme, promotion of birth-spacing methods, community participation and MCH care. The integration of the family welfare programme with health, especially of children and pregnant and lactating women, was continued. The Universal Immunization Programme and MCH activities were replaced with a broad-based Child Survival and Safe Motherhood (CSSM) programme, started in 1990–1991 in collaboration with UNICEF. In 1990–1991, for effective community participation, Mahila Swasthaya Sanghs were constituted at the village level.7 The plan saw a continued attempt to make available services nearer to the doorstep; one health sub-centre was established for every 5,000 people in the plains, and one for every 3,000 people in hilly and tribal areas. Likewise, the Post Partum Programme was extended to the sub-district level hospitals, and by the end of the plan period, 1,012 sub-district level hospitals and 870 health posts were established in the country. In other important developments, a project for improving PHC in urban slums in the cities of Bombay and Madras was taken up with assistance from World Bank and Area Development Projects implemented in selected districts of 15 major states, with assistance from various donor agencies.
In 1991, a Committee on Population appointed by the National Development Council proposed the formulation of an NPP to take ‘a long-term holistic view of development, population growth and environmental protection’ and to ‘suggest policies and guidelines for formulation of programs’ and a ‘monitoring mechanism with short- and long-term perspectives and goals’. In 1992, the 72nd and 73rd constitutional amendments set the stage for democratic decentralization of health care by making PHC, including FP, the responsibility of the panchayats.
The Eighth Plan (1992-1997) identified several factors responsible for the non-realization of the population goals set so far, among them: adverse effects of centralized planning, lack of community involvement, target setting, ineffective and insensitive programme implementation, improper focus in IEC campaigns, and relative neglect of reversible methods. The plan document underscored the need to set more realistic goals and to avoid over-optimistic projections. Therefore the NRR of unity was now to be reached by the year 2011-2016. The plan document also set a target of a national level birth rate of 26, which was achieved by all the states except Assam, Bihar, Haryana, Madhya Pradesh, Orissa, Rajasthan and Uttar Pradesh.
In 1993, an expert group headed by Dr M. S. Swaminathan was asked to prepare a draft NPP. Its report was widely circulated among the members of Parliament and among central and state agencies. Two new area projects, namely the India Population Project (IPP)—VIII and IX, were initiated, of which the IPP-VIII project aimed at improving health and family welfare services in the urban slums in the cities of Delhi, Calcutta, Hyderabad and Bangalore, and the IPP-IX was to operate in the states of Rajasthan, Assam and Karnataka. An USAID-assisted project, ‘Innovations in Family Planning Services’, was taken up in Uttar Pradesh with the specific objective of reducing the total fertility rate from 5.4 to 4, and increasing the couple protection rate from 35 to 50 per cent over the 10 years project period. Ninety districts which had a crude birth rate of over 39 per thousand (as per the 1991 census) were identified for differential programming. From 1992-1993 to 1995-1996, enhanced allocation of financial resources, amounting to Rs 50 lakh per year per district, was made for these districts, for upgradation of health infrastructure. Four new schemes for increasing the involvement of NGOs were initiated by the Department of Family Welfare.
In 1994, the United Nations International Conference on Population and Development (ICPD) at Cairo came up with a Programme of Action that viewed population policies as an integral part of programmes for women's development and rights, their reproductive health, poverty alleviation and sustainable development. The government of India, articulating its commitment to the Programme of Action emanating from the Cairo Conference, to which it was a signatory, and also responding to the efforts of the women's movement, adopted the Reproductive and Child Health Approach to Family Planning, with an emphasis on decentralized participatory planning, a target-free approach, and provision of quality services. Concerns have however been expressed about the new approach. It has been argued that Reproductive and Child Health requires a larger budget allocation, in the absence of which the provision for contraceptive services might get diluted. It could also mean neglect of PHC. Further, a movement away from the target-oriented approach might affect, initially at least, the performance of the family welfare programme.8 Moreover, despite the claims by the State that the programme is ‘gender sensitive’ and ‘responsive to the needs of the women’, the policy document tends to homogenize men and women vis-à-vis their reproductive needs.9
The Ninth Plan (1997-2002) document envisaged ‘need-based, demand-driven, high quality, integrated reproductive and child health care’, assessment of the needs for reproductive and child health at the PHC level, and area-specific micro planning. It was in this plan period that, in February 2000, the government of India adopted the National Population Policy, which, emphasizing the need for population stabilization,10 acknowledged that ‘it is as much a function of making reproductive health care accessible and affordable for all, as of increasing the provision and outreach of primary and secondary education, and extending basic amenities, including sanitation, safe drinking water and housing, besides empowering women and enhancing their employment opportunities and providing transport and communication’. The NPP identified the large size of the reproductive age group, unmet need for contraception, high IMR and early marriage of girls as main reasons for the high growth rate of population. Specific policy initiatives were outlined ‘to simultaneously address issues of child survival, maternal health, and contraception, while increasing outreach and coverage of a comprehensive package of reproductive and child health services by government, industry and the voluntary non-government sector, in partnership’. There was to be decentralization of planning and programme implementation; convergence of service delivery at village levels; empowerment of women; increase of coverage, extending especially to urban slums, tribal communities, hill area population, displaced and migrant population, and adolescents; increased participation of men in planned parenthood; diversification of health care providers; research and development of contraceptive technology and reproductive and child care, and greater emphasis on IEC. The NPP also provided detailed operational strategies for achieving its objectives, including the setting up of some new bodies at the national and the state levels (e.g., Commission on Population). It also advocated a freeze on the number of seats in the Union Parliament, so that the states which have successfully restricted population growth do not face disadvantage in respect to parliamentary representation.
The NPP represents a crucial step towards a people-centric, inclusive programme. It resolutely affirms a ‘commitment of the government towards voluntary and informed choice and consent of citizens while availing of reproductive health care services, and continuation of target free approach in administering family planning services’.
In a notable development, however, many states like Andhra Pradesh, Uttar Pradesh, Rajasthan, Madhya Pradesh, Maharashtra and Gujarat adopted independent population policies, which in some significant sections were divergent from the NPP. These were marked by a series of incentives and disincentives as per local needs, with emphasis on strict implementation of the two-child norm and the legal minimum age at marriage. A number of health groups and women's groups have repeatedly protested these measures as being anti-women, anti-Dalit, anti-child and anti-poor in general.11 As a result of this, states like Maharashtra and Gujarat have been forced to reconsider.
The Tenth Plan (2002-2007) continued with the focus on decentralized area-specific planning and implementation based on community needs and demands, on integrated health care for women and children, and on empowering couples to enable them to achieve their reproductive goals. The perspective has shifted from the predominantly women-centred programmes to meeting the health needs of the family, and involving men in the process of ‘planned parenthood’. At the same time, reductions in fertility, mortality and population growth rate are major objectives. The Plan's 11 monitorable targets include reduction in IMR to 45 per live births by 2007 and 28 by 2012, reduction in maternal mortality ratio to 2 per 1,000 live births by 2007 and 1 by 2012, and reduction in decadal growth rate of population between 2001 and 2011 to 16.2.
Even prior to Independence, health-related concerns had been given a significant emphasis, as was attested by the formation of the Health Survey and Development Committee in 1943, with Sir Joseph Bhore as its chairman. The Committee's recommendations, in 1946, asked for an integration of preventive and curative services at all administrative levels, and for setting up primary health care centres. It also called for suitable changes in medical education so as to prepare ‘social physicians’. However, the comprehensive and the universal access approach of the Bhore Plan has taken a back seat. Though we see increasingly sensitive and people friendly statements in the plan documents, there is a mismatch between stated objectives on the one hand, and on the other, the plan outlays for actual expenditure on FP; the allocation has never even reached 2 per cent of the total developmental budget. This inconsistency raises questions about the political will and commitment towards population control. According to one view, the general perception amongst the official circles that socio-economic conditions of Indian masses does not favour family limitation, has prevented better budgetary allocations to FP. Moreover, when it comes to actual implementation, the concern is still largely with numbers; the official thinking has not moved beyond targets. The preoccupation with controlling women's wombs has predominated all other concerns. Also the tendency to homogenize the so-called ‘target groups’ has further defeated the plan vision; restriction of family size can find acceptability only if it suits the economy, convenience and comfort of the particular group.
DEMOGRAPHIC PROCESS AND POLICY FALLOUT
Though there has been a visible decline in the population growth rate since 1971, there are vast intrastate and regional differences in the population growth rate and its constituent elements—mortality and fertility rates. States like Kerala and Tamil Nadu have a very good demographic profile compared to states like Bihar, Rajasthan and Uttar Pradesh. A North-South Divide is evident also in other related indices such as the IMR and the contraceptive prevalence rate. The prevalence of antenatal care and safe delivery practices too are comparatively low in the BIMARU states (Bihar, Madhya Pradesh, Rajasthan and Uttar Pradesh), where neonatal mortality is high.12
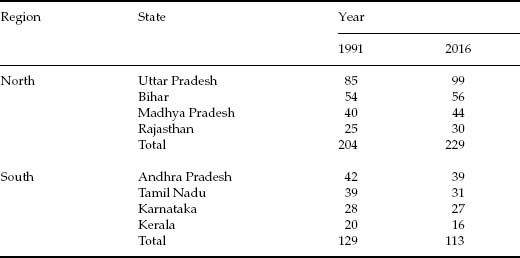
As we see from Table 4.2, the larger BIMARU states register high growth rates (25 or more than 25), while for Kerala and Tamil Nadu, the figures are relatively lower. The laggard BIMARU states however will play a crucial role in the population growth rate of the country as a whole; the population of Bihar, Uttar Pradesh, Madhya Pradesh, Rajasthan and Orissa account for nearly 40 per cent of the country's population and in the next decade will contribute over 50 per cent of the population growth. According to projections of the Population Foundation of India, ‘the population of BIMARU states will increase from 39.6 per cent in 1991 to 51.4 per cent in 2051, while the population of the southern states will decrease from 23.22 per cent in 1991 to 16.5 per cent in 2051’.13 This will alter the level of representation of different states in the Parliament. If the current freeze on the parliamentary seats allotted to the states is lifted,14 it will mean that the states that have been unable to control their population will in effect be ‘rewarded’ with an increase in representation in the legislative bodies (Table 4.3).
Table 4.2
Decadal growth rates, states of India, 1991-2001
| India/States | Growth 1991-2001 (%) |
| India |
21.54 |
| Andhra Pradesh | 14.59 |
| Arunachal Pradesh | 27.00 |
| Assam | 18.92 |
| Bihar | 28.62 |
| Chattisgarh | 18.27 |
| Goa | 15.21 |
| Gujarat | 22.66 |
| Haryana | 28.43 |
| Himachal Pradesh | 17.54 |
| Jammu and Kashmir | 29.43 |
| Jharkhand | 23.36 |
| Karnataka | 17.51 |
| Kerala | 9.43 |
| Madhya Pradesh | 24.26 |
| Maharashtra | 22.73 |
| Manipur | 24.86 |
| Meghalaya | 30.65 |
| Mizoram | 28.82 |
| Nagaland | 64.53 |
| Orissa | 16.25 |
| Punjab | 20.10 |
| Rajasthan | 28.41 |
| Sikkim | 33.06 |
| Tamil Nadu | 11.72 |
| Tripura | 16.03 |
| Uttar Pradesh | 25.85 |
| Uttaranchal | 20.41 |
| West Bengal | 17.77 |
Source: Population growth rate. Office of the Registrar General, Ministry of Home Affairs, Government of India, in Statistical Abstract India 2005 and 2006, 42nd edition. Central Statistical Organization, Ministry of Statistics and Programme Implementation, Government of India. Area and population. Table 1.4: Decennial Growth of Population by Census.
Note: In calculation of growth rates, figures for 1991 for Jammu and Kashmir had to be interpolated by the Registrar General's office because the census was not conducted in that state in 1991.
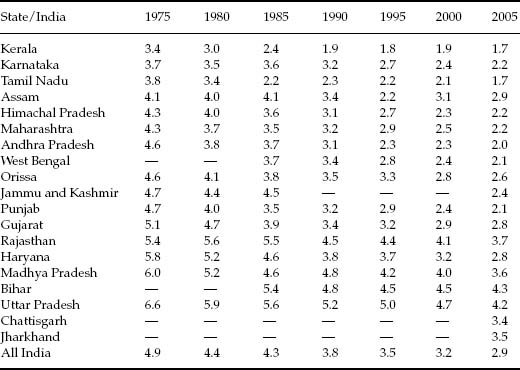
Differences in the demographic trends in different states suggest also that replacement levels of fertility would be reached much later in the BIMARU states. Kerala had already reached replacement fertility by 1990. States like Tamil Nadu and Andhra Pradesh had practically done so by 1995 (Table 4.4 and Figure 4.1). By 2005, this had happened not only in Karnataka (a South Indian state that was lagging behind), but also in Maharashtra, Himachal Pradesh and even Punjab. By contrast, states like Haryana, Rajasthan, Madhya Pradesh and Uttar Pradesh remained backward in this respect (Figure 4.1). It has been estimated that Rajasthan would achieve stabilization only by 2019, Bihar by 2039, Madhya Pradesh after 2060 and Uttar Pradesh after 2100.15 The policy implications of such variations in the demographic profile have not gone unnoticed. The Ninth and Tenth Plan documents recognize that ‘the family Welfare programmes need to be reoriented to remove or minimise the inter- and intra-state differences’ and emphasize ‘area-specific micro-planning without recourse to specific centrally fixed targets’.
Table 4.3
Number of Lok Sabha seats if the current freeze is lifted
Source: Ashish Bose. North-South divide in India's demographic scene. Economic and Political Weekly, Vol. XXXV, No. 20, 2000, p. 1698.
Table 4.4
Total fertility rates, India and states, 1975-2005
Sources:
- For 1975, 1980, 1985 and 1990: Registrar General of India. Data cited in World Bank. 2000. India: Reducing Poverty, Accelerating Development (New Delhi: Oxford University Press). Annexe Table 2.1: Per capita income, fertility, infant mortality and literacy in selected years.
- For 2001: Registrar General, India, cited in: Department of Family Welfare. Government of India. TFR for 16 major states of India. http://mohfw.nic.in/dofw%20website/Health%20&%20Poulation%20Indicators/hpi%20frame.htm>
- For 2005: Ministry of Health and Family Welfare, Government of India. Family Welfare Statistics in India—2006. Table A-25: Fertility indicators for major states, 2000-2005. pp. A40-A41.
Note: For the states of Bihar, Uttar Pradesh and Madhya Pradesh, the figures after 2005 are not strictly comparable with those for the previous years, as these states lost territories in 2000 to new states that were created out of them. Thus, Jharkhand was carved out of Bihar, Chattisgarh was carved out of Madhya Pradesh, and Uttarakhand was carved out of Uttar Pradesh. Separate TFR statistics for these states appear to have been compiled for 2004 onwards, as indicated by Source (iii) above. Nonetheless, the trends are suggestive.
Several factors account for the varied performance of states in bringing down their TFRs. Economic development and the attainments in health and education play a significant role, as do the empowerment of women, especially their participation in the decision-making process at the household level. However, state-specific factors and policies are important as well. To illustrate this, let us turn now to the experiences of the southern states. It is noteworthy that while the experiences of Kerala, Tamil Nadu and Andhra Pradesh have been relatively good, the routes by which their demographic profiles became favourable were varied. Kerala's demographic transition is explained in terms of multiple factors: Enlightened rulers of Travancore and Cochin gave a head start to the region in health and education, which was further promoted by the Christian Missionaries; social reforms; mass movements; Marxist government initiating land reforms; high investment in social development programmes; favourable status of women; high age at marriage of girls; large-scale migration to the Gulf, easing population pressure and increasing per capita real income; and better management of the FPP.16 Tamil Nadu does not share many of the characteristics of Kerala, but has still been able to achieve replacement levels of fertility, through public interventions, which is a happy augury. The factors important for Tamil Nadu are ‘a motivated government, a high degree of political will, the impact of the mid-day meal scheme…and the total involvement of bureaucracy’.17 Also providing grounds for optimism is the phenomenon of Andhra Pradesh catching up with Kerala and Tamil Nadu; ‘significant progress in the antenatal care of pregnant women…significant changes…in labour market in the rural areas…the general welfare measures by the government…in poverty alleviation…in the 1980s…have not only reduced poverty but also have had some impact on fertility decisions of the people’.18
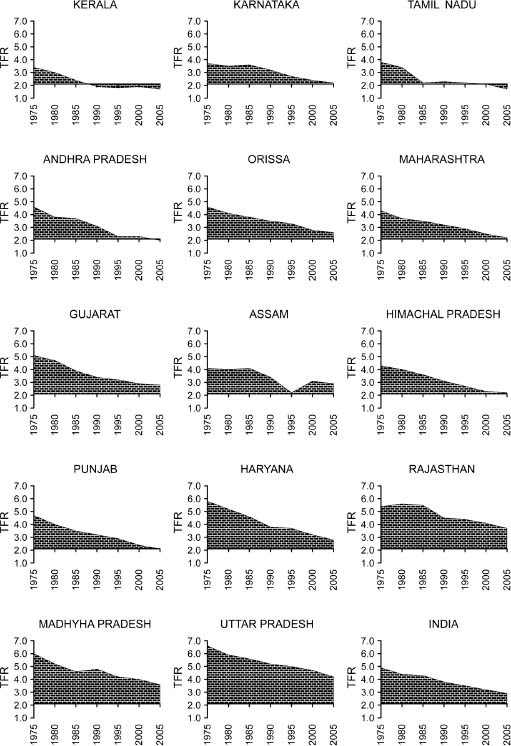
Figure 4.1
Total fertility rates (TFRs), India and states, 1975-2005.
DEMOGRAPHIC AGEING
The number of older people (above 60 years of age) in India has risen from 19 million in 1947 to 76.6 million in 2001. At present, India has the second largest number of elderly persons, after China. Projections for the year 2025 put the senior citizen population at 150 million, much more than the population of Bangladesh. Increase in longevity has of course been a factor at work. The demographic transition to lower mortality over a period of time has however overlapped with fertility decline, with the net result that not only have the numbers of the elderly gone up, their proportion in the population has increased as well. Since the demographic histories of the states in the country have been diverse, there are significant state-wise variations in this ageing process (Table 4.5).19
Table 4.5
Elderly population (in per cent) (population of 60+ persons as a percentage of the total population), India and states, 2001
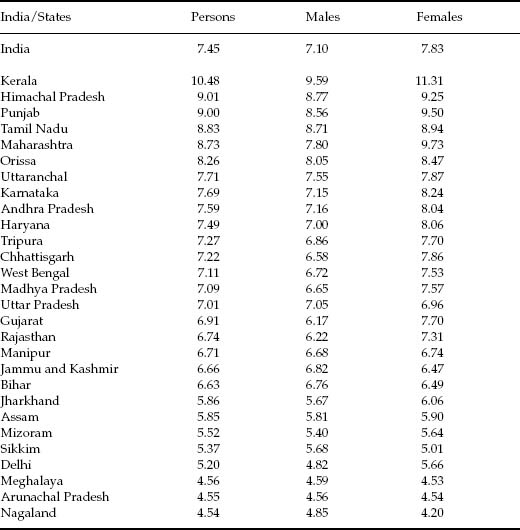
Source: Census of India, 2001. Computed from data in table B-2 Main workers, marginal workers, non-workers and those marginal workers, non-workers seeking/available for work classified by age, sex and religion.
A look at the old age dependency ratio, defined as the number of persons in the age group 60 years and above per 100 persons in the age group 15-59 years, shows that Haryana, Kerala and Punjab have high old age dependency ratios. We see also that the ratio is somewhat higher for females than for males (Table 4.6).
Data gathered in the 60th round of the National Sample Survey (20052006) show that close to half the male elderly are independent, as compared to less than a fifth in the case of the female elderly. The sources of support for the dependent elderly are overwhelmingly children. Eighty-five per cent or more of the male elderly in rural and urban areas were economically dependent on their children. Females too were largely dependent on their children, but additionally were far more dependent on spouses and grandchildren than the male elderly (Table 4.6).
Table 4.6
Dependent elderly by sources of care (in per cent), India, 2004-2005
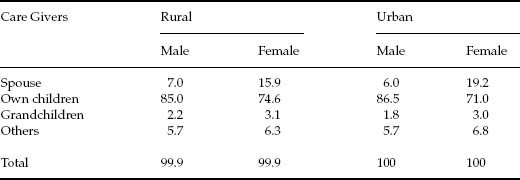
Source: 60th Round of NSS (2004-2005) on Morbidity, Health Care and the Condition of the Elderly, in Women and Men in India, 2006, Tenth issue, Ministry of Statistics and Programme Implementation, Central Statistical Organization, New Delhi, p. 85. (Table 61: Per 1000 distribution of economically dependent aged persons by the category of persons supporting the aged for each sex.)
Detailed analysis of the elderly population further indicates that the percentage of widowed elderly is strikingly higher for females than for males—64 per cent for women and 19.4 per cent for men. ‘This was sharper for those over 70 years: 77 per cent for women as against 22 per cent for men’.20 Keeping in view the changes taking place in the socio-economic structure of Indian Society, a well-worked out and effective programme for persons in the elderly category will be important for development initiatives. Special attention will need to be paid to the female elderly.
Old age brings with it varied forms of dependence—financial, physical and emotional. Provision for direct public support in India is however meagre. Though there is a pension system for the retired employees in the public sector, there is little financial assistance for workers in the unorganized sector or for the rural poor. The National Old Age Pension Scheme and the Annapurna scheme under the Public Distribution System provide only minor reprieve.
In 1999, the National Policy for Older Persons was formulated by the Ministry of Social Justice and Empowerment. The Policy's emphasis is on making accessible and available health care and nutrition, financial security, shelter, protection of life and property and welfare. The states of Himachal Pradesh and Maharashtra have introduced legislations to protect the elderly. There needs to be greater awareness amongst the health care professionals, social workers and the society in general to sensitively handle issues related to the elderly. There also needs to be an apparatus whereby the elderly have greater access to information on legal and financial matters. More substantial social security is required for those in the informal sector and in the rural areas. Day activity centres for the elderly should be promoted especially in the urban areas, which can help them utilize their experience in some fruitful activities.
RELIGION AND FERTILITY DIFFERENTIALS
Inter-religious fertility differences have formed a highly sensitive part of the political debate in India since the early 20th century, on account of the fear that Muslims, a religious minority in the country, are growing in numbers at a faster rate than the rate of growth of the Hindu population. In post-independent India, the debate has recurred time and again in the propaganda put out by the sangh parivar. It has often been asserted, in this context, that the fertility rates of the Muslims as a community exceeds that of the Hindus.21 But can the Muslims or the Hindus be considered a homogenous community with the same kind of fertility concerns for all members? Is it not important to look at the differences based on class, regions and place of residence (rural/urban)? Thirty-six per cent of the Muslims reside in the backward states of Bihar and Uttar Pradesh, the demographic indicators of which are anyway worse than those for the rest of India. Even within these regions, fertility varies according to the place of residence, economic position and literacy levels. All over India, in rural as well as urban areas, the Muslims are generally in a weaker economic position than the Hindus. More than half of the urban Muslims are reported to have incomes below the poverty line, compared to 35 per cent of urban Hindus. Seventy-nine per cent of the rural Muslim households own less than 1 acre of land as compared to 68 per cent of the rural Hindu households.22 Recent analyses however indicate that socio-economic factors are not able to explain all of the differentials. One study shows that they can explain no more than 25 per cent of the differential between Hindu and Muslim fertility in rural areas, and 50 per cent in urban areas. The religious injunctions against birth control, it is hence argued, should not be underestimated.23 The cultural tenets that are at the root of this, it is felt, are liable to get strengthened in a climate of polarization on religious grounds.24
CHALLENGES AHEAD
- In India, the demographic transition has been relatively slow but steady. Given the scale and the diversity of India's population, a decline from around six children per woman to almost half that level in 30 years is a significant achievement. Fertility has declined throughout the country but at varying pace. Over the years, there has been a fall in fertility in all the states, but the rate of reduction is higher in some states. If the acceleration begun during the Ninth Plan is sustained, the country may achieve replacement level of fertility by 2010, with the population of 1107 million; if this were done, the country's population may stabilize by 2045.
- The wide range of variations across the states, in the way the states fare in terms of the various demographic and health indicators, calls for state-specific population control strategies and programmes.
- Over the years, there has been a decline in the proportion of population living below poverty line but in terms of actual numbers there has been an increase. The poor families have lesser access to basic health and education facilities and are without sustainable forms of employment. These factors need to be addressed if a population policy has to succeed.
- Women's socio-economic status has a significant role to play in affecting their fertility. All round empowerment measures are needed, and gender sensitization of the bureaucracy, legislature and judiciary are also needed so as to ensure the effective implementation of policies and programmes.
- Under-nutrition and IMR are high in Madhya Pradesh, Orissa, Uttar Pradesh and Bihar. Low birth weight, poor dietary intake, poor caring practices, lack of access to safe drinking water, infection due to poor environmental sanitation, lack of access to health care are some of the factors responsible for the prevailing high under-nutrition in children. Some of the surveys indicate that under-nutrition is more common in girls than among boys. It is essential to provide integrated health, nutrition and contraceptive care to achieve rapid improvement.
- In the north Indian states, the average age at marriage for girls continues to be lower than the average for the country as a whole. Concerted efforts are needed to increase the marriageable age for women in these states. These states also have a strong son preference and a strong sense of gender discrimination directed against the females. These social norms and beliefs need to be attacked through sustained and innovative efforts at awareness generation and education.
- Unmet need for contraception exists in all states and among all segments of population, but the magnitude of unmet need varies. Andhra Pradesh has the lowest unmet need for contraception in spite of low age at marriage, low female literacy, and problems in accessing health care in some regions. This might be due to the sheer political will and bureaucratic support with which the developmental programmes have been implemented. Improving access to FP services would be an effective means of reducing high unwanted fertility, especially in the north Indian and northeastern states. For instance, the services for treatment of sexually transmitted diseases (STD) and reproductive tract infections (RTI) are rudimentary in public sector in all the states, and medical abortion is still not accessible to most women in spite of it having been legalized.
- It is expected that there will be a huge increase in the number of persons in the reproductive age group. They will need wider spectrum of services, expect better quality of services and expect fulfilment of their felt needs for MCH/FP care. If their felt needs are met through effective implementation of Family Welfare programme, it is possible to accelerate demographic transition and achieve rapid population stabilization.
- Increase in the people in the age group >60 years has brought in several challenges. The changing nature of family and the socio-economic compulsions of the new consumer age have further worsened the problem. The need is to increase qualitative social security, both for the rural as well as the urban areas, especially since the population of the elderly is expected to rise further in the near future.
- The need is to invest adequately in human resource development (HRD)/skill development, provide appropriate employment with adequate emoluments to a large work force, improve quality and coverage of health and nutrition services, achieve improvement in health and nutritional status, reduce mortality, and improve access to education and skill development.
- The need is to utilize human resources to accelerate socio-economic growth and improve quality of life, and bring about convergence and synergy between ongoing programmes to hasten demographic, socioeconomic and educational transitions. At the policy level, an artificial dichotomy between health and FP exists, in that health is a State subject and family planning is a Centre subject. This affects the allocation of resources, and the way things are implemented and monitored.