CHAPTER 14
The Regulatory Record: Achievements and Obstacles
14.0 Introduction
Chapter 13 provided an overview of the major environmental legislation in the United States. What has 45 plus years of regulation actually accomplished? Quite a lot, according to one view. Not enough, according to others. We examine some of the evidence in this chapter. We also explore one of the key drivers of regulatory success, the political muscle put behind monitoring and enforcement of the laws on the books. But moving beyond what has been achieved to date, in the face of growing pressure on the environment from rising population and affluence, how can regulation be improved?
First, by building greater flexibility and harnessing economic incentives, many economists argue that we could buy a better level of environmental quality at a substantially lower cost. However, assuming that we can improve the regulatory process in this way, a final question remains. By their very nature, regulatory approaches are limited to control of narrowly defined pollutants and work best for stationary and “point” sources; moreover, regulatory gains may be swamped by economic growth. Given the scale of challenges such as climate change, does government need to move beyond internalizing externalities through regulation and directly promote the development of clean technology?
14.1 Accomplishments of Environmental Regulation
After more than four full decades of extensive environmental regulation and the expenditure of hundreds of billions of dollars on pollution control, where do we now stand? The record is the clearest for air pollution. As Table 14.1 reveals, in absolute terms, ambient concentrations of all of the criteria air pollutants declined over the period from 1980 to 2008. Declines were the largest for lead (91 percent), due largely to a phaseout of leaded gasoline beginning in 1984. Over the period, sulfur dioxide concentrations dropped by 71 percent and carbon monoxide by 79 percent. Progress has also been made in reducing concentrations of nitrogen oxides (down 46 percent) and ground-level ozone (down 25 percent). Recall that ground-level ozone, or smog, is created from a mixture of nitrogen oxides (), volatile organic compounds (VOCs), and sunlight. The big drops in and since 1990 reflect new regulatory standards put in place by the Clean Air Act Amendments of 1990. Powerplant emissions are down over 60 percent from the levels in 1980. Post 2008, there were further drops in emissions due to a significant switch from coal to natural gas and renewable energy in electricity production. For the, same reasons, global warming pollution (CO2) is down about 10 percent from its peak level in 2006. (More on that in Chapter 18.)
TABLE 14.1 Progress in Reducing Air Pollution (average nationwide ambient concentrations)
Source: U.S. EPA (2009).
| Percentage Reduction in Average Ambient Concentrations | ||
| 1980–2008 | 1990–2008 | |
| Particulates | — | 31 |
| Sulfur dioxide | 71 | 59 |
| Nitrogen oxides | 46 | 40 |
| Carbon monoxide | 79 | 68 |
| Lead | 91 | 62 |
| Ozone | 25 | 14 |
Except for ozone, impressive headway toward reducing absolute concentrations of the criteria air pollutants has been made; for lead, the gains have been quite spectacular. For most Americans, the air we breathe today is substantially cleaner than it was in our parents’ generation. And this is despite economic output in the country more than doubling over the last 40 years.
In many areas, however, some of the National Ambient Air Quality Standards are still violated, at least during parts of the year, and by far, the biggest offender is ozone. In 2015, 161 million people lived in counties where at least one NAAQS was violated at some time over the course of the year. Ozone is likely to remain a stubborn and serious air pollution problem, affecting roughly 40 percent of the population to varying degrees, as long as cities remain dependent on private gasoline-powered autos for transportation.1
Air toxic regulation mandated in the 1990 Clean Air Act (CAA) Amendments got under way only in the mid-1990s. Since then, the EPA has issued more than 45 air toxics MACT standards, affecting major industrial sources, such as chemical plants, oil refineries, aerospace manufacturers, and steel mills, as well as smaller sources such as dry cleaners. Overall, from 1990 to 2002, emissions of air toxics declined by 35 percent.2 In 2012, the Clean Air Act celebrated its 40th anniversary, and several major economic studies in recent years have confirmed the dramatic success evident in Table 14.1. While motivated by safety goals, the regulations have dramatically improved the efficiency of our economic system. Table 14.2 summarizes the estimated benefits of the 1990 Clean Air Act amendments—mostly from reduction in premature deaths. Monetized, the benefits through 2020 come close to 2 trillion dollars, dwarfing the estimated costs of $65 billion by 30 to 1.3
TABLE 14.2 Benefits of the Clean Air Act as Amended
Source: U.S. EPA (2012) Benefits and Costs of the Clean Air Act, http://www.epa.gov/air/sect812/prospective2.html.
| Year 2010 (in cases) | Year 2020 (in cases) | |
| The 1990 Clean Air Act Amendments prevent | ||
| Adult mortality—particles | 160,000 | 230,000 |
| Infant mortality—particles | 230 | 280 |
| Mortality—ozone | 4300 | 7100 |
| Chronic bronchitis | 54,000 | 75,000 |
| Heart disease—acute myocardial infarction | 130,000 | 200,000 |
| Asthma exacerbation | 1,700,000 | 2,400,000 |
| Emergency room visits | 86,000 | 120,000 |
| School loss days | 3,200,000 | 5,400,000 |
| Lost workdays | 13,000,000 | 17,000,000 |
Turning now to water quality, forward progress has been less dramatic. Table 14.3 provides some good news: On average, fewer U.S. rivers and streams were in violation of water quality standards in the 1990s than in the 1970s. At the same time, at the end of the 1990s, about 40 percent of U.S. streams, lakes, and estuaries were still too highly polluted to support fishing and swimming, with little progress since then.4 In 2010, there were over 4,000 fish “advisories” nationwide, for which estimated cancer risks from occasional fish consumption (one or two meals per month) were significant. People who depend heavily on fish from inland waters—including some Native Americans and rural populations—faced substantial additional risk.5 Similar mixed stories emerge from recent data on pesticide and nutrient concentrations in the nation’s streams and rivers.6 Overall and on balance, small gains have been achieved in improving water quality nationwide.
TABLE 14.3 Trends in U.S. Water Quality
Source: U.S. Geological Survey and U.S. EPA, Office of Water, as reported on the Council of Environmental Quality website www.ceq.doe.gov, U.S. EPA (2007 and 2011b).
| Percentage of Streams in Violation of Standards | |||||
| Fecal Coliform | Dissolved Oxygen | Total Phosphorus | Total Cadmium | Total Lead | |
| 1975–1980 | 33.7 | 6.0 | 4.5 | 2.5 | 9.0 |
| 1990–1995 | 27.2 | 1.7 | 2.5 | <1.0 | <1.0 |
| Number of Fish Consumption Advisories, Selected Toxins | |||||
| Mercury | PCBs | Chlordane | Dioxins | DDT | |
| 1993–1994 | 995 | 355 | 103 | 59 | 40 |
| 1997–1998 | 1,857 | 634 | 111 | 62 | 34 |
| 2005–2006 | 3080 | 1083 | 105 | 125 | 84 |
| 2009–2010 | 3,710 | 1,084 | 60 | 128 | 58 |
Why have we not seen better results? First, regulation has had a major effect on point sources of water pollution. Industrial discharges of two conventional water pollutants (suspended solids and dissolved oxygen) declined by more than 90 percent from 1982 to 1987. This improvement resulted from the installation of BPT and BAT technologies, as well as the diversion of substantial industrial effluent to municipal waste facilities for treatment. In part because of this latter phenomenon and in part due to population growth, the substantial government investment in sewage treatment has merely held the line on surface-water pollution from point sources. At the same time, increases in nonpoint water pollution, particularly agricultural runoff, have offset regulatory gains. Of course, as in the case of air pollution, the achievements of the regulatory program would look better compared to where we would have been in the absence of federal controls.
Buried within these averages, though, are both clear-cut success stories and cautionary failures. Rivers in many urban areas, for example, are dramatically cleaner than they were during the 1970s. This has facilitated urban waterfront redevelopment in cities across the country, dramatically increasing the quality of life for residents. Yet, the high-profile disaster in Flint, Michigan, in 2015 (see Chapter 7) illustrates a community with inadequate infrastructure forced to still rely on a highly polluted source of drinking water.
The bottom line on water pollution is that the United States will be home to another 150 million people by 2050. At the same time, in coastal areas, saltwater intrusion from rising sea levels—and in the western United States, loss of snow melt from global warming—will be reducing water supplies. A new round of tighter industrial regulations, and major and continual upgrades of municipal sewage and domestic septic systems, will be needed to avoid deterioration of the nation’s drinking water supplies, streams, lakes, and beaches.
Evaluating the impact of hazardous waste legislation is difficult. The ostensible goal of RCRA (and Superfund liability) has been to prevent future Love Canals. Relatively strict regulations governing land disposal appear to have reduced the flow of hazardous waste into landfills by more than 50 percent between 1986 and 1995. The net volume of toxic waste generated by companies also declined by about 50% from 1986 to 1995, though the overall toxic content of the waste appeared to have stayed constant—implying that the concentration of hazardous chemicals in the waste that is disposed of increased. Between 1999 and 2005, hazardous waste generation fell by another 23%.7
The cleanup of old dump sites has proceeded slowly but steadily; as noted, over 1,000 sites have been cleaned up. However, it is not clear how much of the slow speed and expense of the progress are due to the nature of the beast (the need for careful evaluation and consideration of options) and how much is due to excessive litigation, bureaucratic foot dragging, or insufficient funding.
Unlike air, water, and land disposal laws, pesticides are regulated under a benefit–cost standard and so should be evaluated in these terms. An analysis found that the estimated value of a life saved under the pesticide review process has been $35 million—well above the $5 to $10 million value used in benefit–cost analysis. The authors argue that pesticide regulation has thus been inefficiently strict: marginal costs outweigh marginal benefits. A second source of serious inefficiency in pesticide regulation has been the “grandfathering” of old, more dangerous pesticides that were already on the market at the time the laws were passed. Recent reforms have begun to attack this problem.
Until recently, the U.S. regulation governing potentially harmful effects of existing or new chemicals had been largely ineffective. However, after reforms to the Toxic Chemicals Substances Act (TSCA) in 2016, the EPA is now required to test new chemicals for safety before they are introduced into the market, and the agency has better tools to restrict the uses of existing chemicals.
Finally, of the species listed as either threatened or endangered, 41 percent were found to be stable or improving, 35 percent declining, 23 percent facing uncertain future, and 1 percent—seven species—have become extinct. Seven species have also been delisted after a successful recovery, and 11 have been upgraded from endangered to threatened. A recent study found that of the species with a recovery plan and a target date, 90 percent were recovering at the speed anticipated.8
What are we to make of this record? Let us for the moment take an optimistic view. Even though economic activity more than doubled from 1970 to 2015, the general criteria air pollution picture has improved significantly, dramatically for lead. In addition, large reductions in air toxics have been recorded. Industrial emissions of waterborne pollutants have dropped dramatically, and in many urban areas, water quality has improved beyond the levels in 1970. Regulation of hazardous waste is likely to prevent the development of future “Love Canals.” And the rising cost of disposal, along with the “right-to-know” TRI regulation and the potential for Superfund liability, has focused corporate attention on reducing waste through pollution prevention. Particularly, nasty new pesticides and now new chemicals as well are not likely to make it through the EPA’s initial screen, and under prodding from Congress, the agency has restricted the use of the worst of the existing pesticides. Finally, only a few listed species have slipped into extinction.
Over the last four decades, U.S. environmental regulation has substantially cleared the air and has essentially held the line against economic growth in the arenas of water, land, and chemical pollution (with a scattering of more dramatic successes). This is a substantial achievement in a nation in which economic output has more than doubled and which is now home to an additional 100 million people. In the next section, we explore how environmental gains have been affected by political ups and downs in the monitoring and enforcement of regulations. We then turn to prospects for future success.
14.2 Monitoring and Enforcement: Political Constraints
Monitoring for violations and enforcing the law constitute, as they say, a dirty job, but one that is essential to the entire regulatory process. As the entire country learned in 2010, with the devastating BP oil blowout in the Gulf of Mexico, tough environmental regulations mean little if society does not have the resources or willpower to back them up. Monitoring and enforcement are particularly important, as we shall see in Chapters 15 and 16, when firms are allowed to have greater flexibility in pursuing innovative—and cost-saving—pollution-reduction options.
The states have the primary responsibility for enforcing most environmental laws. The EPA’s role, as characterized by former agency administrator William Ruckelshaus, is to be the “gorilla in the closet,” available to back up state efforts. The gorilla’s efforts, however, have waxed and waned with the political winds. For example, one measure of enforcement activity is the number of criminal cases referred by the EPA to the Department of Justice (DOJ). Criminal charges during the first Bush administration were about 300 per year. They climbed steadily during the Bill Clinton administration, reaching a peak of almost 600 in 1998. Following the election of President George W. Bush in 2000, enforcement declined substantially; criminal referrals fell below 350. The number of violators actually sent to jail fell from 339 in Clinton’s second term to about 240 in Bush’s first term. In 2002, the EPA’s director of regulatory enforcement resigned, charging that he had been “fighting a White House determined to weaken the laws we are trying to enforce.”9
These numbers reveal the sensitivity of enforcement efforts to the political climate and budget pressures. Because the bulk of enforcement occurs at the state level, variations in enforcement activity across state lines can be substantial. Political struggles between industry and environmental advocates over the size of the environmental agency budget are an annual event in states across the country.
When the EPA gorilla does swing into action, it can impose punishment at three levels. The agency can take an administrative action and directly impose fines. These can then be appealed through a quasi-judicial process within the EPA known as administrative review. This approach is by far the most common and accounts for about 90 percent of the penalties imposed. The agency takes about 4,000 such administrative actions each year, while the states initiate an additional 12,000 or so.10 The EPA can also refer cases to the DOJ for prosecution as either a civil case, where fines can be levied, or a criminal case, where a combination of monetary sanctions and incarceration can be obtained. As one moves up the chain, both the standards of proof required for conviction and the available penalties become higher.
Even at the administrative level of punishment, however, the EPA inspectors are not empowered to impose fines as if they were parking tickets. Typically, a complex process of reporting, documentation, and review will be put in place before any penalty is assessed; once assessed, penalties are typically reduced on appeal or in a bargaining process. Figure 14.1 illustrates the steps in the enforcement procedure that have been used at the EPA to impose a penalty once an inspector has uncovered an RCRA violation at a hazardous waste facility.

FIGURE 14.1 The RCRA Enforcement Process
Source: Sanjour (1992). Drawn from http://www.epa.gov/airtrends/aqtrends.html#airquality.
From inspection (at the top), the most common enforcement path (administrative action) proceeds down the left side of the chart. After several steps, one arrives at a box labeled “Compliance agreement final order, establish compliance schedule.” At this point, a monetary penalty may be assessed, although the final order might just as easily include only a timetable for compliance. Yet, the ball game is still not over, because the alleged violator can make an appeal to the EPA administrator and, failing that, to civil court. In the event of further noncompliance, the agency might refer the case to the DOJ for prosecution as a civil or criminal case.
A final political-economic constraint on enforcement is the motivation, training, and experience of the EPA’s inspectors. Turnover has been a serious problem in its regional offices and in state enforcement agencies. EPA employee and critic William Sanjour provides a particularly blunt assessment of the hazardous waste enforcement program: “The job of inspecting hazardous waste facilities in EPA regions is a dead end job that nobody wants. Turnover is high, training is poor and morale is low. Just as in EPA headquarters, young inspectors soon learn that you don’t become a hero by finding major violations in hazardous waste management facilities regulated by EPA. (Due to the revolving door among EPA management and the industry.) It’s like the young cop busting the whore house that has been paying off the mayor. As a result, inspectors engage in trivial ‘bean-counting’ exercises while looking for another job.”11
Sanjour’s characterization of the enforcement process is harsh. Many agency officials work hard under difficult conditions to try to get a tough job done. Nevertheless, on occasion, political favoritism in the enforcement process is exposed to public view. Reports on the BP oil blowout in 2010 suggested widespread corruption in the Minerals Management Service, the agency that was responsible for permitting drilling in the Gulf.
Similarly to any other aspect of the regulatory process, enforcement is subject to political influence. This can take the form of budgetary restraints, regulations that are either unenforceable or highly cumbersome, or pressures (informal or direct) placed on field workers to take a “nonconfrontational” approach to their work. The point of this section is not to suggest that the EPA and state enforcement agencies are infected by widespread corruption. Rather, the point is merely to recognize the real-world constraints under which the enforcement process operates.
When writing most of the major environmental statutes, Congress recognized that public enforcement efforts might well prove inadequate to ensure full compliance with the new laws. As a result, a provision in most of the statutes allows private citizens to take violators to court. These citizen suits became an increasingly important mechanism for enforcing environmental laws beginning in the 1980s.
Congress limits the enforcement powers of citizens in a variety of ways. Citizens are required to give the alleged violator a 60-day notice period, providing an opportunity to come into compliance. Any settlements must be reviewed by the EPA and the Justice Department, and citizens cannot sue if public officials are already pursuing a “diligent” enforcement effort.
However, citizen suits do have real teeth. Citizens can sue not only to force firms into compliance but also for damage restoration and often the imposition of penalties. Out-of-court settlements increasingly involve corporate financing of the so-called environmentally beneficial expenditures—“donations” to organizations such as the Nature Conservancy, which buy up land for preservation purposes, or the financing of cleanups or environmental studies. Finally, private groups can recover court costs for successful suits.
Given these incentives, why aren’t private environmental groups more active in filing suits? The primary problem lies in the difficulty of monitoring emissions and proving a violation. The great majority of citizen suits have been filed under the Clean Water Act, where self-reporting of emissions is required. Environmental groups have been able to obtain these self-reported records (at some expense). Proving a violation has thus been as simple as checking emission records against a firm’s permit. Citizen enforcement can serve a particularly important role in enforcing compliance at government-owned facilities. If EPA or state officials are reluctant to pursue a government polluter for political reasons, citizen suits provide a fallback.12
In spite of ongoing political challenges to enforcement of U.S. environmental law, as we saw in the previous section, over the last 40 years of regulation, real progress has been achieved. That said, future regulatory gains will be constrained by the ability to effectively enforce regulations. We now turn our attention to other fundamental challenges to future regulation and preview Part III of the book: “How Can We Do Better?”
14.3 The Appeal of Incentive-Based Regulation
The first answer to “doing better” that economist’s have focused on is to change the underlying approach to regulation. In the previous two chapters, we have learned that much regulation is of the Command-and-Control (CAC) variety, in which regulators require airsheds, or watersheds, or land disposal sites to achieve a certain level of environmental quality and then direct companies to utilize very specific, “best available” technology solutions—air scrubbers, water filters, landfill liners, agricultural practices—to try and get there. As an alternative, economists believe that we can do better by using incentive-based approaches—pollution taxes and cap-and-trade systems—to achieve better environmental results at lower cost. In this section, we introduce the problems with command-and-control, and then in Chapters 15 and 16, we will look closely at incentive-based alternatives, in theory and practice.
The current CAC regulatory system typically has two parts. The first is the uniform emission standards typically mandated under the Clean Air and Water acts and under RCRA. All similar sources are “commanded” to meet identical emission levels. The problem with uniform emission standards is that they fail to achieve cost-effective reductions in pollution. Cost-effectiveness means achieving a given goal—be it safety, sustainability, or efficiency—at the lowest possible cost. The second half of command-and-control is “control.” Here, requirements that firms must install particular technologies designated by regulators can discourage technological innovation in pollution reduction and raise the long-run costs of environmental protection.
Let us first take a look at the cost-effectiveness problem with command-and-control. To use a simple illustration, consider two neighboring oil refineries. Refinery A, which has the ability to reduce emissions of, say, nitrogen oxides at very low cost, is expected to meet the same standard as next-door refinery B, a firm with very high costs of reduction. The reason why this policy is not cost-effective is simple: the same overall emission reduction (and local air quality) could be achieved at lower cost by having the low-cost firm meet a tighter emission standard, while relaxing the standard for the neighboring high-cost firm.
However, there is one area in which current legislation does not require uniform standards: new sources and old sources are generally treated much differently. The Clean Air Act requires more stringent control technologies for new sources (the New Source Performance Standards), RCRA allows for regulations to differ between existing and new hazardous waste facilities, and FIFRA and TSCA regulate the introduction of new pesticides and chemicals on a preemptive basis but challenge existing substances only on case-by-case review.
The reason for this type of “grandfathering” (providing special protection for existing sources) is not difficult to understand. It is politically much easier to pass pollution-control laws that have their largest impact on firms not currently around to object. However, regulating new sources more stringently introduces a new-source bias. Because higher costs are now attached to new investment, firm managers and consumers will hold on to their old polluting technologies longer than they otherwise would. For example, rather than build new, cleaner electricity-generating facilities, firms may stretch out the lives of older, dirtier ones. Similar effects have been observed for new cars.13 Or, to consider another case, some new pesticides that have been denied registration are actually safer than the substitutes already approved for use on the market.
A new-source bias reduces the cost-effectiveness of a given policy in both the short and long run. In the short run, regulators impose tougher standards on new sources that are likely to be cleaner already, while ignoring existing and potentially more severe problems. For example, in some places, one cost-effective way of reducing urban air pollution may be buying up and junking old, highly polluting cars.14 The long-run cost effect, however, is probably more severe. By slowing down investment in new technology, the pace of technological change itself slows down. With less technological progress, long-run pollution-control costs fall slower than they otherwise would.
To review, the first aspect of CAC regulation is the emission standards that the government “commands”: uniform for all similar areas and sources, with the often perverse exception that new sources are more stringently regulated than old ones. Both uniformity and the new-source bias serve to reduce the cost-effectiveness of regulation.
The second, “control” part of the name refers to the technology-based regulatory approach employed by much current regulation. NSPS, BACT, RACT, MACT, LAER, BPT, and BAT: defining all these acronyms involves regulators in a highly detailed process of specifying precisely which technologies firms will employ. There are two cost-effectiveness problems here. First, in the short run, a uniform technological mandate is unlikely to provide the cheapest pollution-control solution for different firms all over the country. This lack of flexibility inherent in centralized, technology-based regulations raises costs.
Again, however, long-run cost effects are probably more important. Technology-based regulation works against technological improvements in several ways. First, once a firm has installed BACT (best available control technology), for example, it has no incentive to do better. Second, the firm actually has a positive incentive not to do better. If, for example, it discovered a better technique for pollution reduction, and the EPA then decided to deem this new technology BACT, the firm might legally be required to upgrade its pollution-control technology at other new facilities. Firms have a distinct incentive to keep the agency from upgrading the state-of-the-art technological standard. Finally, if these obstacles firms do seek an innovative, non-BACT approach, they must first obtain regulatory clearance to do so.
What would be an alternative to technology-based regulation? Again, we explore this issue further in Chapters 15 and 16, but in essence, the regulator might simply specify a pollution goal for each firm and then let each firm achieve its goal as it sees fit. Provided that monitoring and enforcement resources were adequate to ensure that firms were complying, such a flexible system could result in the same emission levels at much lower cost in the short run and provide substantially better incentives for cost-reducing technological progress in pollution control in the long run.
To summarize, many economists would argue that the current command-and-control regulatory strategy is not cost-effective. We could achieve the same goals—whether safety, efficiency, or ecological sustainability—at much lower cost by shifting to more flexible, incentive-based approaches.
Incentive-based regulation, however, is still regulation. Firms must be punished for exceeding allowable emissions of pollutants. Some have argued that this kind of “stick” strategy of forcing firms and consumers to internalize externalities—no matter how flexibly it is designed—will face an increasingly difficult task in holding the line on environmental quality.
14.4 Beyond Regulation? Promoting Clean Technology
As documented earlier in this chapter, regulation has scored substantial successes. However, some hold a pessimistic view of the prospects for future regulatory success. This outlook rests on three assumptions. First, economic growth can eventually swamp the regulatory process. As noted, relatively little recent progress has been made in reducing ozone levels. While cars get cleaner and cleaner, more and more cars are on the road. Despite tremendous investment in sewage treatment facilities, emissions from these sources have improved only marginally. And the fact remains that as the economy grows, industry continues to generate hazardous wastes and toxic chemicals, and these must go somewhere. Even if these materials are stored according to best practice, it is argued that general exposure levels must ultimately increase along with the greater and greater volumes of waste.
Second, regulation has already picked off the “easy” targets—stationary air pollution sources and point water pollution sources. In fact, urban smog is due largely to automobiles, while nonpoint pollution has become the dominant water quality problem. Regulating these diffuse sources will prove much more difficult. In economic terms, the marginal costs of a regulatory approach to controlling pollution are likely to rise significantly for the next generation of problems.
We can see how these two issues interact using the IPAT equation from Chapter 9. Increases in economic growth () increase environmental impacts, unless offset by improvements in technology (). The argument is that if the marginal costs of pollution control are rising, then this will undercut the ability of new technology to counterbalance an ever-growing increase in material affluence.
As a final point, even if regulation is successful in one media, say, improved air quality, the “reduced” pollution is likely to squeeze out somewhere else. For example, coal power plants reduce sulfur dioxide by “scrubbing” the sulfur out of the gaseous emissions. However, this process produces a hazardous sulfur sludge, which must be disposed of on land. Or, limits on industrial discharge of water pollutants have caused an increase in discharge through municipal sewage facilities. Or, RCRA’s tough regulations for land disposal, focused on a handful of sites, are likely to increase the rate of on-site incineration of hazardous waste. This will occur at thousands of points across the country, spawning an additional regulatory headache.
Economists call this the leakage problem. Regulating the environment a piece at a time will lead firms to seek out substitute media for disposal. Under these circumstances, regulation ultimately boils down to channeling dangerous substances into areas where they cause the least environmental harm.
Our 45-year experience with regulation has not been futile. While we may not have achieved our ambitious target of creating a safe and clean environment, and despite the many political-economic obstacles faced, regulation has made a major difference in the environmental quality experienced by Americans. The real question is, can regulation continue to at least hold the line against continued economic growth and even begin to improve the state of the environment?
Economic growth clearly requires increasingly strict emission standards in order to maintain the same level of environmental quality. If (1) tightening regulation leads to ever-rising marginal costs of reduction or if (2) the pollution “reduced” squeezes out elsewhere, regulatory strategies will clearly fail over the long run.
Is there a way out of this trap? Yes. Our standard assumption is that firms reduce pollution using an end-of-the-pipe strategy. That is, faced with a regulation requiring lowered emissions, firms make small adjustments to their production process: say, adding a scrubber at the “end of the pipe” or switching to a cleaner and more expensive fuel. Consider an example of a firm trying to reduce particulate emissions, measured in parts per million (ppm). Under these circumstances, the marginal cost of reduction curve takes on the familiar look in Figure 14.2A; that is, it becomes increasingly difficult (expensive) to clean up emissions as the standard tightens from 100 to 0 ppm.
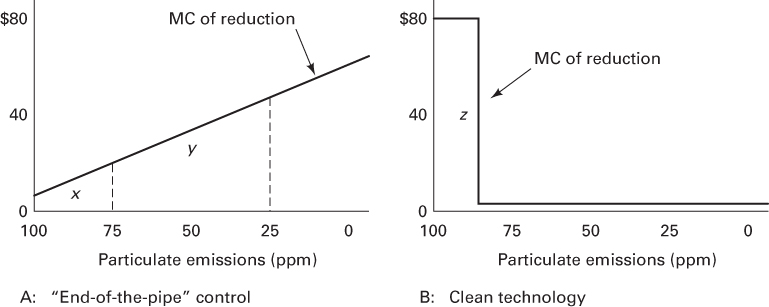
FIGURE 14.2 Two Technologies for Particulate Control
However, one effect of regulation might be to induce firms to seek out whole new technologies that avoid emitting the pollutant of concern in the first place—call this clean technology strategy. (This is the strategy that lies at the core of the sustainable business vision discussed in Chapter 3.) In this case, the marginal cost curve takes on the shape of Figure 14.2B. Here, if the firm bears an initial expense to significantly alter its production process (), the marginal costs of reduction, and consequently, pollution emissions, fall to zero. Because the firm no longer emits the pollutant in question, there are no marginal costs of reduction below a level of 90 ppm. Note that once the new technology is in place, both the leakage problem and the problem of rising marginal cost disappear.
Which technology will the firm adopt? That depends on a comparison of the total costs of the two options. In this simple example, the firm will go with an end-of-the-pipe solution if the area under the marginal cost curve is smaller in Figure 14.2A, as opposed to that in Figure 14.2B. This is true for a standard of 75 ppm, (), but as the required cleanup increases to 25 ppm, the clean technology becomes the cheaper approach ().
Unfortunately, the story is not this simple. The real-world problem is that firms have little incentive to invest in developing the clean technology in the first place until regulatory costs become very high, especially because regulations are easier to fight politically as they become more stringent and costly. Investment in the cleaner technology, of course, would have led to reductions in cost—through research and development, “learning by doing,” and economies of scale.
But a lack of investment means that the cleaner technology seldom exists as an easy, reliable, or low-cost alternative. A chicken-and-egg problem thus emerges: stricter emission standards are too costly (not politically feasible) using end-of-the-pipe approaches, but new pollution-prevention technologies will not be developed by industry until stricter emission standards are required. This in turn implies that the “stick” of regulation—no matter how flexible—may never be strong enough to prod firms into investing in pollution-prevention strategies.
In Chapter 17, we will explore further why normal market processes tend not to generate clean technologies of this type—which involve major rather than marginal changes in production processes. But, as a preview, to achieve sustainability, it may be necessary to supplement the stick of regulation with the carrot of direct government investment in, and promotion of, clean technologies.
The take-home message of this section is that, unless regulation induces major technological change, we cannot escape the logic of IPAT. That is, if the marginal costs of control continue to rise, then technology simply cannot offset the impact of increased growth. This means that the quality of the environment must deteriorate over time. The key issue then is, can regulation alone drive technological innovation, or must the government take a more active role investing in clean technology?
14.5 Summary
This chapter has looked back at the 45-year pollution-control record in the United States. In summary, our air is much cleaner, and in other sectors, regulation has managed to hold the line against economic growth. It is, of course, possible to view these accomplishments either as a cup that is half-full or half-empty. One of the ongoing challenges to regulation is the monitoring and enforcement of existing laws, and the strength of enforcement clearly waxes and wanes depending on the philosophy of the political party in power.
Normative criticisms of the existing laws have been directed both at safety standards (too costly) and efficiency standards (insufficiently safe). These criticisms are important and were dealt with at length in the first part of this book. However, we now want to leave our discussion of the goals of environmental policy behind and begin to consider more effective implementation. The question we move on to address in Part III of the book is: How can we improve the cost-effectiveness and technological dynamism of environmental protection?
Whether our goal is safety, efficiency, or ecological sustainability, this chapter has identified three features of the current command-and-control regulatory system that tend to work against cost-effectiveness: uniform emission standards, a new-source bias, and a technology-based approach. By contrast, we argue in Chapters 15 and 16 that much more flexibility could be built into the regulatory process and incentives harnessed to improve the overall cost-effectiveness. However, for a more flexible approach to succeed, careful emission monitoring is required and adequate enforcement resources must be available.
While a switch to more flexible regulation is, in many cases, a good idea, more flexible regulation is still regulation and, beyond monitoring and enforcement, faces three obstacles to continued success. First, economic growth is a real challenge to effective regulation. As the volume of activity increases, so does the volume of harmful externalities. Second, nonpoint, mobile, and other widely dispersed sources, difficult to regulate by traditional methods, have all become more important players in the pollution story. Finally, the leakage problem—in which pollution regulated in one media squeezes out into another—places a limit on the level of overall environmental cleanup that regulation can ultimately provide. In short, technological innovation that continually lowers the marginal cost of cleanup is critical to achieve ongoing progress. These factors imply that beyond regulation, the direct promotion of clean technology is another important role for government. How to do this wisely is an issue addressed in Chapters 17 to 19.
KEY IDEAS IN EACH SECTION
- 14.0 This chapter assesses the achievements of environmental regulation in the United States; the importance of monitoring and enforcement and the prospects for future success of regulatory strategies to protect the environment.
- 14.1 This section provides a progress report. There has been success in reducing criteria air pollutants, though forward movement in several areas has stalled out. However, tighter regulation for particulates and ozone may lead to more improvement over the next decade. On the air toxic front, large emission reductions have been driven by a combination of regulation and bad publicity from the TRI. A major 2012 review of U.S. air regulation found that benefits exceeded costs by 30 to 1. Gains in water quality from point-source regulation have been balanced by increases in nonpoint pollution. The impact of regulation on land disposal of waste and chemical safety is difficult to evaluate. One study indicates that pesticide regulation is inefficiently strict, though not strict enough to be safe. Finally, the Endangered Species Act has also had mixed success—generally preventing extinction, but failing to promote recovery.
- 14.2 Most enforcement is done by the states. The principal political constraint on enforcement is budgetary pressure. Enforcement measures take the form of administrative action (by far the most common) or can proceed as civil or criminal cases. Enforcement procedures are lengthy and complex. There is also high turnover among inspectors and some evidence of political influence in the enforcement process. Citizen suits to enforce environmental laws have become increasingly important. Suits are most common where it is teasiest to prove a violation.
- 14.3 The current regulatory approach, dubbed command-and-control (CAC), is not cost-effective. Uniform emission standards and a new-source bias (the “command” aspects), along with technology-based regulation (the “control” aspect), mean that the regulatory system has little short-run flexibility to adapt to local conditions. Provided that monitoring and enforcement are adequate, increased flexibility can allow firms to pursue cost-saving, pollution-neutral measures. In addition, the CAC system discourages long-run technological innovation in pollution-control technology.
- 14.4 Is regulation alone sufficient? Obstacles to further regulatory progress include economic growth, the increasing importance of nonpoint and mobile pollution sources, and the leakage problem. These three factors imply that the marginal cost of end-of-the-pipe regulation will rise; unless regulation induces rapid innovation, leading to clean technology development, the quality of the environment must deteriorate. But, the chicken-and-egg relationship between regulation and new technology development suggests a critical role for the direct government promotion of clean technology.
REFERENCES
- Alberini, Anna, Winston Harrington, and Virginia McConnell. 1993. Determinants of participation in accelerated vehicle retirement programs. Paper presented at the Eastern Economic Association Meetings. Boston, MA, 16 March.
- Cohen, Mark A. 1992. Environmental crime and punishment: Legal/economic theory and empirical evidence on enforcement of environmental statutes. Journal of Criminal Law and Criminology 82(4): 1053–108.
- England, Richard, and Eric P. Mitchell. 1990. Federal regulation and environmental impact of the U.S. nuclear industry. Natural Resources Journal 30: 537–59.
- EPA official quits, chastises White House. 2001. Portland Oregonian, 1 March.
- Freeman, A. Myrick. 2000. Water pollution policy. In Public policies for environmental protection, ed. Paul Portney and Robert Stavins. Washington, DC: Resources for the Future.
- Gruenspecht, Howard, and Robert Stavins. 2002. New source review under the Clean Air Act: Ripe for reform. Resources 147: 19.
- Penalties aren’t stopping land, water pollution. 1992. Associated Press Story reported in the Spokane Spokesman-Review, 12 December.
- Sanjour, William. 1992. What EPA is like and what can be done about it. Washington, DC: Environmental Research Foundation.
- Schwartz, Mark. 2008. The performance of the Endangered Species Act. Annual Review of Ecology, Evolution and Systematics 39: 279–99.
- Sigman, Hillary. 2000. Hazardous waste and toxic substances policy. In Public policies for environmental protection, ed. Paul R. Portney and Robert N. Stavins. Washington, DC: Resources for the Future.
- State of the Air. 2016. American Lung Association Annual Report. http://www.stateoftheair.org/.
- Suckling, Kieran, Noah Greenwald, and Tierra Curry. 2012. How the Endangered Species Act is saving America’s wildlife. Washington, DC: Center for Biological Diversity.
- U.S. Environmental Protection Agency. 2000. Taking toxics out of the air. www.epa.gov/air/toxicair/takingtoxics.
- _____. 2007. Fish advisories. www.epa.gov/waterscience/fish/advisories/2006/index.html#synopsis.
- _____. 2008. Report on the environment. No. EPA/600/R-07/045F. Washington, DC: Author.
- _____. 2009. Air trends. www.epa.gov/airtrends/aqtrends.html#comparison.
- _____. 2011a. The benefits and costs of the Clean Air Act from 1990–2020. http://www.epa.gov/air/sect812/feb11/fullreport.pdf.
- _____. 2011b. National listing of fish advisories: General Fact Sheet 2010. http://water.epa.gov/scitech/swguidance/fishshellfish/fishadvisories/general_factsheet_2010.cfm.