Chapter 6. Wireframes
▪ Think about wireframes
▪ Create a task flow or site map wireframe
▪ Link site map pages to other pages
▪ Create skeletal and detailed wireframes
▪ Apply the Excel prototyping methodology to wireframes
Introduction to Wireframes
Wireframes derive their name from the frameworks that sculptors and modelers use to provide the starting shape of three-dimensional work; the artist then “fleshes out” the design with clay or other material, just as you will “flesh out” your design with higher-fidelity content as you progress through the iterative prototyping process. Excel provides the framework for building and refining your wireframes.
You produce wireframes to help explore interactions and flows and to try out different locations for interface elements without spending time and effort on high-fidelity graphics. Your first wireframe might be sketched on a piece of paper or a whiteboard and then further developed in Excel. You can include some simple shading or a few standard colors to liven up the visual aspects, but you don't have to. Your primary audience is your design team and other internal stakeholders. Showing wireframes to customers will often simply confuse them.
When you show these sketch-type wireframes to end users or other external stakeholders, increase the fidelity to the point where they understand what they are looking at, but no higher. These sketch-like wireframes invite end users to comment thoroughly on them. Wireframes that look complete tend to get lighter, less substantial feedback, such as comments on font colors, instead of the more conceptual feedback that the sketch wireframes elicit from users.
Think of your wireframe as a brainstorming tool. Because they are created so quickly, you won't get too attached to your wireframes—you will create and discard many wireframes in the process of designing your site. Wireframes enable people to handle quick design iterations without getting caught up in either the details of high-fidelity graphics or the emotional attachment of having worked on something for a long time. Wireframes are a conceptual tool at the start of the design process, but later on the fidelity can be high enough to be the basis for implementation.
Wireframe fidelity ranges from site maps representing site structure to skeletal user interface (UI) wireframes with placeholders for text and graphics as well as detailed wireframes with actual graphics and text. If you create several wireframes representing related windows in your software, you can link them together to simulate the application flow. Finally, you can include color, high-fidelity graphics, and real text elements that will feed into the high-fidelity prototypes for your software.
Task Flow or Site Map Diagram
A task flow or site map provides a conceptual framework for your software. A task flow provides a diagram of how a user will interact with your software to complete a task. Usually each item in the flow represents a window or the state of a window. Often these task flows help you make key decisions on design and navigation structure before going into detailed design.
A site map, on the other hand, is a visual, hierarchical guide to the organization of a Website. Building a site map helps you determine the relationships and links between various elements and pages of the Website and can facilitate discussion about Website content and task flows. Site maps typically look like corporate organization charts, but be careful that your Website does not simply mirror your company's organization chart. Visitors to your site don't care how your company is organized—they care about locating the information that they came to find and about reaching the goal that brought them to your site, such as buying a book.
In the following procedures we show you how to build these high-level structural wireframes. The techniques are the same for these prototypes, so we provide only an example for a site map. For a task flow you would substitute the task flow diagram for the hierarchical site map.
In this exercise you will build a flowchart using Excel's AutoShapes and Connectors.
To Create Site Map Wireframe Boxes:
1 Begin with a fresh canvas worksheet in a new workbook and rename the worksheet Site Map.
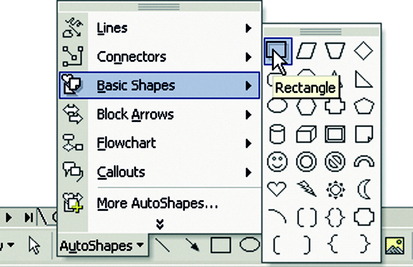
2 From the Drawing menu, choose AutoShapes > Basic Shapes.
3 Select a simple rectangle (Figure 6.1).
4 Place the cursor near the top of the worksheet; then click and drag to create a rectangle.
5 To label the box, highlight it by right-clicking the border and choose Add Text from the menu. Inside the box a line appears, indicating that you can enter text.
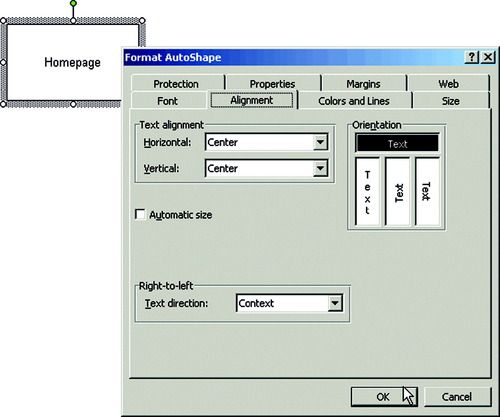
6 Enter the text Homepage. The default text position will be in the top right. In this example, center the text in the box both vertically and horizontally. Right-click the box and select Format AutoShape, select the Alignment tab, and choose Horizontal Center and Vertical Center (Figure 6.2, page 112).
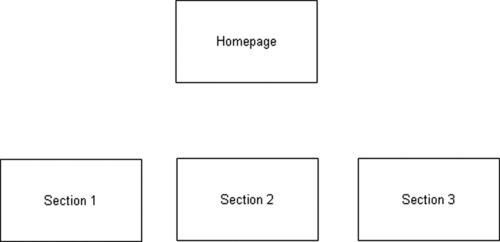
7 Repeat this process, adding three boxes in a line below the Homepage box. Label them Section 1, Section 2, and Section 3 (Figure 6.3, page 112).
In a site map you can indicate the relationship between the different boxes that you create. The position of the boxes indicates hierarchy that is usually combined with connector lines. Excel offers automated connector lines as part of the standard AutoShapes menu.
To Add Connectors Between Boxes:
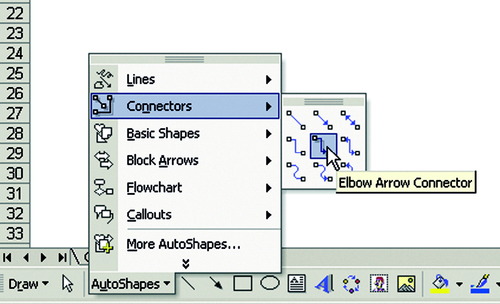
1 Choose AutoShapes > Connectors > Elbow Arrow Connector (Figure 6.4).
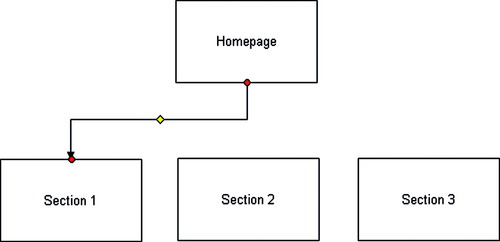
2 Select the box where you want the connector to begin.
The active points on the box are indicated by small circles as you position your cursor over them. Click one of the points that indicate position to anchor the connector. Click an anchor point on a different box to position the connector end (Figure 6.5).
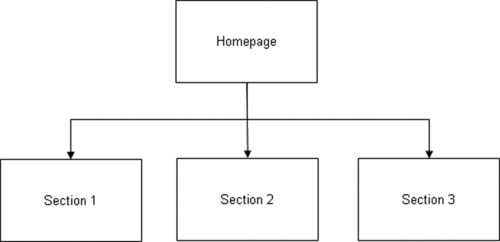
Multiple connectors can be attached at a single point to connect one box to several other boxes (Figure 6.6, page 114).
The Hyperlinked Site Map
Often a site map is a standalone page among the many pages of documentation. Using Excel, the site map can take on an added dimension or function by using the feature that adds a hyperlink to a shape. Your static boxes can then link to the worksheets that they represent in your designs.
To Create an Interactive Site Map:
1 Create four new worksheets in your site map document, representing the four site map boxes: a homepage and three section pages.
2 Highlight the box labeled Homepage, right-click the box, and select Hyperlink.
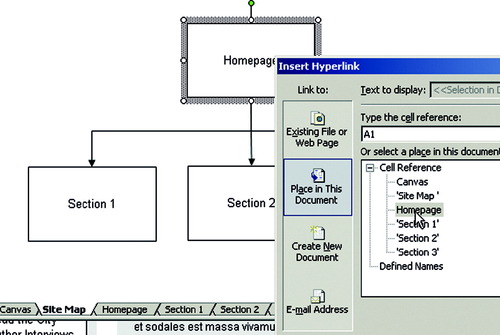
3 In the Insert Hyperlink dialog box, select Place in This Document, find Homepage in the site map (Figure 6.7), and click OK.
The Homepage box in the site map is now a hyperlink linked to the wireframe worksheet that it represents. Repeat this procedure for each box. Now your site maps can represent a high-level structure and can also act as an index that links to the page-level wireframes. Use this technique early in the design process as a proof of concept for a navigation structure or as a way to navigate across many worksheets in a wireframe, demonstrating the relationship between the different linked worksheets.
From Skeletal to Detailed Wireframes
Wireframes that describe screen designs can range from the simple to the complex. A good wireframe always remains conceptual and simple in its graphical representation, but it can become more specific in the way it conveys content architecture, structure, requirements, and task flow.
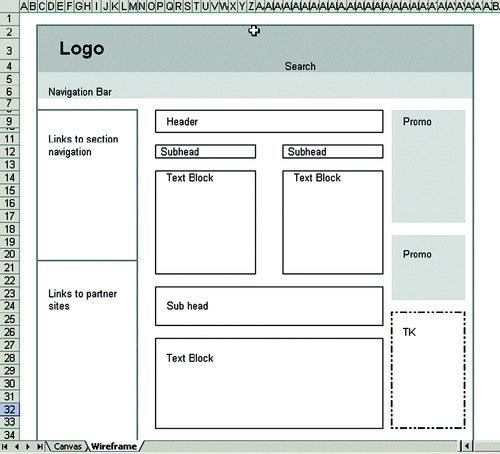
How you approach building a wireframe in Excel depends on the kind of wireframe you need. In this example of a skeletal wireframe, an entire worksheet is built using only cells with borders and colors. Refer to Chapter 4 to see how to format cells.
The minimal descriptive text is written in the cells within the boxes. Working in this manner is quick and easy—a perfect way to describe an interface concept that doesn't need much detail.
Though it is true that this very low-fidelity wireframe (Figure 6.8) could be built in other applications, building it in Excel offers some advantages that other applications do not have. One advantage is keeping all your designs in a single document file, which lets you easily compare different iterations as you try out various ideas. A single file also lets you share all your progress with others on your team. As your ideas begin to take form, you will have them together as tabbed worksheets in your workbook, where they can be rearranged, renamed, and presented as a progression of visual ideas.
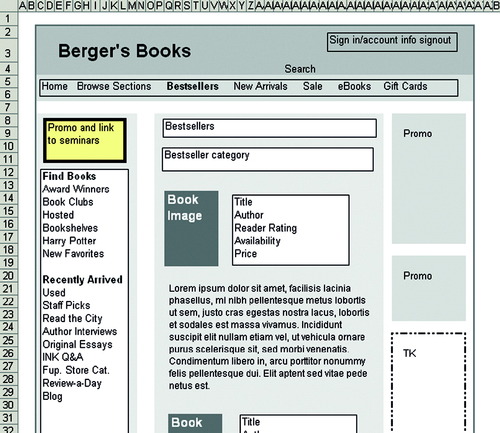
To build the more-detailed wireframe in this example, using a combination of table cells and AutoShapes provides greater flexibility and control in what you can describe visually. In the building of this wireframe, the grid structure of the worksheet is built using the previous wireframes' colored and bordered cells. This basic structure remains unaffected by any shape put on top and acts like a background defining the site grid. The content, which is described in greater detail than in the skeletal wireframe, is included in shapes positioned on the worksheet. In some shapes the text shows accurate content, while other shapes are not specific and merely offer greeked text to indicate an undefined content area. Different borders, colors, and border style can emphasize a section of the design or highlight important aspect of the design concept, as shown in Figure 6.9.
The Excel Methodology
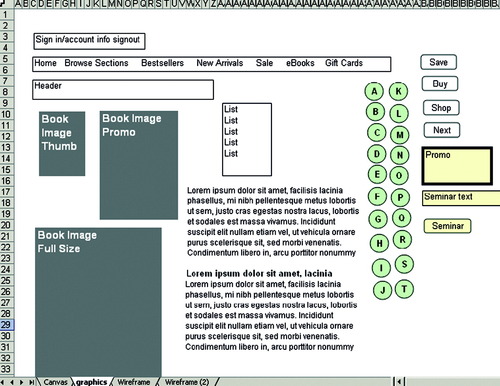
Even though wireframes are not detailed, you can still use the same methodology in building wireframes as you would for building more complex design prototypes. In Chapter 4 you learned how to build template worksheets with a library of widgets and detailed buttons to facilitate reuse in complex worksheets. You can do the same for your wireframe template. The elements that you put in your graphics library might be nothing more than simple boxes or shapes filled with greeked text. You can save time and effort by not having to create new elements; you can copy and paste them from your template worksheets into your wireframes. When you include reusable elements in your wireframe Excel file, other members of your team can work with the same elements that you used, ensuring consistency and a quick turnaround of iterations (Figure 6.10 and Figure 6.11).
References
1. Jonathan, Arnowitz; Michael, Arent; Nevin, Berger, Effective Prototyping for Software Makers. (2007) Morgan Kaufmann, San Francisco.
2. Carolyn, Snider, Paper Prototyping: The Fast and Easy Way to Design and Refine User Interfaces. (2003) Morgan Kaufmann, San Francisco.
3. Jo Ann, Hackos; et al., User and Task Analysis for Interface Design. (1998) Wiley & Sons, Hoboken, NJ.
..................Content has been hidden....................
You can't read the all page of ebook, please click here login for view all page.