
Ulick Richardson Evans was born on March 31, 1889 in Wimbledon. His father was a journalist and took Ulick to Switzerland where he introduced the young boy to mountaineering. Outdoor activities remained a passion throughout Evans' life. Ulick attended Marlborough College (1902–1907) and then Kings College, Cambridge (1907–1911). Subsequently, he studied electrochemistry in Wiesbaden and later at University College, London. These initial investigations of electrochemistry were ended by World War I when Evans served in the Army. He was stationed in the Middle East, returning to Cambridge in 1921.
When Evans began his career, there was an extremely poor understanding of corrosion. The attack of metals was all too familiar—There were lots of data and many empirical approaches to its prevention, but the scientific interpretation of corrosion was scant. It was accepted that corrosion associated with two dissimilar metals in contact was electrochemical in nature. However, when a metal is placed in an acid solution, the simultaneous dissolution of the metal and hydrogen evolution is observed. How could this homogeneous dissolution be anything more than a simple chemical replacement reaction? In what way could the corrosion of iron exposed to the atmosphere be driven by electrochemical processes? Why does the section of a sea pilings located away from the oxygen at the surface corrode faster than the section near the surface of the water?
Although W.R. Whitney presented the first convincing evidence of the electrochemical nature of corrosion in 1903, there was still much confusion at the start of the twentieth century. Evans quickly brushed away many of the inconsistencies and misunderstandings. His impact on the community is no doubt in part due to his ability to lecture in several languages and to his prolific writing. His first book, started before the war, was published in 1923, Metals and Metallic Compounds. He published a second book the next year, with three additional books (with multiple updates) and about 200 manuscripts over a long career. A second factor in his lasting influence can be attributed to his focus on both the theoretical and practical aspects of corrosion. His life-long avocation became addressing the lack of fundamental understanding of corrosion and the use of a scientific basis to quantify corrosion. Along with his picture is a figure from his 1929 paper of what is known today as an Evans diagram. This diagram shows the anodic and cathodic reactions for a corrosion system and illustrates the so-called corrosion potential. The Evans diagram has proved invaluable in the analysis of corroding systems.

Source: From U.R. Evans (1929) The distribution and velocity of the corrosion of metals. J. Franklin Inst., 208, 45–58. Reprinted with permission from Elsevier.
Ulick Evans was elected Fellow of the Royal Society in 1949. He was awarded the Olin Palladium Medal from Electrochemical Society in 1955—the Society's highest technical award. The Institute of Materials, Minerals, and Mining now provides an annual award in honor of U.R. Evans for outstanding contributions to corrosion science. Two of his students, T.P. Hoar and R.B. Mears, established the basic principles for cathodic protection.
Evans died on April 3, 1980. Today, corrosion of metals is recognized as principally an electrochemical process. This was not the case at the start of the twentieth century. His legacy is aptly described as the father of the modern science of corrosion.
Image Source: Courtesy of National Portrait Gallery, London.
Chapter 16
Corrosion
Corrosion is the unwanted attack of metals by their environment. The many attractive properties of metals have led to their widespread use in industry and, frankly, in nearly every aspect of our lives. Metals, however, are susceptible to corrosion. It is therefore important that engineers understand the conditions under which corrosion is likely to occur. They should also be able to measure, predict (to the extent possible), and mitigate the negative impacts of corrosion. This chapter will help you to apply the principles of electrochemical engineering that you have learned to the analysis of corrosion systems. While the chapter addresses several important aspects of corrosion, it is by no means comprehensive. In fact, corrosion is an interdisciplinary topic, and a complete understanding requires the combined expertise of electrochemical engineers, material scientists, metallurgists, and mechanical engineers, among others.
We limit our discussion of corrosion to electrochemical corrosion, or corrosion that is the result of electrochemical processes. We also limit ourselves to aqueous corrosion, which is corrosion that involves an aqueous electrolyte. Electrochemical corrosion is the consequence of an electrochemical cell where the anode is the metal of interest. Such corrosion is, by definition, oxidation of the metal according to a reaction such as
where iron has been used as an example. In other words, when we say that a metal is corroded, we are saying that a portion of the metal has been oxidized to form soluble products (e.g., Fe2+ ions in solution), insoluble products such as a salt or oxide layer (e.g., the rust layer on your old bike is a form of iron oxide), or a mixture of the two.
16.1 Corrosion Fundamentals
A complete electrochemical cell is required for electrochemical corrosion to occur. The components of that cell include the following:
- The metal (anode)
- A cathodic reactant with an equilibrium potential higher than that of the metal
- Electrical contact between the anode and cathode
- An electrolyte that permits current flow in solution between the anode and cathode
These constituents, of course, should not be a surprise by now. However, as shown in Figure 16.1, the form in which you find them can be quite different in corroding systems. None of these cell configurations looks like the typical electrochemical cell presented in Chapter 1. This lack of similarity partly explains why early researchers did not immediately connect corrosion to an electrochemical mechanism. Let's first examine galvanic corrosion where the link with a conventional electrochemical cell is the most direct. In galvanic corrosion, an active metal is electrically connected to a more noble metal (one that is less likely to corrode). This causes preferential corrosion of the more active metal as shown in Figure 16.1, and thus it is one type of localized corrosion. Recall the Daniel cell, Figure 1.1. There were two metals, Zn and Cu, separated by an electrolyte. Electrons flowed through an external circuit. Now imagine that in place of the resistor of Figure 1.1, the two metals are brought into direct contact. In fact, one important difference between conventional cells is that the anodes and cathodes in these corrosion cells are not only electrically connected but they are also short circuited. An electrolyte surrounds the electrodes, allowing ionic current to flow. As in the Daniell cell, the zinc (active metal) is oxidized. The cathodic reaction, however, will be different because copper ions are not present in solution. These cathodic or reduction reactions will be discussed shortly. You can see that the difference between the galvanic corrosion example and the typical electrochemical cell is small. We won't discuss all of the types shown in Figure 16.1 in detail now, but as you work through this chapter, try to bridge mentally between these corrosion cells and the prototypical electrochemical cell. A variety of geometries and electrolyte configurations are possible, but in the end the same electrochemical principles apply.

Figure 16.1 Examples of different types of corrosion.
Pitting and crevice corrosion are also forms of localized corrosion, where the dissolution reaction takes place at discrete locations on the surface. In pitting corrosion, the local environment in the pit stabilizes the corrosion; the same is true in crevice corrosion for the local environment in the occluded area. There are many other forms of corrosion. We have chosen some of the simpler forms for our discussion in this chapter.
In the galvanic corrosion example, oxidation takes place on one metal and a reduction process occurs preferentially on the other. In contrast, for uniform corrosion, both the metal dissolution and cathodic reactions take place simultaneously over the entire surface of a single metal. This idea that both reactions can occur on the same surface seems counter to everything that we have learned and will require some careful thought (Section 16.3).
Knowledge of the cathodic reactions is critical to understanding corrosion. The most common cathodic reactions in aqueous systems are oxygen reduction and hydrogen evolution, shown below for both acidic and basic solutions:
Both of these reactions bring some interesting aspects to the corrosion problem. For example, oxygen gas (O2) is only sparingly soluble in aqueous solutions. Consequently, its reaction rate is often limited by how fast it can get to the surface, which can vary widely with the thickness of the electrolyte layer. In the case of hydrogen evolution, the solvent is reacting. The equilibrium potentials of these reactions vary with pH. Also, both of these cathodic reactions can influence the local pH, which can also have a significant impact on corrosion as discussed below.
Other cathodic reactions are also possible, although less common. For example, metal ions in solution such as ferric ions may be reduced:
The reduction of oxidizing acids may also occur. In some situations, the plating of metals out of solution can contribute to the cathodic current.
16.2 Thermodynamics of Corrosion Systems
In this section, we examine the thermodynamics of corrosion cells. First, we should explain an apparent contradiction. As noted above, we described the corrosion system as being electrically shorted. How then can we apply thermodynamics and what can we learn about corrosion from an analysis of equilibrium? Clearly, we do not have an open-circuit voltage that is determined by the equilibrium of two half-cell reactions. The key question that can be answered with thermodynamics is whether or not a corrosion reaction is favorable and may, therefore, occur spontaneously. To do this, we imagine that the anodic and cathodic reactions take place on separate electrodes and consider whether there is a potential difference in the absence of current flow. A thermodynamically favorable corrosion reaction is a reaction that has a negative free energy (positive cell potential) with the metal as the anode. We follow the same procedure that you learned in Chapter 2, and will use the same simplified activity corrections in order to streamline our analysis. A more detailed analysis could be performed, but this reduced level of complexity is commonly used and is adequate for our purposes. Once again, we examine the driving force for corrosion by examining the potential change (Gibbs energy difference) associated with the overall reaction. Let's consider a few possibilities.
If a corrosion reaction is not thermodynamically favorable, we can be confident that it will not take place. The term used to describe this condition in the corrosion field is immunity. What if the reaction is thermodynamically favorable? Does that mean that we need to worry about the metal dissolving away right before our eyes? Fortunately, no. A thermodynamic analysis does not provide information about the rate at which corrosion will happen (don't worry, we will talk about rate shortly). In fact, there are some metals like aluminum that are very stable and yet are thermodynamically favored to corrode.
If you look at the value for aluminum in Appendix A, you will see that it is very reactive, with standard potential of −1.66 V. Why, then, doesn't it readily corrode? Aluminum is stable because under many conditions it forms a dense oxide film on its surface that impedes the corrosion reaction. We call this film a passive layer, and refer to the metal as passivated. Metals are passive when they form stable, protective films upon oxidation. Many common metals are not stable thermodynamically, but are functionally stable because of passive films.
Thermodynamics can also help us determine when a metal is likely to be passive by considering the relative stability of different corrosion products. In electrochemical corrosion, we are interested in stability in electrolyte solutions of different composition. A critical variable in determining the stability of surface layers is the pH. The potential is also critical in determining corrosion behavior. We can use a Pourbaix diagram (Chapter 2) to identify regions according to the dominant form of the metal of interest as a function of potential (SHE) and pH.
A Pourbaix diagram for Ni is shown in Figure 16.2, recall that dashed lines a and b correspond to the hydrogen reaction and oxygen reaction, respectively. As you may remember, each solid line in the diagram represents equilibrium of an electrochemical or a chemical reaction. Therefore, the diagram is only as accurate as the reactions and species considered. For this diagram, the following reactions were included:
You should be able to associate each of these reactions with the corresponding line in the diagram. For example, the first reaction describing the conversion of nickel to nickel hydroxide corresponds to line 2 in the diagram.

Figure 16.2 Pourbaix diagram for nickel and resulting corrosion map showing regions of immunity, corrosion, and passivation. The numbers and letters correspond to the equations below and in those used in Pourbaix's book.
Each region in the diagram is labeled by the nickel-containing species that is thermodynamically favored for that region. Where needed, a concentration of 10−6 M was used to establish region boundaries. The region labeled Ni is where metallic nickel is favored. This region is labeled “immunity” in Figure 16.2b because there is no driving force for corrosion, and the metal is thermodynamically stable. In contrast, corrosion is favored in regions where a nickel-containing ion is the thermodynamically favored species. Stable ionic species include Ni2+ at neutral or acidic pH values, and ![]() at high pH. Passivation is expected in regions where a solid nickel-containing species is stable; these species include Ni(OH)2, Ni3O4, Ni2O3, and NiO2, denoted as “passivation” in Figure 16.2b. An effective strategy for mitigating corrosion would move the metal into a region of immunity or passivity by, for example, changing the potential.
at high pH. Passivation is expected in regions where a solid nickel-containing species is stable; these species include Ni(OH)2, Ni3O4, Ni2O3, and NiO2, denoted as “passivation” in Figure 16.2b. An effective strategy for mitigating corrosion would move the metal into a region of immunity or passivity by, for example, changing the potential.
From thermodynamics, we have seen that we can determine if there is a driving force for corrosion and can gain insight into the products of corrosion reactions. We can also determine under what conditions those products are likely to lead to passivation of the surface. Such information is valuable for the assessment of corrosion. However, we must remember that our analysis is limited to the specific reactions considered and may not be accurate if important reactions have been left out. For example, complexation of metal ions with anions in solution may stabilize the metal ions and prevent the formation of solid, passivating products, significantly changing the corrosion characteristics of the system. Also, a thermodynamic analysis cannot provide information on the rate of corrosion or the integrity of surface layers that may be formed. In spite of these limitations, thermodynamics and Pourbaix diagrams provide valuable insight and are used frequently by corrosion engineers.
Another important aspect of metal behavior related to corrosion can be seen in Figure 16.2. If we follow a vertical line from the bottom to the top of the diagram, for example, at pH = 8, we see that, as the potential increases, we move from immunity, where metallic nickel is thermodynamically favored, to corrosion where Ni2+ is the stable species, and finally to passivation where nickel oxide is thermodynamically preferred. This type of passive behavior with increasing potential is a characteristic of several important metals, including iron, nickel, chromium, titanium, and their alloys. Figure 16.3 illustrates the I–V curve for a passivating metal. As you can see, the current drops abruptly at values of the potential where passive behavior is achieved. This phenomenon is the basis for anodic protection, a strategy that minimizes corrosion by increasing the potential so that the metal is in the passive region.

Figure 16.3 Current–voltage curve illustrating passivation.
16.3 Corrosion Rate for Uniform Corrosion
As noted in the previous section, thermodynamics provides important insight into corrosion, but cannot offer information regarding the rate of corrosion. In this section, we examine a method for determining corrosion rate of a uniformly corroding surface.
In uniform corrosion, both the anodic (dissolution) and cathodic reactions take place evenly on the same surface. We've seen instances where multiple reactions occur on the same electrode. In fact, in Chapter 3 we introduced the current efficiency to describe such a situation. In those instances, the reactions were either both anodic or both cathodic. There is, however, no reason why oxidation and reduction reactions can't occur simultaneously on the same electrode. This situation is precisely what is occurring during uniform corrosion. One of the reactions that takes place is the oxidation of the metal, which is the corrosion reaction of interest.
For a uniformly corroding surface, the potential naturally moves to the corrosion potential, where the anodic and cathodic currents are equal. Why does this happen? To think about this, let's first consider the situation where the anodic current is higher than the cathodic current. Such a situation would lead to an accumulation of electrons in the metal, which would decrease its potential. As we learned previously, a decrease in potential would reduce the rate of the anodic reaction and increase that of the cathodic reaction. If the rate of the cathodic reaction were higher, there would be a net consumption of electrons and a corresponding rise in the potential of the metal. In this case, the increase in the potential would reduce the rate of the cathodic reaction and increase that of the anodic reaction. Both of these unbalanced situations move the system toward the stable condition where the anodic and cathodic currents are equal and there is no net buildup of charge.
Evans Diagrams
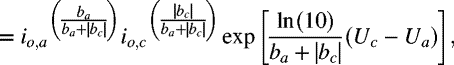
A diagram similar to the Tafel plot, Figure 3.7, can be used to illustrate and to help us analyze uniform corrosion. As shown in Figure 16.4, the current–voltage curves for both the anodic and cathodic reactions are drawn on the same plot. The potential is relative to a common reference electrode and is plotted as a function of the logarithm of the absolute value of the current for each reaction. Figure 16.4 shows the cathodic evolution of hydrogen and anodic dissolution of iron in deaerated solution, where Tafel expressions have been used for the kinetics. Tafel expressions are frequently used for corrosion systems and are applicable in situations where there is a significant difference in the equilibrium potentials for the two reactions. Typically, just one branch (anodic or cathodic) of a given reaction is plotted in the diagram, although this is not a requirement. In Figure 16.4, the cathodic branch has been plotted for the hydrogen reaction, and the magnitude of the cathodic current is seen to increase as the potential decreases, which corresponds to a higher cathodic overpotential. The slope of the resulting line is negative. In contrast, the anodic branch is plotted for iron, and the current increases with increasing potential, which corresponds to a higher anodic overpotential. The slope of the Tafel line for the anodic reaction is positive. The two curves are independent, and the current for a given reaction goes to zero at its equilibrium potential, shown in the diagram for iron (see dotted line asymptote on the log plot). The equilibrium potential for the hydrogen reaction is not shown.

Figure 16.4 Evans diagram showing iron dissolution and hydrogen evolution (pH = 0.9, 1 N HCl, deaerated). Source: Adapted from R. J. Chin and K. Nobe 1972, J. Electrochem. Soc., 119, 1457.
The potential at the intersection point of the two curves is defined as the corrosion potential, which we will represent as Vcorr to be consistent with the notation used in the rest of the text. We note, however, that Ecorr is frequently used in the corrosion field. Vcorr represents the potential at which the current from the cathodic reaction is equal to that from the anodic reaction. Hence, the net current at the corrosion potential is zero, since the rates of the two reactions are balanced. The corrosion potential is the potential at which the iron will undergo uniform corrosion in the absence of an applied potential, and can be readily measured. The current at the intersection point is the corrosion current (icorr) and is the rate at which the metal will dissolve. Note that the overpotential for either the anodic or cathodic reaction at a given value of the potential is simply the difference between that potential and the equilibrium potential for the reaction of interest. Figure 16.4 is commonly known as an Evans diagram, and is frequently used by corrosion engineers. You should be familiar with this type of diagram as it is an effective way to illustrate the interaction of multiple reactions that participate to cause corrosion. Importantly, it includes information on the rate of corrosion that was missing from the equilibrium analysis of the previous section. Use of the Evans diagram is explored in Illustration 16.2.
As with any tool, Evans diagrams have their limitations. For example, both Vcorr and icorr are concentration dependent, reflecting the concentration dependence of the individual reactions. Changes with concentration and other important variables, such as temperature, are not shown in the diagram. Therefore, the diagram is valid only for the specific conditions under which the data were measured. Still, the diagram is an extremely valuable tool for conceptual understanding. If additional detail is required, it is possible with today's engineering tools to include the full compositional and temperature dependences in a numerical solution of the equations for a broad set of conditions, once the required parameters are known.
In situations where the exchange current densities and equilibrium potentials are known for a single anodic and cathodic reaction at the conditions of interest, Vcorr and icorr can be solved for analytically. Assuming that Tafel kinetics apply, where a refers to the anodic (metal) reaction and c refers to the cathodic reaction:


where b is the Tafel slope introduced in Chapter 3, which is negative for the cathodic reaction:
Note that, in contrast to the way these subscripts are used in the Butler–Volmer equation, the a and c refer to two different reactions: the anodic or corrosion reaction and the corresponding cathodic reaction. The concentration and temperature dependence of Vcorr and icorr are derived from the concentration and temperature dependence of both the equilibrium voltages and exchange-current densities.
Alternatively, Vcorr and icorr can be determined numerically for a variety of conditions if the parameters are known. The equations used in the numerical procedure are actually simpler, and numerical solution does not present a challenge with modern tools. Also, the numerical procedure can be used in situations where there are multiple cathodic reactions by simply adding terms for the additional reactions. Please see the illustration below in the section on “Multiple Reactions” for additional information.
Experimental Measurement of Corrosion
In practice, experimental measurement of the corrosion behavior is more common than prediction of that behavior from the fundamental kinetic properties of the system. The corrosion potential is the natural potential of the system and can be measured easily against a reference electrode. Common reference electrodes used for this purpose include Ag/AgCl, Cu/CuSO4 (CSE), and to a lesser extent SCE and SHE. Placement of the reference electrode is not critical for measurement of the corrosion potential of uniformly corroding systems because the net current is zero and, therefore, there is no ohmic drop due to current flow. Note that the measured value of Vcorr depends on environmental variables, such as composition and temperature, and should not be treated as a constant.
Measurement of the current is more problematic since the net current at the corrosion potential is zero, and it represents the sum of anodic and cathodic currents. The average corrosion rate can be determined directly for some samples by measuring the weight loss of the sample.
A corrosion-related polarization curve can also be measured by varying the potential of the sample both above and below the corrosion potential and measuring the current. In order to vary the potential and measure the current, the setup is modified as shown in the inset of Figure 16.5. The sample functions as the working electrode and a counter electrode is introduced. Appropriate ohmic corrections should be made to these measurements to account for the position of the reference electrode. The measured current represents the sum of both the cathodic and anodic currents as illustrated in Figure 16.5. Note that the combined curve approaches the anodic curve at potential values significantly above Vcorr and the cathodic curve at potential values significantly below Vcorr. Thus, it is possible to extract information about the individual reactions from these data. Care should be exercised, however. Movement away from the corrosion potential may introduce additional reactions that did not occur at an appreciable rate at the corrosion potential. Remember, although the polarization data in Figure 16.5 look like the data from a single reaction, Vcorr does not represent an equilibrium potential, and the system does not approach equilibrium. If we assume Tafel kinetics and a single cathodic and anodic reaction, the following expression can be written for the combined current in terms of Vcorr and icorr. This equation is similar in form to the Butler–Volmer equation:


The limitations of Equation 16.7 should be considered when fitting data to this expression. Also, remember that this type of analysis is strictly valid only for systems undergoing uniform corrosion of the surface.
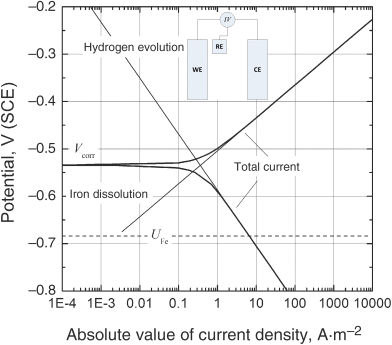
Figure 16.5 Relationship between the total current and the anodic and cathodic currents for a corrosion sample at different potentials.
Equation 16.7 is the basis for a commonly used corrosion technique called linear polarization resistance. Linearization of Equation 16.7b about the corrosion potential yields
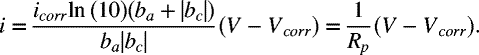
Rp is defined as the polarization resistance:

The units for the polarization resistance are ![]() ; alternatively, the use of the current instead of the current density would yield a resistance in ohms. If the Tafel coefficients are known, then the corrosion current density (or current) can be calculated from the polarization resistance as follows:
; alternatively, the use of the current instead of the current density would yield a resistance in ohms. If the Tafel coefficients are known, then the corrosion current density (or current) can be calculated from the polarization resistance as follows:
This calculation requires that the Tafel coefficients are known. Equation 16.9 is a form of the Stern–Geary equation.
Mass-Transfer Effects
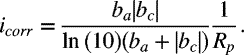
Whereas Tafel kinetics is frequently well-suited to the analysis of corrosion rates, there are situations where a process other than kinetics controls the rate. One important example is that of oxygen reduction. Since the solubility of oxygen in water is quite low, the reduction of oxygen becomes limited by the mass transport of oxygen to the surface at high overpotentials as shown in Figure 16.6 for laminar flow over a flat plate. Note that the overpotential for the cathodic reduction of oxygen increases as the absolute value of the potential decreases. Once the limiting current is reached, oxygen reduction is no longer a function of potential (see Section 3.3). The limiting current, however, is a function of factors that influence the rate of mass transfer, such as the velocity of the fluid (Re) as illustrated in Figure 16.6.
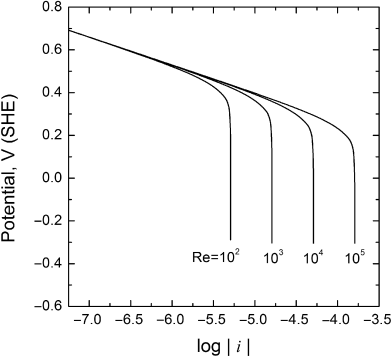
Figure 16.6 Oxygen reduction current at different flow rates for fully developed laminar flow over a flat plate.
In Chapter 3, we developed an expression for the current density that included mass transfer and was applicable for the entire range of potentials. This derivation was possible because both the mass-transfer expression and the kinetic expression were linearly dependent on a single surface concentration; that made it possible to eliminate the surface concentration and derive a single expression that does not explicitly include the concentration at the surface. Unfortunately, it is not always easy or possible to derive such an expression when the dependence of the kinetic expression on concentration(s) is nonlinear. This is the case for oxygen reduction. Since it is critical to account for both mass transfer and kinetics to accurately determine the corrosion potential, we need a procedure by which this can be done.
Before we discuss the procedure, let's take a moment to examine the physical situation. The kinetic and the mass-transfer resistances are in series and, under steady conditions, the kinetic rate must be equal to the rate of mass transfer. The consumption rate of oxygen becomes constant once the mass-transfer limit is reached, even if we continue to change the potential. How is it possible for the kinetic rate and the rate of mass transfer to be equal if the potential continues to change even after the mass-transfer limit has been reached and remains constant? It turns out that an increase in the potential driving force for the reaction is offset by a reduction in the exchange-current density as the surface concentration decreases. After the surface concentration of oxygen decreases to 1% of the bulk value, the mass-transfer limited rate does not change appreciably. In contrast, the exchange-current density continues to decrease with decreasing surface concentration at a given potential until the kinetic rate is equal to the rate of mass transfer. From a practical perspective, it follows that we can use the mass-transfer expression alone to calculate the oxygen transport rate once the surface concentration is less than or equal to 1% of the bulk concentration, without introducing significant error. If the surface concentration is greater than that value, we should use the kinetic and mass-transfer expressions together to calculate the rate.
These physics are reflected in the following procedure:
- Estimate the mass-transfer limited current for the flow conditions of interest. Often this can be done with a simple expression such as the mass-transfer portion of Equation 3.32. The required mass-transfer coefficient can be determined as illustrated below.
- Approximate the voltage at which the limiting current is reached. This step can be done with the Tafel expression by assuming that the surface concentration is 1% of the bulk value, and that the current is equal to 99% the limiting current. We will refer to this potential as V99.
- Solve for the corrosion current and potential assuming that the system is mass-transfer controlled. In other words, find the potential at which the anodic current is equal to the limiting current of the cathodic reaction (or vice versa if the anodic curve is the one that is mass-transfer limited).
- Evaluate the answer.
- If the potential found in #3 is less than V99, then the potential from #3 is the corrosion potential, and the corrosion current is equal to the mass-transfer limited current.
- If the potential from #3 is greater than V99, then redo the calculation using the kinetic expression and the mass-transfer expression together, since the corrosion current will be less than the mass-transfer limited current. Note that both equations should be used since the surface concentration may be different than the bulk value because of mass transfer, and this will affect the calculated rate.
The two situations are illustrated graphically in Figure 16.7. The vertical portion of the cathodic curve is the mass-transfer limited region where the current is independent of the potential. Two anodic curves are shown: (a) one that intersects in the mass-transfer limited region and (b) one that intersects in the region where rate effects also contribute (>V99). The procedure is provided in Illustration 16.3:

Figure 16.7 Illustration of corrosion potential determination for a cathodic reaction that is mass-transfer limited.
Multiple Reactions
In real systems undergoing uniform corrosion, it is possible to have multiple cathodic reactions. It is also possible to have multiple anodic reactions, but this involves different metals and an extra level of complexity as the assumption of uniform corrosion no longer applies. We will discuss multiple anodic reactions later in this chapter when we examine galvanic corrosion.
The situation with multiple cathodic reactions is shown in Figure 16.8. Here, the two cathodic reactions have been added to give a total cathodic curve. The total cathodic reaction rate from the sum of the two reactions must be equal to the anodic reaction rate. Therefore, Vcorr is defined by the point at which the anodic curve intersects the total cathodic curve. Note that the logarithm of the total cathodic current at a given potential is not just the sum of the logarithms of each of the two cathodic reactions since log(i1) + log(i2) ≠ log(i1 + i2). Also note that in the case illustrated, corrosion of copper metal by copper(II) ions, the anodic and cathodic currents intersect near the edge of the Tafel region for the anodic curve. Intersection outside of the region where the Tafel approximation is valid is possible when the overpotential for the cathodic reactions is much greater than that for the anodic reaction and is evident by a Vcorr value that is close to the equilibrium value for the anodic reaction.

Figure 16.8 Multiple cathodic reactions for the corrosion of copper metal by copper(II) ions in acid.
The procedure for calculating the corrosion potential for multiple cathodic reactions is illustrated below, and is just an extension of that used for the case of single reactions. Note that the problem is set up in terms of current since the currents must be added to give the total current.
16.4 Localized Corrosion
In the previous section, we assumed that the corrosion occurred uniformly over the entire surface and that the surface area for the anodic reaction and cathodic reactions was the same and equal to the total surface area of the sample. Localized corrosion is very different. In localized corrosion, the anode and cathode are separated, and the anode is typically smaller than the cathode. Corrosion involving small anodes is important industrially because a large cathode-to-anode ratio can lead to fast dissolution of a small area of the metal, leading to leakage or rupture. Numerous different kinds of localized corrosion have been identified, with examples shown in Figure 16.1.
Many factors influence localized corrosion, and a complete treatment of all of these is beyond the scope of this text. For example, properties of the metal such as grain and grain-boundary composition and structure, the amount and properties of alloying components, and the presence of inclusions or defects influence its corrosion behavior. The dynamics of passive film formation and breakdown are also important in determining the initiation and stability of corrosion. Our objective in this section is to analyze localized corrosion using the fundamental relationships of electrochemical engineering. Specifically, we will examine how thermodynamics, kinetics, and transport influence the rate of corrosion, and how an understanding of the electrochemical behavior can lead to the development of engineering strategies to mitigate corrosion.
Let's use the corrosion pit illustrated in Figure 16.9 to elucidate some of the characteristics of localized corrosion. The anodic reaction takes place on the inside of the pit where the metal is dissolving. The environment inside the pit is different from that external to the cavity; this local environment prevents the pit surface from passivating and is essential for the pit to remain active. The area outside of the pit is protected by a passive layer. The cathodic reaction takes place primarily outside of the pit and typically involves a larger area as mentioned above.
Figure 16.9 Schematic diagram of corrosion pit. Current flows from the inside of the pit to the outside, driven by a potential difference in solution. The potential is greater in the pit than outside the pit.
In contrast to uniform corrosion, the anode and cathode are separate areas of the same metal. However, the overall current must still balance (the magnitude of the anodic current integrated over the surface must be equal to that of the cathodic current also integrated over the entire surface). If this is not the case, the system will adjust itself until charge is conserved and the current is balanced. This adjustment is rapid relative to the timescales associated with either the development of concentration gradients inside the pit or the growth (change in size) of the pit. In order for the corrosion process to proceed, there must be current flow between the anode and the cathode. Using our normal convention, current flows from the anode to the cathode in solution, and electrons flow from the anode to the cathode in the metal. Because the resistance of the solution is typically much higher than that of the metal, the potential loss due to current flow in the metal can be neglected and the metal is essentially at a constant potential.
You can prove the validity of assuming a constant metal potential to yourself by calculating the current density that would be required to produce an appreciable voltage drop in a metal. The potential drop in solution is an important aspect of localized corrosion; this is a voltage loss that was not present in uniform corrosion where the anodic and cathodic reactions occur simultaneously on the same surface. The current in solution is driven by a potential drop from the anode to the cathode. Therefore, the potential of the solution inside the pit is higher than that of the surrounding cathodic area. Most of the potential drop in solution occurs in and near the pit where current densities are highest. In conjunction with Figure 16.9, let's consider the following questions:
Is the potential measured inside the pit with a very small reference electrode greater or less than that which would be measured with the same reference electrode outside of the pit? The measured potential is
. Since
is the same at both locations and
, the measured potential inside the pit is less than that outside of the pit.
Doesn't the potential inside the pit favor the cathodic reaction? Why then does the cathodic reaction occur mostly outside of the pit? The potential inside the pit actually does favor the cathodic reaction relative to the potential outside of the pit. There are several reasons why the cathodic reaction occurs mostly outside of the pit. First, the cavity itself provides additional transport resistance, which can prevent cathodic reactants such as oxygen from reaching the surface. Also, the environment inside of the pit will influence the equilibrium potential, which may offset the effect of the potential difference. Perhaps most important, the kinetics of possible cathodic reactions are typically much slower than those of the anodic reaction inside the pit. Therefore, the large cathodic area available outside of the pit is needed to provide sufficient cathodic current.
What keeps a corrosion pit active? The driving force for pitting corrosion is the difference in the equilibrium potentials of the anodic and cathodic reactions. In environments where active dissolution of the metal is not favored, for example, due to stable passive layers, the local environment inside the pit is also critical for active dissolution since it is that local environment that prevents the re-passivation that would otherwise occur.
The local composition difference between the inside and outside of a corrosion pit is characteristic of localized corrosion where geometry typically facilitates its development. As mentioned above, this composition difference is critical to maintaining the stability of localized corrosion. In particular, oxygen depletion in restricted areas can promote corrosion because the surface is not passivated. For example, stainless steels, which rely on oxygen to maintain passivity, behave very differently in aerated and oxygen-free environments. Intuitively, you might expect that corrosion would be worse in oxygen compared to air. For pitting corrosion, the higher partial pressure of oxygen makes it more difficult for a break in the passivation layer to occur. As a result, pitting corrosion is worse in air. In addition, concentration differences contribute to the transfer of current from the anode to the cathode. Avoidance of geometries that significantly restrict transport and facilitate localized corrosion is important from a mitigation standpoint.
Galvanic Corrosion
Galvanic corrosion is a form of localized corrosion that can occur when two different metals are in contact and exposed to a common electrolyte. It is included under localized corrosion because the metals corrode at different rates and corrosion is favored near the location where the metals are in contact. Because of the high electrical conductivity of the metals, the two metals are at the same potential. Consider zinc and iron in electrical contact and exposed to the same electrolyte solution. The potential of the two metals equalizes by moving some of the higher energy electrons in the zinc to the iron. This situation is equivalent to applying a negative potential to the iron (a potential below its equilibrium potential) and a positive potential to the zinc (a potential higher than its equilibrium potential), resulting in an increase in the dissolution rate of zinc and a decrease in that of iron.
The rates of cathodic reactions also influence the final potential of the metals undergoing galvanic corrosion. The cathodic reaction(s) can occur on the surfaces of both metals, and the relative rate of reduction on the different metal surfaces will depend on effects of kinetics and mass transfer. As for the metal potential in our example, it will remain below the equilibrium potential of iron as long as the dissolution rate of zinc is sufficiently rapid to match the cathodic reaction rate. Where high rates of cathodic reaction are possible, both metals will corrode, but at different rates. Because the net current on the active metal is typically anodic, and the net current on the less active metal is cathodic, there must be current flow from one metal to the other and in solution between the two metals. The potential drop associated with current flow in the metals themselves is tiny because of high conductivity of the metal. In contrast, the potential drop in solution is significant and plays an important role in determining the local reaction rates of both the anodic and cathodic reactions, which will not be uniform. The direction of current flow in solution is from the zinc to the iron; hence, the potential of the solution is higher at the zinc electrode. As described previously for pitting corrosion, this means that the potential measured against a reference electrode will be lower at the zinc electrode than at the iron electrode.
To illustrate, we consider the situation where flat pieces of zinc and iron are in contact and exposed to a salt solution. Figure 16.10 shows a two-dimensional, semi-infinite representation: the zinc is 1 cm wide and the iron is 4 cm wide. To the right of the iron is an insulator. The left boundary can be thought of as an insulator or an axis of symmetry. As a first approximation, we neglect concentration effects and solve for the secondary current distribution; that is, Laplace's equation for the potential in solution is solved. This calculation requires expressions for the current density as a function of potential for the dissolution of iron and zinc, as well as kinetic expressions for hydrogen evolution and oxygen reduction on each of the two metal surfaces. Tafel expressions suffice since we are well away from the equilibrium potentials for the reactions of interest except for iron. The reverse reaction or iron is not significant because of the negligible concentration of iron ions in solution. Since mass transfer in solution is not modeled explicitly, the rate expression(s) for oxygen reduction should include mass-transfer effects as oxygen is undoubtedly mass-transfer limited. Following our convention, the potential of the metal is ϕ1, and the potential of the solution is ϕ2. The metal potential is arbitrarily set to zero and the derivative of the solution potential is prescribed on the boundaries.

Figure 16.10 Potential field for galvanic coupling of Zn and Fe. Source: Data adapted from Abootalebi 2010.
On the Fe electrode:

Similarly, at the Zn electrode:
The current, and therefore derivative of potential, is assumed to be zero at all other boundaries. The position of the outside boundaries is not critical as long as they are sufficiently far from the surface that they do not significantly distort the potential field. Solution of Laplace's equation with these boundary conditions yields the potential field shown in Figure 16.10. The closer the spacing of the contour lines are, the steeper the gradients in potential and the higher the current density. Note that the current density is highest at the intersection of the two metals. Figure 16.11 shows the average rates of dissolution of the zinc and iron before and after galvanic coupling of the two metals. These results show clearly that the dissolution rate of zinc increased significantly due to coupling with iron, while that of the iron dropped to essentially zero. The impact of lower solution conductivity (0.02 S·m−1 rather than 0.2 S·m−1) is also shown, where the increased resistance of the solution resulted in a significantly lower average current. The local current densities along both the zinc and iron electrodes are shown in Figure 16.12 for both values of the solution conductivity. The net current density on the zinc electrode is anodic, and that on the iron electrode is cathodic, and the current flow in solution is from the zinc electrode to the iron electrode. In both cases, the current is highest as the intersection of the metals is approached. In the case of the lower conductivity, the current distribution is more nonuniform and the average dissolution rate is lower. Importantly, the local dissolution rate of zinc at the junction of the two metals is actually higher; therefore, the lower average current density may actually be more problematic due to the high local dissolution rate of zinc.

Figure 16.11 Average dissolution rates: (1) without galvanic coupling, (2) coupled with a solution conductivity of 0.2 S·m−1, and (3) coupled with a solution conductivity of 0.02 S·m−1.

Figure 16.12 Local current density for galvanically coupled Zn and Fe at solution conductivities of 0.2 and 0.02 S·m−1.
You, as a student, should be able to qualitatively rationalize each of the results from this simulation. Illustration 16.5 is designed to help you do this.
16.5 Corrosion Protection
The topic of corrosion protection and mitigation is broad and includes many different approaches to a multitude of corrosion-related problems. For example, subtopics include materials design and selection, component design for corrosion avoidance, use of inhibitors to reduce corrosion rates, and a wide variety of surface treatments and coatings. Clearly, comprehensive treatment of this topic is beyond the scope of this book.
Electrochemical methods for addressing corrosion are more consistent with the objectives of the text and include the following: cathodic protection, anodic protection, and e-coating. The most important of these is cathodic protection, which is used extensively for protection of structures from corrosion. Electrophoretic coating or E-coating is widely used by the automotive industry and others for coating parts in order to provide, among other things, corrosion protection. In E-coating, it is the coating process itself that is electrochemical in nature. This important industrial process will not be treated in this chapter. Here, we provide a brief description of anodic protection and then spend the balance of the section on the fundamentals of cathodic protection.
Anodic Protection
Anodic protection is illustrated in Figure 16.13 and is applicable to metals that have an active to passive transition (Figure 16.3), such as iron, nickel, chromium, titanium, and their alloys. Simply stated, the strategy involves increasing the potential in the anodic direction in order to move the metal of interest from an active (a) to a passive state (b). This shift can be accomplished with use of a potentiostat to set the potential of the metal to a value in the passive region. For the example shown in the figure, the anodic corrosion current is reduced by almost two orders of magnitude by increasing the potential above the corrosion potential as shown. At the same time, the cathodic current is reduced even more. The potentiostat provides current to make up the difference between the current from the small cathodic reaction at the applied potential, ic, and that required to balance the passive current of the metal, ia, so that the magnitude of total cathodic current is equal to that of the anodic current. This applied current is much less than that required for cathodic protection where the potential is moved in the negative direction in order to protect the metal, and a relatively large external anodic current is required to balance the high cathodic current at the new potential. The lower required current and corresponding reduced operating costs represent the principal advantage of anodic protection. However, such protection requires a higher initial capital investment because the instrumentation needed to set the potential is more expensive than that required to apply a current for cathodic protection. As with galvanic corrosion, there is current flow between the anode and the cathode. The change in potential due to this current flow is not included in Figure 16.13. Still, the diagram represents the situation fairly accurately since the current density in the passive region is low; therefore, ohmic losses are not significant.

Figure 16.13 Illustration of using anodic protection to reduce the rate of corrosion for metals that passivate.
Another way to implement anodic protection is by changing the cathodic reaction so that the cathodic curve intersects the anodic curve in the passive region, rather than in the active region. This method is not always possible, but could avoid the need for the potentiostat. Let's take a minute to think about this curve and how it might be altered. The most common cathodic reaction is the reduction of oxygen. Given the sluggishness of the oxygen reduction reaction, Tafel kinetics apply. As seen in Figure 16.13, when the potential is plotted against the logarithm of cathodic current density, a straight line results.
Changing the exchange-current density for oxygen reduction is one way to shift the cathodic curve. Often, the exchange-current density is proportional to the concentration of oxygen; and therefore varying the amount of oxygen in the system shifts the cathodic curve. At first, this action seems counterintuitive. However, it is analogous to the example above where a current was applied to raise the potential in the anodic direction. In this instance, the oxygen concentration is raised to increase the cathodic current and to ensure that the metal is passivated. The approach is depicted in Figure 16.14. The cathodic curve labeled (a) is the original state, with a high corrosion current. The cathodic curve is raised by increasing the oxygen concentration (b), moving the potential into the passive region with a much lower corrosion current. Some care is needed when taking this approach—We could make the problem worse. Reflect that the rate of reduction of oxygen is often mass-transfer limited rather than controlled by kinetics. Given the low solubility of oxygen in water, this circumstance doesn't come as a surprise. The result is that the current associated with the cathodic curve will not increase indefinitely. The effect of mass transfer is shown with curve (c). Note that because of the limiting current, it is possible to be in a condition of high anodic (corrosion) current. Not only is it important to shift the curve up, but the mass-transfer limit must also be large enough to ensure that the metal remains passivated. It may be necessary to increase the mass-transfer limiting current as well as shown in curve (d). This increase could be accomplished by raising the flow rate or agitation of the fluid. A similar shift can be made by coupling the metal to be protected with metals that facilitate the cathodic reaction without adding a significant anodic component.
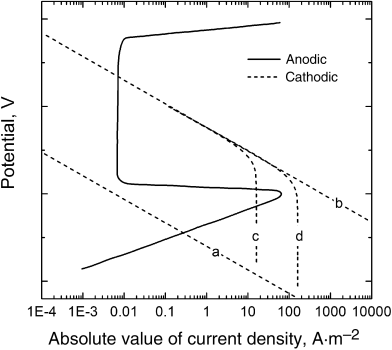
Figure 16.14 Importance of mass transfer on passivating the metal.
Anodic protection can be very effective in reducing corrosion in systems where it can be applied. It is particularly effective in aggressive environments where cathodic protection would require very large currents and would lead to breakdown of the solvent (i.e., water) to form hydrogen gas. However, relative to cathodic protection, which can be applied to nearly all metals, anodic protection is used much less commonly.
Cathodic Protection
Cathodic protection is used routinely to protect sea vessels, oil platforms, and other ocean structures, buried pipelines, and storage tanks. The concept is straightforward—lower the potential of the metal you are trying to protect in order to reduce or eliminate corrosion. Cathodic protection takes its name from the fact that the potential of the protected metal is moved in the cathodic direction in order to decrease its dissolution rate. Ideally, we would like to reduce the potential enough to put us into the immunity area of the Pourbaix diagram (see Figure 16.2). In order to reduce costs, we may settle for just lowering the corrosion rate rather than eliminating it completely.
Cathodic protection is implemented in one of two ways: (i) use of a sacrificial anode or (ii) use of an external power supply to apply a cathodic current to the metal to be protected. Both of these methods have associated operational expenses either to replace sacrificial anodes that have been consumed or to provide the electricity and hardware needed to apply the cathodic current.
Before describing these two strategies, we briefly discuss the relationship between cathodic protection and cathodic current. Figure 16.15 is an Evans diagram that shows the anodic and cathodic curves for a metal that undergoes corrosion. Without protection, the system is characterized by the corrosion potential and corrosion current as shown. With cathodic protection, we reduce the potential of the metal below the corrosion potential, which lowers (V1) or eliminates (V2) dissolution of the metal, depending on whether the cathodic potential is above or below the equilibrium potential for the metal, U. However, what happens to the cathodic reaction as we reduce the potential? As shown in the diagram, the rate of cathodic reaction goes up with decreasing potential. Also, secondary cathodic reactions may become important. For example, hydrogen evolution may have been insignificant at the corrosion potential, but may become important as the potential is lowered. Note that hydrogen evolution may contribute to hydrogen embrittlement on some metals such as high-strength steels.

Figure 16.15 Evans diagram showing corrosion potential and the reduction of corrosion current with a reduction in potential.
Even though it is the potential that we are trying to drop, cathodic protection is often discussed in terms of the magnitude of the applied cathodic current, iapp. In essence, we need to provide sufficient current to drive the cathodic reactions at the desired protection potential. If this is not done, the potential will be higher and the metal will not be protected. Description of cathodic protection in terms of current rather than potential is not problematic since the two are related. Note that in contrast to anodic protection, the applied current can be large. Therefore, electrode spacing, electrical conductivity, transport conditions, and geometry may be important in relating current and potential. Hence, the relationship between the cathodic current and the potential of the metal varies from system to system and, where possible, direct measurement of the potential is used to verify the extent of protection.
Sacrificial Anodes
Use of a sacrificial anode is implemented by coupling the metal to be protected with a more active metal; that is, one with a lower equilibrium potential. It is an intentional application of galvanic corrosion where the active (sacrificial) metal is permitted to corrode in order to reduce the potential of the metal to be protected. Thus, all of the physics discussed above with respect to galvanic corrosion apply to sacrificial anodes. In particular, sacrificial anodes must be electrically connected to the metal they are protecting. The sacrificial anodes dissolve preferentially, and the cathodic reaction takes place primarily on the metal that is being protected. Therefore, there are separate anodic and cathodic regions, with current flowing between them.
Since the resistance to current flow in the metal is typically much smaller than the solution resistance, the effective area protected by a sacrificial anode is a function of the electrical conductivity of the electrolyte solution. A higher conductivity means lower losses in solution and greater protection. In contrast, a lower conductivity translates into a reduced area of protection and requires multiple sacrificial anodes on a single structure to be placed more closely together. The current distribution around a sacrificial anode is not uniform as we saw above for the coupling of zinc with iron. Therefore, it is possible to have on the same structure areas that are overprotected and areas that are underprotected. Typical metals used for sacrificial anodes include zinc, aluminum, and magnesium. These metals are frequently alloyed with other minor components to give the desired dissolution properties. Figure 16.16 illustrates the use of sacrificial anodes seen as light-colored blocks on the hull and rudder of the ship.

Figure 16.16 Use of sacrificial anodes to protect against ship corrosion.
Design of a cathodic protection system that incorporates sacrificial anodes involves choosing the type, number, size, and spacing of the anodes. This process is frequently approached empirically. First, the current density needed to protect the metal of interest is chosen based on experience for the intended environmental conditions, and the total current required is determined by multiplying the protection current density by the total area of the metal to be protected. Next, the required anode surface area can be determined from knowledge of the dissolution rate of sacrificial anodes in the target environment. The final size and number of anodes reflect a balance between having a sufficient number of electrodes to provide adequate protection over the whole surface and the practical issues associated with installing and periodically replacing a large number of electrodes. Additional anodes can often be added to provide protection in areas when the initial system design was inadequate. Mathematical models and even physical models can be helpful in optimizing large, complex systems. This is particularly true for systems where the conductivity of the electrolyte is low and current densities are highly nonuniform.
Impressed Current Cathodic Protection (ICCP)
Cathodic protection can also be implemented with use of an external electrode and a DC power supply as illustrated in Figure 16.17, where the external electrode is the anode and the structure to be protected is the cathode. The power supply drives the current necessary to protect the cathode. In situations where the anode is attached directly to the structure being protected (e.g., a ship), it is critical that it be electrically insulated. The desired reaction at the anode is oxygen evolution. In practice, voltages of 100 V and high current densities are possible. Operational costs can be substantial since continuous current flow is required to maintain protection.
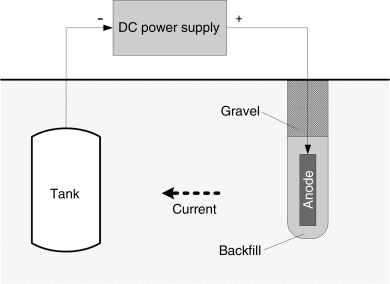
Figure 16.17 Impressed-current cathodic protection used to reduce corrosion of an underground tank.
Several different types of anode materials are available, including consumable anodes (e.g., scrap iron), semiconsumable anodes (graphite or high-silicon iron), or inert electrodes (e.g., lead alloys, platinized metals, or mixed metal oxide electrodes). Consumable electrodes, where the anodic reaction leads to dissolution of the electrode, are less expensive, but require regular replacement and typically cannot sustain high current densities. Inert electrodes offer the advantage of higher currents and longer lifetimes, but at a higher capital cost. Mixed metal oxide electrodes, based on technology borrowed from the chlor-alkali industry, operate at high current densities, are available in a variety of shapes and sizes, and cost less than platinized anodes, making them a popular electrode choice. The use of lead alloys (e.g., lead–silver) as a lower cost “inert” electrode has diminished due to concerns with the use of lead and improvements in alternative electrodes. Table 16.1 shows the characteristics of several anode materials for seawater applications.
Table 16.1 Characteristics of ICCP Anodes for Seawater Applications
| Material | Current density range (A·m−2) | Consumption rate kg·A−1·yr−1 |
| Scrap steel | <1 | 9 |
| Silicon iron | 10–30 | 0.2–0.5 |
| Graphite | 10–20 | 0.3–0.5 |
| Lead silver | 200–300 | 0.1 |
| Platinized anodes | 250–2000 | 10−5 |
| Mixed metal oxide | 250–600 | 0.5–4 × 10⁻⁶ |
Oxygen evolution is the most common anodic reaction at inert electrodes:
Chlorine may be produced at anodes in saline solution, presenting a potential problem in confined areas:
The design of an ICCP system involves choosing the number and location of external anodes. The data in Table 16.1 can be used to provide an initial estimate of the anode surface area required as illustrated below.
Because the current density at the anode is so much larger than that at the cathode (structure to be protected), most of the potential drop in the system occurs near the small anode. The potential drop near the anode decreases with distance away from the anode as 1/rn, where r is a characteristic radius of anode and n is generally between 1 (cylindrical decay) and 2 (spherical decay), depending on the geometry of the system. Therefore, almost the entire potential drop occurs within 10–15 radii of the anode, which has important implications for anode placement. First, the current distribution at the cathode will be very nonuniform if the anode is closer than ∼10 radii to the structure. Second, once the distance between the anode and cathode is at least 10–15 radii, further movement away from the cathode will not substantially increase the overall potential drop and power requirements of the system. However, placement of the anode further away can improve the level of protection by making the cathodic current density more uniform over the surface of the structure. There are practical factors, independent of the distribution of current, that limit the placement of anodes. Design of ICCP systems has traditionally been done empirically. However, mathematical models can be of great help in exploring options and overall system optimization and have found increased use in recent years.
Each of the two primary methods of cathodic protection has advantages and disadvantages. The following are the advantages of sacrificial anode systems:
- Installation is simple.
- Do not require a power supply.
- Overprotection is easy to avoid.
- Less prone to cause interaction with neighboring structures.
- Moderately easy to obtain a uniform potential across the structure.
The most severe limitation associated with sacrificial anodes is the small potential driving force available, which limits use of this strategy to conductive environments or well-coated systems. The need to replace a large number of anodes on a regular cycle is also a disadvantage.
The following are the advantages of an ICCP system:
- A large driving force to protect even large, uncoated structures in high resistivity environments.
- Comparatively few anodes are needed.
- A controllable system that can be adjusted to accommodate changes.
Disadvantages include the need for a large, specialized power supply, considerable variation of the potential over the surface, the possibility of considerable overprotection, the possibility of reversing electrical connections and the resulting enhancement of corrosion, and the significant costs associated with operation.
Cathodic protection can be used effectively in conjunction with coated surfaces to prevent localized corrosion at defects in the coating. The presence of a coating greatly reduces the current required to protect the target structure since the coating inhibits both cathodic and anodic reactions at the surface. However, cathodic reaction at defects can increase the pH locally and damage susceptible coatings. In addition, hydrogen evolution due, for example, to overprotection can lead to hydrogen embrittlement in high-strength steels and can contribute to local damage of the coating.
Stray currents from CP systems can actually enhance corrosion as illustrated in Figure 16.18. As shown in the figure, ICCP is used to protect the hull of the ship. Normally, the current moves through the seawater from the anode to the cathode. However, when docked at the pier, it may be easier for the current to move a shorter distance to the metal structure, enter the metal via a cathodic reaction, be conducted through the pier, and then re-enter the seawater via a local anodic reaction. It is the local anodic reaction that is problematic as this is a corrosion reaction that causes dissolution of the pier. Thus, the ICCP system protects the steel hull, but enhances corrosion in the unprotected pier. This, of course, is undesirable and problematic, and the impact of stray currents must be considered when designing cathodic protection systems. Difficulties are even more problematic for resistive environments, such an unprotected pipeline near the tank in Figure 16.17. Stray currents are most often associated with ICCP systems where electrode separation is typically greater and voltages are higher.

Figure 16.18 Stray currents lead to increased corrosion of pier.
Closure
Corrosion of metals and its prevention are important topics for electrochemical engineers. Corrosion is largely an electrochemical phenomenon and critical aspects of corrosion are described well with the fundamentals of thermodynamics, electrode kinetics, and transport. This chapter is focused on those aspects. The Pourbaix diagram is a useful starting point for analysis of corrosion. The practicing engineer should understand the regions of immunity, passivity, and corrosion for their application. The Evans diagram clearly shows the balance of anodic and cathodic reactions for uniform corrosion so that the corrosion potential and corrosion current can be identified. Anodic and cathodic protection schemes are available to reduce the rate of corrosion to tolerable levels. The level of corrosion that is acceptable is ultimately an economic question.
Further Reading
- Fontana, M.G. and Green, N.D. (1978) Corrosion Engineering, McGraw-Hill Book Company, New York.
- Kelly, R.G., Scully, J.R., Shoesmith, D.W., and Bucchheit, R.G. (2002) Electrochemical Techniques in Corrosion Science and Engineering, Marcel Dekker, New York.
- McCafferty, E. (2010) Introduction to Corrosion Science, Springer, New York.
- Roberge, P.R. (2008) Corrosion Engineering: Principle and Practice, McGraw-Hill.
- Winston Revie, R. ed. (2011) Uhlig's Corrosion Handbook, John Wiley & Sons, Inc., Hoboken, NJ.
Problems
16.1. Please address the following qualitative questions:
- What is corrosion and why does it occur?
- What is the driving force for corrosion?
- How would you expect temperature to affect the rate of corrosion for a structure in the ocean? Describe in detail the aspects of corrosion that would be affected by temperature and how temperature might affect those aspects.
16.2. An aqueous solution at pH = 5 contains 0.1 M ferric ion. From a thermodynamic perspective, is there a driving force for corrosion if this solution flows through nickel tubing? Support your answer quantitatively. Would you expect corrosion to occur?
16.3. Magnesium is being used as a structural material in cars, for example, because it is light and has good structural properties. However, there is concern regarding corrosion. Is that concern warranted? Please support your response quantitatively.
16.4. Using Gibbs energy values, determine the standard potential for the reaction represented by line 10 of Figure 16.2. Derive an expression for the equilibrium potential of the reaction represented by line 10 in Figure 16.2 as a function of pH. What assumption was made to get the values shown in the figure? What impact would a change in this assumption have on the equilibrium potential?
16.5. Using the Pourbaix diagram for nickel (Figure 16.2), is the corrosion of nickel in aqueous solutions more likely to be problematic in highly acidic or highly basic solutions? Please justify your response. You should consider the stability of water.
16.6. There is a large driving force for the corrosion of zinc in deaerated aqueous solution, where the primary cathodic reaction would be hydrogen evolution. However, zinc is stable in such environments. The following kinetic parameters apply: for the zinc reaction, αa = 1.5 and i0 = 0.10 A·cm−2; for hydrogen evolution, αc = 0.5 and i0 = 10−9 A·cm−2. Assume Tafel kinetics, and calculate the following:
- The corrosion potential
- The corrosion current for zinc
-
The corrosion rate of zinc in mm·yr−1Why is the corrosion rate of zinc so low?
16.7. The following data are available for the corrosion of iron in acid solution where oxygen does not make a significant contribution to its rate of dissolution. The following parameters apply: bFe = 118 mV, bhydrogen = 120 mV, i0,Fe = 0.002 A·m−2, and i0,hydrogen = 0.10 A·m−2. Use 0.0 and −0.44 V for the equilibrium potentials for the hydrogen and iron reactions, respectively.
- Calculate the corrosion potential and current
- Calculate the dissolution rate in mm·yr−1
- Calculate the iron current, hydrogen current, and total current as a function of potential, and plot all three values on the same diagram.
16.8. The following data describe the corrosion of iron in seawater, where both oxygen and hydrogen contribute to the cathodic reaction. Assume Tafel kinetics for both the iron dissolution reaction and the hydrogen evolution reaction (HER). The expression for oxygen reaction includes an approximation of the mass-transfer limitations.
| Reaction | U [V] | io [A·m−2] | Expression | |
| −0.44 | αa = 0.5 | 0.014 |  | |
| −0.42 | αc = 0.5 | 1 × 10⁻⁶ |  | |
| 0.815 | αc = 1 | 1 × 10⁻¹⁶ |  |
Please determine:
- The corrosion potential and corrosion current.
- The relative importance of the oxygen reaction (fraction of cathodic current from oxygen reduction).
- Plot the individual currents and the total current as a function of potential on the same diagram.
16.9. Find the corrosion potential and corrosion potential for lead in neutral solution. Under the conditions oxygen does not make a significant contribution to its rate of dissolution. The following parameters apply: bPb = 60 mV, bH2 = 240 mV, i0,Pb = 1 A·m−2, and i0,H2 = 1 × 10⁻⁶ A·m−2. Use −0.41 and −0.126 V for the equilibrium potentials for the hydrogen and iron reactions, respectively.
16.10. In solutions where a passivation layer is not formed on zinc, the corrosion potential is found to be very close to the equilibrium potential for zinc. What can you infer about the kinetics for the anodic (dissolution of zinc) compared to the kinetics for the cathodic (hydrogen evolution or oxygen reduction) reactions?
16.11. What is the corrosion potential, corrosion current density, and corrosion rate (mm·yr−1) of a copper pipe in laminar cross flow? The velocity of the fluid over the 3 cm diameter pipe is 2 m·s−1. The solution is at pH = 8 and is saturated with oxygen (10 g·m−3). The following reactions and parameters apply,
Your friend Eugene Engineer claims that H2 evolution should also be considered in the calculation. Do you agree? Justify your response quantitatively.
16.12. The following composite corrosion polarization curve is measured for Fe in deaerated acid solution by changing the current and measuring the corresponding potential. From the semi-log plot, please determine the following:

- The corrosion potential relative to SHE
- The corrosion current
- The Tafel slope of the anodic reaction
- The Tafel slope of the cathodic reaction
Make sure to state any assumptions that you make.
16.13. In Illustration 16.4, the dissolution of copper by copper(II) ions in acid chloride solution was explored. That example considered two cathodic reactions. It turns out that there are at least four possible cathodic reactions that involve additional species formed as a result of homogeneous reaction. The additional reactions are as follows:
Accounting for two additional equilibrium reactions, the concentrations are as follows:
| 1.23 M | 0.067 M | 0.1897 M | 0.02 M | 0.1517 M | 0.071 M | 0.0071 M |
The kinetic expressions for the two additional reactions are as follows:
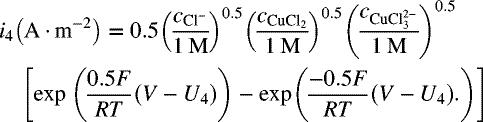
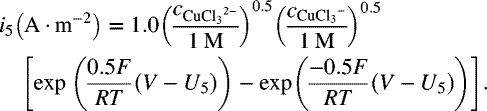
- Plot the Evans diagram similar to the one in the illustration, but with all four cathodic reactions and a line for the total cathodic reaction. Use this plot to estimate (rough only) the corrosion potential of the system.
- Calculate the corrosion potential and the corrosion current density for the completed set of five reactions, one anodic reaction and four cathodic reactions using the full BV expressions.
- Repeat part (b) using Tafel expressions rather than the full BV expressions. Please comment on any differences between the two results. Is this what you expected? Why or why not?
16.14. A simplified cell, which results in a uniform current density during corrosion of the full surfaces, can be used to examine galvanic corrosion. If the two metals are not connected, each metal corrodes independent of the other. However, if a highly conductive wire is used to connect the two metals, they become galvanically coupled and their corrosion rates change dramatically. Examine corrosion of iron and zinc using the parameters from Figure 16.10.
- The conductivity of the solution is constant and equal to 0.08 S·m−1. The electrodes are infinite plates separated by a distance of 3 cm.
Please calculate the following:
- The uncoupled corrosion potential (SHE) and corrosion current density (A·m−2) for each of the two metals.
- The rate of corrosion for the coupled system.
You will need to account for the ohmic losses in solution, which will allow you to relate the potential of the solution at one electrode to that at the other. The sum of the cathodic and anodic currents on the two electrodes together must equal zero. Report the potential of each electrode versus a Ag/AgCl reference electrode located at the electrode surface. Also report the specific anodic and cathodic currents for each electrode.
16.15. Describe the difference between immunity and passivity. Explain the relationship between these conditions and anodic and cathodic protection strategies for corrosion mitigation.
16.16. Where does the cathodic reaction occur during pitting corrosion? Why does it occur there? What implications does this have for the growth of multiple corrosion pits on a surface?
16.17. Why does galvanic coupling increase the corrosion rate of the more active metal?
16.18. The corrosion rate of magnesium increases dramatically when it is coupled with iron, even if the area of the iron is just a fraction of that of the magnesium. Please explain why this might be so.
16.19. Explain why cathodic current is required in order to cathodically protect metal structures.
16.20. Does a sacrificial anode represent anodic protection or cathodic protection? Please explain.
16.21. You have been assigned to develop a system to protect a stationary sea oil drilling platform located in 400 m deep water. Based on your understanding of sacrificial anodes:
- What costs are associated with (i) installation of a sacrificial anode system, and (ii) operation of a sacrificial anodic protection system?
- Repeat part (a) for ICCP systems.
- Based on your answers to (a) and (b), which strategy do you expect to be more expensive? Which would be easier to implement?
16.22. You desire to use ICCP to protect a low-carbon steel surface from corrosion (area = 20 m2). Assuming a uniform current density on the steel surface, the pH of the solution is 8. For all potentials of interest, the reduction of oxygen is diffusion limited, ilim = 0.2 A·m−2 For iron dissolution αa = 0.5, i0,Fe = 0.002 A·m−2, UFe = −0.64 V, and for hydrogen αc = 0.5, and i0,H2 = 0.05 A·m−2.
- What value of the impressed current would be required to reduce the corrosion rate to 0.1 mm·yr−1? The kinetics are known and given below.
- What is the corresponding potential of the electrode (versus SCE)?
- Often −850 mV versus SCE is specified as the potential required for protection of steel in seawater. Please comment on this value based on your results.
16.23. ICCP is to be used to protect a steel dock structure in seawater. The surface area of the structure is 15 m2. The anodes available are platinized Ti with an OD of 2.5 cm and a length of 1 m. Specific kinetic data and conductivity data for your system are not available.
- Please recommend an appropriate anode configuration.
- If electricity is $0.05/kWh, how much would it cost to operate this system for a year (assume continuous operation for the entire year and no losses in rectifying the electricity)? Assume a potential drop of 20 V.
- What factors might influence your placement of the ICCP anodes?
16.24. Data are shown for the passivation of iron in a phosphate solution at a pH = 9.7. (Adapted from Corrosion Science, 19, 297 (1979). The solution is deaerated, hydrogen evolution is cathodic reaction. It is desired to protect 1 m2 of iron to a corrosion rate of 1 mm·yr−1. Compare the current required for anodic versus cathodic protection.
