
Chapter 6. Additional Management Services
In this chapter, you will learn the following:
• Reporting and monitoring of ESAs with SNMP
• Managing files on the ESA with FTP and SCP
• Understanding ESA logging
The Need for Additional Protocol Support
We’ve seen that the primary administrative interfaces to the Email Security Appliance (ESA) are the web user interface (WUI) and the command-line interface (CLI). These are perfect for human administrators, because they provide an easy to use and complete interface to all aspects of management and reporting. For automated systems, they’re not always ideal, and integration with third-party products requires other options. Other peripheral protocols are available on the ESA for monitoring the systems, reporting on data, and manipulating configuration and data files.
This chapter starts with using Simple Network Management Protocol (SNMP) to integrate the ESA into external network management tools and what you should monitor on production ESAs. For configuring and managing the system, using File Transfer Protocol (FTP) or secure copy (SCP) to transfer files to and from the ESA is critical, so we look at the ESA filesystem.
Logging is critical to all aspects of product operation and troubleshooting, and an email administrator must be able to read and understand the logs that the ESA can record. The IronPort Text Mail logs are especially critical in this regard, so this chapter covers that format in depth.
Simple Network Management Protocol (SNMP)
SNMP is a widespread industry-standard protocol for monitoring and managing network devices. The protocol specifies how a managed network device exposes data in variables and defines the way that these variables are organized and queried. The variables exposed by a device are defined, along with metadata, in a hierarchy called a Management Information Base (MIB). Network Management Software (NMS) on a separate server is used to query a managed device, like an ESA. SNMP also supports notifications called traps from managed device to an NMS.
An SNMP MIB is a tree structure, and the custom MIB for the ESA has its root nodes in the RFC defined SNMPv2-SMI MIB. This tree structure somewhat resembles Domain Name System (DNS) and, like DNS, the root-level portions are Internet standards, but with leaf nodes controlled by the organization. Also like DNS, the data is entirely numerical, but with a name-to-number mapping mechanism.
Cisco publishes MIBs for all ESA platforms in two parts. The filenames as supplied by Cisco are IRONPORT-SMI.txt and ASYNCOS-MAIL-MIB.txt. The IRONPORT-SMI.txt file defines the top-level enterprise specific identifiers. ASYNCOS-MAIL-MIB.txt defines the specific variables and traps for the ESA.
SNMP MIBs have different revision numbers, and the ESA MIB has changed over time as SNMP capabilities expanded. You can always download the latest SNMP MIBs from the Cisco IronPort support website or from the ESA appliance filesystem in the /configuration directory.
The ESA’s SNMP attributes are read-only; there is no support for changing configuration values via SNMP.
Enabling SNMP
SNMP is disabled on the ESA by default and must be enabled and set up in the CLI using the snmpconfig command. If SNMP hasn’t been configured, the only option available will be SETUP.
The setup on the ESA side is straightforward. You must choose a local IP interface to service requests, a v3 passphrase, a trap target and community string, and then decide which traps should be enabled. You must also decide whether to support SNMP v1/v2c requests, and the answer to that depends on compatibility with your NMS and some important topics in SNMP security.
You should also accurately enter the system location and contact information. You may know what this system is and where it’s installed, but entering this correctly allows others in your organization to contact the right folks when their NMS starts generating alerts because of your ESA.
SNMP Security
SNMP as a protocol is somewhat notorious for its security problems. Older versions don’t encrypt credentials and, in fact, often don’t require credentials at all. For that reason, I recommend using SNMPv3 only, which support cryptographic security and authentication.
Because so many NMS support SNMPv2c, support is provided in the ESA for that version. In an attempt to improve security, you must define the subnets that will be allowed to access the ESA SNMP daemon and which ESA IP the daemon will listen on. You should make this as restrictive as possible.
SNMPv3 requires that you enter a passphrase that any SNMP management system must use to read the ESA variables.
Enterprise MIBs
For your NMS to recognize the variables and traps that the ESA supports through SNMP, you must define them by importing the Cisco IronPort ESA MIB definition files. The MIB defines the variables and values, and provides human-readable descriptions for them; the NMS uses this hierarchy to monitor and display the values. These files are supplied as plain text and are available on the ESA filesystem or by download from Cisco IronPort support. There are two files. The first, IRONPORT-SMI.txt, defines the top-level enterprise and appliance object identifiers (OID). The second, ASYNCOS-MAIL-MIB.txt, defines all the variables for the ESA. As of this writing, the ESA still uses the IronPort enterprise identifier and not the Cisco identifier, and the MIBs are not published as part of any Cisco MIB package.
The MIB definition files are intended for human readability, too, and can be viewed in any text editor. The MIB provides a name-to-number mapping so that your NMS can display the relevant variable and trap names. The ESA MIB uses the enterprise identifier of 15497 under the global SNMPv2-SMI.enterprises root. Beneath that root, all the available objects and traps fall into the hierarchy. For example, the OID
1.3.6.1.4.1.15497.1.1.1.5.0
represents the object from the ASYNCOS-MAIL-MIB for queueAvailabilityStatus, an indicator of whether the ESA’s mail queues are full. It has possible values of queueSpaceAvailable(1), queueSpaceShortage(2), or queueFull(3). This OID can be broken down into its components, as shown in Figure 6-1.
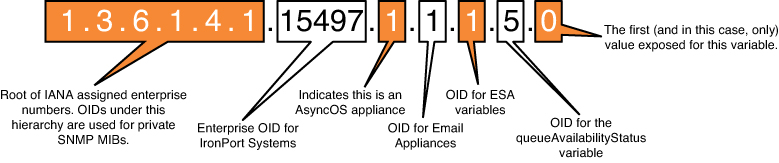
Figure 6-1. Breakdown of Enterprise OID for Queue Availability Status
Other objects, like powerSupplyTable, have a deeper hierarchy, which enumerates the table that defines all the power supplies and each of their possible states. The good news is that modern NMS hide this complexity, exposing easily readable variables like percentMemoryUtilization with a description of Percent Memory Utilization and a value range of 0 to 100.
Other MIBs
In addition to the enterprise-specific MIB for the ESA, the ESA supports many other MIBs, defined in other RFCs, such as 1213, 1907, and 4293. Although the ESA supports these standard MIBs, Cisco does not supply a MIB definition file for it. Your NMS should already have the definitions for these MIBs, but you can also download the MIBs from many Internet sources. These other MIBs define only variables and no traps.
If you use your NMS to poll the SNMP daemon on the ESA, you should see a series of variables rooted at the OID of:
1.3.6.1.2.1
If your NMS recognizes the name mappings for these OIDs, you may see variables such as:
SNMPv2-MIB::sysDescr.0
RFC1213-MIB::ipRouteDest.0.0.0.0
IF-MIB::ifNumber.0
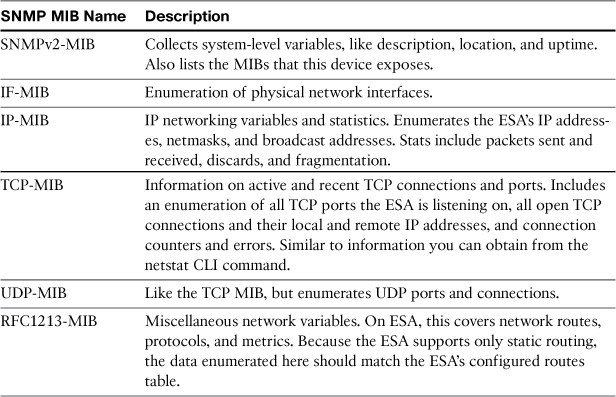
The collected set of variables here cover system information, physical interfaces, and attributes and counters for IP, UDP, TCP, and SNMP. Table 6-1 provides a brief description of the top-level variable groups.
Table 6-1. SNMP MIB-II Variable Groups Supported by ESA
Monitoring Recommendations
Monitoring the health of the ESAs in your environment is a critical part of maintaining reliable email delivery. Some of the traps should be acted on immediately in all cases; others need to be investigated if they occur repeatedly in a short time or periodically over a longer time. Most of the variables require that you establish a baseline value range and act when the value of that variable exceeds the baseline dramatically.
The most important items to monitor are the traps. SNMP traps include information that is available in the email alerts, but in a situation where email alerts are undeliverable, the SNMP traps provide an alternate path of notification. The available traps should be acted on:
• keyExpiration: Key expiration notices for any active feature should be investigated. A key expiration means that a security scanning engine, or even email receiving, will be halted.
• RAIDStatusChange, fanFailure, highTemperature, powerSupplyStatusChange: These four traps indicate a hardware problem and should be investigated immediately. The RAID and power supply traps may not indicate an immediate problem, but should be examined to determine what the current hardware state is. In the event of hardware failure, you need to contact Cisco TAC for replacement.
• resourceConservationMode: Resource Conservation is a state the ESA enters when it is running low on main memory. The most common cause of high memory usage is large amounts of undelivered mail queued on the system. Resource conservation is serious—by default, this state is only reached at 75% of memory utilization, when an ESA typically has millions of undelivered messages. It warrants an immediate investigation as to why messages aren’t being delivered. The variables resourceConservationReason and memoryAvailabilityStatus are related.
• connectivityFailure and updateFailure: connectivityFailure indicates that a test that the ESA uses to connect to an Internet URL (downloads.ironport.com as of this writing) has failed. This could mean that the ESA will be unable to download new security rule updates and that causes the ESA to issue the updateFailure trap.
Aside from the traps, these variables should be an important part of your monitoring strategy:
• queueAvailabilityStatus: A value in this variable other than queueSpaceAvailable could potentially be a problem. The ESA mail queues are very large, and a status that indicates a space shortage or a queue full state means your ESA likely has millions of messages stored on it, undelivered.
• PerCentQueueUtilization: Related to queue availability, this variable tells you exactly what percentage of queue disk space is used. In normal conditions, this should be a small percentage (under 10% in most cases).
• powerSupplyRedundancy: There are several SNMP variables related to the electrical power supplies in the appliance chassis and their status, but this one is most critical. It indicates simply whether the appliance has power redundancy or not. On the 2U ESA models, each of the two power supplies can power the entire appliance, but when one is out, you have a single point of failure.
• WorkQueueMessages: The number of messages in the queue waiting to be processed by the security or content filtering engines. Although it’s normal during daily operation to have some messages in the work queue, having a consistent non-zero value indicates that the ESA is overburdened. You shouldn’t worry much about this unless it’s over a few hundred messages, and even then, it should only cause concern if it stays high.
• raidTable: The RAID table is a list of RAID entries that describe the physical disks in the ESA and their status. These variables provide you with the condition of the redundant storage, either hardware RAID (in the 2U enterprise appliances) or software RAID (in the 1U appliances). Any status other than driveHealthy (1) should be investigated. You’ll receive email alerts and a trap from the ESA should any drive’s condition change, but it’s also wise to monitor the current status.
For an NMS that maintains long-term records of variable values, it makes sense to include all the ESA variables, for long-term trending purposes. For example, mailTransferThreads records the number of active SMTP threads on the system. There’s no particular value that would necessarily indicate a problem, but both short-term and long-term trends can help you understand the load on the appliances. Likewise, an individual reading from pendingDNSRequests will not be terribly revealing, but the long-term ups and downs can be.
PerCentCPUUtilization, perCentMemoryUtilization, and perCentDiskIOUtilization also fall into this recommendation: Monitor these to establish baselines, and then alert on sustained values 50% higher than baseline average. However, because these are percentages expressed as integers from 0–100, any consistent reading above 90 should be of concern. Memory utilization is straightforward in this concern: High usage indicates high load and undeliverable messages.
CPU and Disk I/O readings are not as straightforward. First, the CPU value is calculated as a composite of the various processes across all available CPU cores to estimate a total CPU usage percentage. This works reasonably well on a fully burdened ESA running many different security services that use all the available CPU cores. On systems with less running, the extra cores won’t ever be used but will be reported as idle.
Disk I/O is calculated as ratio of current IOPS (operations per second) to the maximum IOPS, but the maximum is determined by a “high water mark” experienced by the ESA rather than a fixed maximum. For instance, if the ESA has seen 400 IOPS at peak traffic, and current load is 300 IOPS, this gauge will show 75% even though the appliance might in the future see 1000 IOPS. Over time, the maximum high water mark will attain something like the real hardware maximum, so this gauge becomes more useful over time.
For the Internet standard MIBs that the ESA supports, like IP-MIB and TCP-MIB, there’s not a compelling reason to monitor the exposed variables. These are provided for consistency with other TCP/IP network devices and for base compatibility with NMS. If your organization typically monitors server and appliance TCP/IP networking stats via NMS, the ESA will fit right in.
Working with the ESA Filesystem
The ESA naturally has hard drives and a disk filesystem for storing data like email queues. In the appliance form factor, however, access to that filesystem is limited to a specific directory and its subdirectories. That access is provided for transferring configuration and diagnostic files to and from the system and for storing log files. What is available of the ESA filesystem can be accessed through FTP or SCP, although you can only browse the directory structure with FTP.
A typical ESA top-level folder list looks something like Example 6-1.
Example 6-1. ESA Top-Level FTP Listing
drwxrwx--- 5 root config 3584 Oct 26 08:22 configuration
drwxrwx--- 2 root log 512 Oct 20 10:19 authentication
drwxrwx--- 2 root log 512 Oct 26 08:22 system_logs
drwxrwx--- 2 root log 512 Oct 31 03:39 cli_logs
drwxrwx--- 2 root log 512 Oct 26 08:22 ftpd_logs
drwxrwx--- 2 root log 512 Oct 26 08:22 sntpd_logs
drwxrwx--- 2 root log 512 Oct 26 08:22 trackerd_logs
drwxrwx--- 2 root log 1688576 Nov 1 11:57 slbl_db
drwxrwx--- 2 root log 512 Oct 26 08:22 updater_logs
drwxrwx--- 2 root log 512 Nov 1 00:33 reportd_logs
drwxrwx--- 2 root log 512 Oct 26 08:22 gui_logs
drwxrwx--- 2 root log 512 Oct 26 08:23 reportqueryd_logs
drwxrwx--- 2 root log 512 Oct 26 08:22 euq_logs
drwxrwx--- 2 root log 512 Oct 26 08:22 euqgui_logs
drwxrwx--- 2 root log 1024 Oct 30 13:22 mail_logs
drwxrwx--- 2 root log 512 Oct 26 08:23 status
drwxrwx--- 2 root log 512 Aug 14 2009 asarchive
drwxrwx--- 2 root log 512 Oct 26 08:23 bounces
drwxrwx--- 2 root log 512 Oct 26 08:23 error_logs
drwxrwx--- 2 root log 1024 Oct 26 08:23 avarchive
drwxrwx--- 2 root log 1024 Oct 26 08:23 scanning
drwxrwx--- 2 root log 512 Oct 26 08:23 antispam
drwxrwx--- 2 root log 512 Oct 29 10:56 antivirus
drwxrwx--- 2 root log 512 Nov 1 03:57 encryption
drwxr-xr-x 6 root log 512 Aug 14 2009 periodic_reports
drwxrwx--- 2 root log 512 Nov 1 09:44 mbox drwxrwx--- 3 root
log 512 Aug 14 2009 export
drwxrwx--- 2 root log 512 Oct 26 08:22 snmp_logs
drwxrwx--- 2 root log 512 Oct 26 08:23 ldap
drwxr-xr-x 3 root log 512 Aug 14 2009 reporting
drwxrwx--- 2 root log 512 Oct 2 2009 diagnostic
drwxrwx--- 2 root log 512 May 3 2010 slbld_logs
drwxrwx--- 2 root log 512 May 3 2010 slbl_isq_db
drwxrwx--- 2 root log 512 Oct 26 08:22 authlogs
drwxrwx--- 2 root log 512 Nov 1 08:17 ConfigHistory
drwxrwx--- 2 root log 512 Oct 13 15:03 injection
Almost every folder in this list is for logging, which is discussed in the next section. A folder is created for every log subscription, and each log subscription has one or more files for the actual log. A typical FTP listing of a log directory looks like this:
-rw-rw---- 2 root log 4956202 Nov 1 12:11 mail.current
-rw-rw---- 2 root log 4956202 Nov 1 12:11 [email protected]
-rw-rw---- 1 root log 10481862 Oct 18 02:55 [email protected]
-rw-rw---- 1 root log 8853447 Oct 26 08:16 [email protected]
-rw-rw---- 1 root log 10480348 Oct 30 13:22 [email protected]
The .s file extension indicates a stored log file, .c indicates the current open log file, and .current is an alias for the current open log file. You can download and even delete the .s extension files at any time, but be aware that the .c and .current files are open and their contents will change over time. If you delete the currently open log, you won’t be able to use tail or grep in the CLI until the log is recreated with an automatic or manual rollover. In other words, don’t delete the .c or .current files.
The other folders are used to store data that needs to be transferred to and from the system:
• configuration: Contains all configuration file and table exports, and it’s the location where you need to place files for import. When the ESA, WUI, or CLI refers to a filename to import or export, it is expected to be in this directory.
• captures: Packet capture files from the WUI or tcpdump utility available in the CLI diagnostic command are stored here. There will be one capture file, with extension .cap, for each capture session you record.
• reporting: Data for the reporting system that is being transferred from the ESA to an SMA for centralized reporting. Only used if you have an SMA that is configured to pull data from this ESA.
• export: Data for message tracking that is being transferred from ESA to SMA for centralized tracking. Only used if you have an SMA that is configured to pull data from this ESA.
• slbl_db: Storage for the spam quarantine’s Safelist/Blocklist feature. Typically used only on the SMA. If you’re using this feature on ESA, it’s better to do backup and restore through the WUI Configuration File page on the System Administration menu.
• diagnostic: Storage for some types of diagnostic data that is gathered by tools from the diagnostic CLI command. These tools can affect mail operations, so you normally won’t run them without direction from Cisco support.
Transferring files from the ESA works like it does with any other file server. To transfer data from the ESA to a local workstation using FTP, use the commands GET or MGET in a command-line FTP client, or drag and drop files in a GUI FTP client. For SCP, you need to know the path of the folder where you’re transferring data to or from. The exposed ESA filesystem starts at root, indicated by /, so a transfer from the configuration folder can be done with this scp command:
scp [email protected]:/configuration/hat.txt /usr/data/hat.txt
Transferring log files is similar—you must know the folder name, which matches the log subscription name:
scp [email protected]:/mail_logs/*.s .
Many GUI SCP clients, like winscp, won’t work with the ESA filesystem, because they depend on an SSH shell being available on the remote filesystem, and ESA does not expose the filesystem via the SSH CLI. Some GUI clients that claim to support scp in reality only support SFTP, which the ESA does not provide.
ESA Logging
The ESA has extensive logging capabilities. Logs are organized into log subscriptions, which encapsulate both the type of information logged (the log type), the level of detail, and the storage and rollover settings. It’s possible to have multiple log subscriptions of the same type, recording different levels of detail, or having one subscription store logs locally and another transfer to a remote system.
The ESA ships by default with 20 to 23 active log subscriptions, depending on which features are enabled by the System Setup Wizard.
ESA Subsystem Logs
All the various subsystems of the ESA have their own log, akin to a UNIX-style daemon log. These are chiefly for troubleshooting and debugging. You would normally have no reason to transfer or permanently store these logs, or even to look at them day to day. If a component is failing, though, these logs provide valuable troubleshooting information.
Table 6-2 lists the subsystem logs.
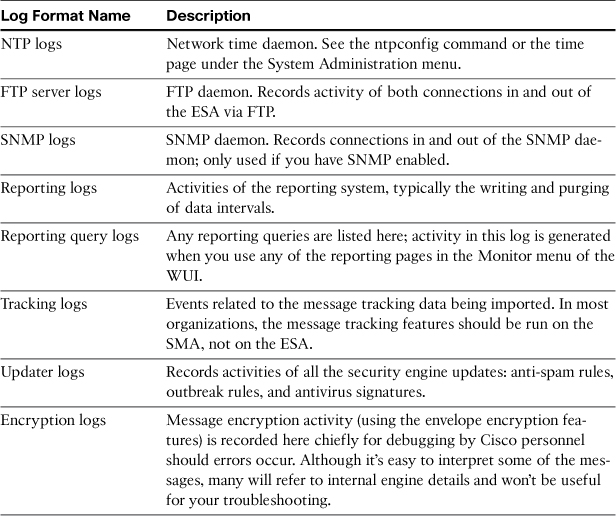
The updater logs warrant further attention as they record all the rule updates for the security engines and the engines themselves. Context-Adaptive Scanning Engine (CASE) is the name for the underlying scanning software for IPAS and Outbreak Filters, so you’ll see a lot of messages referring to CASE actions. If you’re using VOF or OF, you’ll also see a long list of current outbreak rules and their plain-text descriptions. If any updates fail, you’ll see exactly which engine and component caused the failure.
Administrative and Auditing Logs
Components of the appliance software that deal with administrative interfaces like CLI and WUI have their own logs. These logs typically record who’s logged in and what actions they’ve taken in the CLI or WUI.
The important available administrative logs are listed in Table 6-3.
Table 6-3. Administrative Log Types
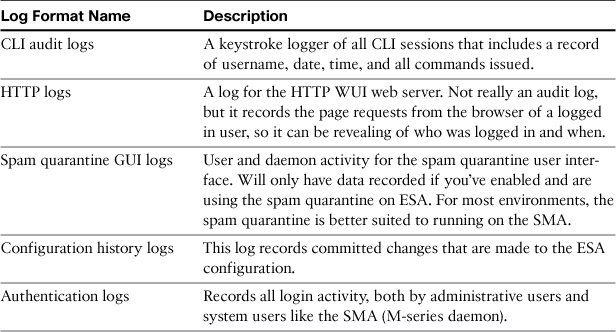
From this list, it’s worth discussing the configuration history logs, which are new in AsyncOS 7.5, but not enabled by default. When enabled, this log subscription records a copy of the XML configuration file for the appliance whenever you commit a configuration change. The ESA also attempts to describe the changes that were made during this commit. Of course, it can’t read your mind, but it can indicate which sections of the configuration were changed. It also records the commit comment (which you always enter accurately, every time, correct?), the current time, and the user doing the commit. Subsequent commits record new configuration XML concatenated until the log file reaches its rollover point.
Unlike most other log types, you cannot search or display the configuration history log. You must transfer it to a local workstation to read the configuration data. By opening the log and copying a complete XML configuration section, you can restore the ESA to an earlier configuration state.
Email Activity Logs
The IronPort Text Mail logs format is the primary log for all email activity. Every event that occurs in the processing of SMTP connections and messages is recorded here. In addition to the main email logs, many other log types record email activity (see Table 6-4).
Table 6-4. Email Activity Logs
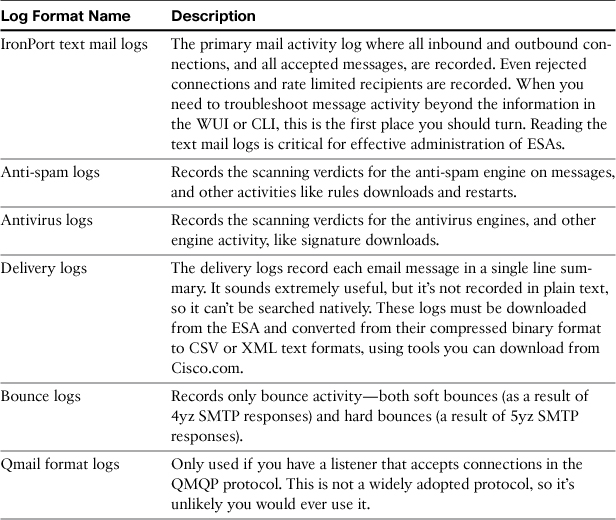
Not all these logs are stored in plain text, but the ones that are can be searched or displayed in the CLI using grep, findevent, or tail commands.
Because the text mail logs are such an important troubleshooting tool, we examine them in a later section.
Debugging Logs
Numerous logs are dedicated to troubleshooting configuration or message traffic. These aren’t solely intended for Cisco; these are intended as customer tools to investigate and resolve mail traffic, delivery, or directory-lookup problems. The list is shown in Table 6-5.
Table 6-5. Debugging Log Types
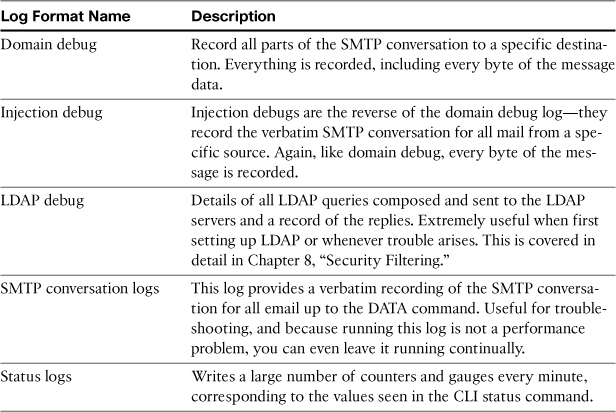
The ones that warrant real attention in the list are the injection debug and delivery debug logs. Both provide the same information: verbatim record of the entirety of an SMTP conversation. Injection debug records messages on inbound connections, where ESA is the server. You must specify the remote sending IP addresses that you want to record. Domain debug records the details of outbound connections, where ESA is the client. You must specify the destination domains to record.
Both record a limited number of sessions, for good reason. This detail recording can cause performance problems by keeping the CPU and disk very busy, so the ESA only records for a limited number of connections, based on source or destination, and only records a small number of sessions.
Even with a small number of sessions, the injection debug and domain debug logs are extremely revealing for certain email troubleshooting tasks. Whenever I’m dealing with a problem with delivery to a specific destination or accepting messages from a specific source, and the mail logs don’t reveal enough information, these logs are the first tool I turn to. They’re also extremely useful for investigating issues with message or MIME attachment corruption. If you suspect the ESA is corrupting a message, these debug logs are the right place to turn, because they allow you to compare what’s being accepted with what’s being delivered.
Another situation that warrants these debug logs—both types—is when you want to see the results of message modification on the ESA itself. For example, when you’re using the ESA disclaimer feature to add a header or a footer to a message, and something doesn’t look right, you can investigate the before and after with a combination of these two logs.
Here’s the steps to take to set up a before-and-after debug session:
1. Create an injection debug log to record the incoming message. Specify the source IP where you’ll be injecting the message and set the log to record a few sessions. I used 10.60.10.0/24, which includes a lab server capable of telnet to the ESA.
2. Create a domain debug log for the destination domain. In this case, I used cisco.com as the destination domain.
3. Commit the changes: These logs don’t record data until you commit.
After both logs are running, send a test message that matches your criteria, and then look at the logs. You can transfer the logs files from the ESA and open them in a text editor, but I just used the CLI tail command to view them directly.
Here is the relevant injection debug output, as the message is received:
Tue Sep 27 17:05:20 2011 Info: 1026671 Rcvd from '10.60.10.134': 'Message-ID:
<[email protected]>
Date: Tue, 27 Sep 2011 17:05:19 -0400
nFrom: Chris Porter <[email protected]>
User-Agent: Mozilla/5.0
(Macintosh; Intel Mac OS X 10.6; rv:6.0.2) Gecko/20110902 Thunderbird/6.0.2
nMIME-Version: 1.0
To: Chris Porter <[email protected]>
Subject:
testing
Content-Type: text/plain; charset=ISO-8859-1; format=flowed
Con-
tent-Transfer-Encoding: 7bit
Sending a test message...
chris
r
'
Here is the relevant domain debug output, as the message is delivered:
Tue Sep 27 17:05:21 2011 Info: 172412 Sent: 'from mailhost.chrisporter.com(HELO
[10.60.10.134]) ([10.60.10.134])
by mail.chrisporter.com with ESMTP/TLS/DHE-
RSA-CAMELLIA256-SHA; 27 Sep 2011 17:05:20 -0400
Message-ID: <4E823A8F.1010405@
chrisporter.com>
Date: Tue, 27 Sep 2011 17:05:19 -0400
From: Chris Porter
<[email protected]>
User-Agent: Mozilla/5.0 (Macintosh; Intel Mac OS
X 10.6; rv:6.0.2) Gecko/20110902 Thunderbird/6.0.2
MIME-Version: 1.0
To:
Chris Porter <[email protected]>
Subject: testing
Content-Type: text/
plain; charset="iso-8859-1"; format="flowed"
Content-Transfer-Encoding:
quoted-printable
Sending a test message...
chris
--
This
message was sent via Cisco IronPort ESA
'
In this case, the relevant difference is the addition of the text at the bottom of the message. You can see that the message body content delivered by the ESA is identical to that received, plus the addition of the footer.
You’ll have a challenge with this approach in a groupware environment, such as Exchange or Notes; there are too many messages coming from a single server to get lucky to catch your test message before the log exceeds the session count. In those cases, I resort to manual telnet or a mail user agent (MUA), like Mozilla Thunderbird, that can send directly to an SMTP server.
Archive Logs
Archive logs really aren’t logs at all, in the sense that they don’t record system or mail activity. These log types record entire messages, including all headers and attachments. It’s a verbatim byte copy of the messages on the ESA. However, these archive files share their storage, transfer, and rollover characteristics with logs, so we discuss them here.
The ESA archive logs are recorded in plain text in a format customarily called mbox or mailbox format, after the typical personal mailbox format on many UNIX operating systems. This format can be parsed by many different text console and GUI MUAs, or even a plain-text editor. Mozilla Thunderbird is a free MUA that can handle these files. The archive is essentially just a plain-text concatenation of the RFC 2822 Internet Message format, with a delimiter at the beginning of each message consisting of the word From followed by a space.
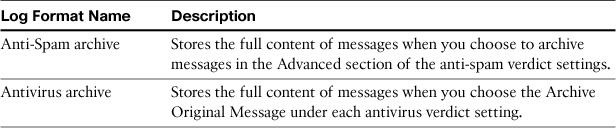
An archive log subscription is created for the anti-spam and antivirus engines by default on a new ESA. The description and use of these archives is detailed in Table 6-6.
Table 6-6. Standard ESA Archive Types
In addition, whenever you use the message filter action archive, a new log subscription is created to store messages, using the name passed into the archive action. For example, the content filter
archive_to_cisco:
if (rcpt-to == "@cisco\.com$") {
archive ("cisco");
}
creates a log subscription called “cisco” written to a directory on the ESA of /cisco, and which uses a base filename of cisco.mbox. The ESA will create the log directory and files as soon as you commit the new filter. You can transfer, grep search, or tail this log data as you would any other log type.
Archive log subscriptions created by the archive filter action can be viewed and transferred as other log types are, but you can’t manage them the same way. If you look, you’ll find that these log subscriptions are not available in the WUI log subscriptions page or via the logconfig CLI command.
In fact, they’re managed through the filters CLI command in the subcommand logconfig. You have all the same options that you would have for other log subscriptions, except that syslog is not available for any archive log type.
Archives are most useful for troubleshooting message receipt or delivery issues or to see the raw message data. You can use these archive files to restore or redeliver messages, but there’s no automatic way to do so. To restore an archived message, you need to download the relevant archive log file and use a text editor or MUA to extract the message of interest, and a MUA to redeliver the message. For this reason, and because of the limited storage available on the ESA, this feature is not a general-purpose message-archiving solution. It is a fantastic troubleshooting tool, however, and if you encounter a reproducible message issue, create a filter and record an archive copy.
Creating a Log Subscription
Creating a log subscription is simple. You can create a subscription in the WUI in the Log Subscriptions page of the System Administration menu.
You can delete a log subscription from the same WUI page. Deleting a subscription stops the log from being recorded, effective as soon as the change is committed, but it does not delete pre-existing log files.
To create a log subscription, at a minimum, you need only specify two things: the type of log (chosen from the drop-down box) and a subscription name that must be unique for that host. The subscription name is used to name the folder where logs are stored. The rest of the options are set by default and are suitable for most cases where the logs are to remain on the ESA; I discuss automatic log transfers later in this chapter.
Like any other configuration change, you must commit that change for it to be effective. Log folders and files will be created after the change is committed.
Logging Recommendations
Logging is another case where the default settings are ideal for most organizations. There are logs created for the various subsystems to aid in troubleshooting, and the default detail level is suitable for day to day operations.
Even if you plan to transfer logs from the ESA to another server for archiving, it’s always a good idea to have copies of logs stored locally on the ESA. For that reason, when you need to set up a log transfer, I recommend creating a new log subscription with the remote transfer settings rather than modifying the existing one. For example, if you want to use syslog to transfer the text mail logs, create a new log subscription named mail_syslog with type IronPort Text Mail Logs and the appropriate syslog settings. I discuss transferring logs in the next section.
In any environment with more than one ESA, you may run into a naming problem if you plan to transfer logs to a centralized server. By default, the ESA log filenames for a given log type are the same—so that two separate ESAs will both use the filename prefix mail.text. for log files. At worst, this can result in a filename collision if the log rollovers on two ESAs happen in the same second, but that’s fairly unlikely. Even so, the similarity in filenames makes things confusing when dealing with large numbers of files.
The solution is simple: Choose a subscription name and a filename that reflects the ESA hostname. For example, if I create mail log subscriptions named esa01mail and esa02mail with filenames to match, the resulting logs have the format esa01mail.text.<timestamp>.s, which allows you to easily distinguish the hosts.
Performance of logging may be a concern in some conditions. In general, logging only creates performance problems when using the specific debug logs, or setting one of the standard log types to Debug or Trace log level. The LDAP debug, injection debug, and domain debug logs all cause additional CPU and disk I/O to record. For this reason, injection and domain debug logs only run for a limited number of sessions. LDAP debug logs run continuously, and so should only be used during troubleshooting or on lightly loaded ESAs. Likewise, setting the IronPort text mail logs to debug or trace level causes much more data to be written, so they should only be enabled during troubleshooting.
Don’t set your log subscription file sizes too small. Ten MB is the default and should be considered a minimum file size. If you set this value too small and traffic is high, many of the log types will roll over so often that it becomes a resource burden to the ESA. In a busy environment, 1 MB of mail-log data can be written in a few seconds. Setting this value higher, even as high as 100 MB, results in fewer rollovers, but obviously, requires transferring larger files.
Transferring Logs for Permanent Storage
The ESA ultimately has finite storage space for logs. If your organization requires retention of log data for an extended period of time, or permanent retention, you must transfer the files away from the ESA before the rollover process.
Rollover is the process of closing the current log file and starting a new one. Rollover also deletes or transfers older files. A log file is closed because it reaches its maximum file size or its maximum time period since the last rollover. Older log files are deleted when the maximum file count is reached. Both parameters are set in the log subscription that records the logs. Each subscription has a maximum log size per file and a maximum number of log files to keep. Most subscriptions, by default, use a maximum of 10 files and 100 MB per file, resulting in 1 GB of total storage at maximum. Each ESA model differs in how much log storage it offers, but it’s in the range of 30–200 GB. You can safely raise the default limits, but take care that the total size won’t encroach on the maximum size of the log partition. You can see what the current log partition availability is by using the status detail command, and you’ll receive alerts from the system if the log partition is filling up.
To transfer files from the ESA to another storage location, you can do it manually with FTP or SCP. If you want to automate the process, you can script an external system to do so, but it’s far easier to use the built-in transfer tools that the ESA provides.
HTTP to the ESA
If you’re using the ESA WUI, you can access log files directly from the Log Subscriptions page. Each log subscription has a link in the Log Files column. All log files currently stored on the ESA can be accessed here, and there is a check box next to each for deleting individual files. You don’t have to manually manage these files, though—the ESA will delete older files when the rollover and storage maximums are met.
FTP to the ESA
You can also list and retrieve log files from the ESA with FTP, provided that FTP is enabled on one of the ESA’s IP interfaces. Log in using any valid ESA user account. Note that FTP is an unencrypted protocol and all credentials and file transfers are transmitted in the clear, so I recommend only enabling FTP on internal-facing interfaces and using a firewall to control access to the port.
Any FTP client can be used. FTP and HTTP are the only access methods that allow log files to be manually deleted. Log files are normally deleted only at rollover, when the subscription file limits have been reached, or when the files are automatically transferred. SCP cannot be used to delete log files.
FTP to a Remote Server
File Transfer Protocol (FTP) is the natural choice for transferring files from the ESA to another server automatically. FTP is widely supported on a variety of operating systems (OS).
After you create the log subscription and commit the changes, the ESA begins recording the log until it reaches the maximum file size or duration and only attempts to transfer the files when the rollover conditions are met. To test log transfers, use the Rollover Now button on the Log Subscriptions page or the CLI command rollovernow. The options for FTP push are shown in Figure 6-2.
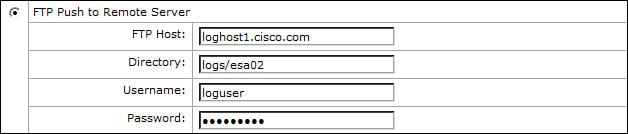
Figure 6-2. FTP Push Options for Log Subscriptions
Once created, the ESA attempts to transfer log files at each rollover event, and so the maximum files retained will only have an effect if logs cannot be transferred to the remote server. On any error in transferring files via FTP, you will receive an email alert from the ESA.
SCP to a Remote Server
You can also use secure copy (scp) to transfer log files to a remote server. Unlike FTP, this connection is encrypted using SSH between the ESA and the target remote server. For further security, you cannot use an interactive login, and the settings for SCP push do not ask for a password, as shown in Figure 6-3.
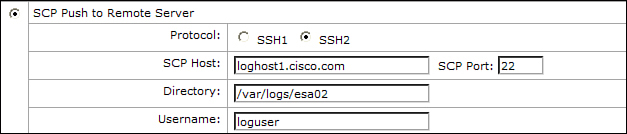
Figure 6-3. SCP Push Options: No Provision for a Password Exists
Instead, you must install the ESA’s user public key on the remote server. You can get this key (or keys; the ESA has both an RSA and a DSS key) from the CLI command logconfig → hostkeyconfig → user. You place this key in the remote server’s SSH configuration, which will depend on the particular installation. On most Linux and BSD servers, this will be in the remote user’s .ssh/authorized_keys file. In the previous SCP log push settings example, I would put the ESA keys in the file /home/loguser/.ssh/authorized_keys.
SCP push events are triggered by the rollover conditions, which is either based on size of the log file or, for some log subscriptions, a scheduled rollover.
Syslog Transfer
Syslog is a logging protocol that includes support for remote transfer of logging messages over UDP. It was specifically created for logging of the sendmail MTA package, but has now evolved into an RFC standard that documents the protocol. ESA supports syslog push over traditional UDP transport, or optionally over TCP that some syslog servers support.
Unlike FTP or SCP, syslog transfer log subscriptions don’t rollover. Instead, they transmit logging information line by line as the events occur. Because of this, and because the data isn’t compressed in transit, syslog can create a lot of network traffic in busy environments, so you should ideally have your syslog servers close to the ESAs, topology-wise, or even separated onto a separate network segment.
Syslog log subscriptions require that you select the facility to log to. The facility is simply a code that represents the type of service being logged, with mail being the obvious facility choice for ESA logging. In practice, you can use any facility that you like since it’s an arbitrary identifier. Most syslog servers write the accepted log data to separate files for each facility, so if mail is already in use, you can use any of the others.
Understanding IronPort Text Mail Logs
The ESA text mail logs are the primary mail log format for all message activity. They are critical to troubleshooting, and you need to be comfortable reading these logs and extracting useful information about message history from them.
Mail logs record events as they occur, arranged chronologically, not arranged on a per-message basis. Each event is written as one line, which includes its timestamp. This means that all the activity for a given message is spread over many lines, each potentially separated in time, and thus spread across the log file or potentially even spread across multiple files. For example, a message that is accepted by the ESA at 10:05 a.m., but not successfully delivered until 1:22 p.m., will likely have its events scattered across multiple log files.
Message Events
Because of the huge variety of events that can occur on a connection or message, there needs to be some unifying identifier so we can trace the history of a single message. You need to be familiar with four major identifiers:
1. ICID (inbound connection ID): Refers to SMTP connections made by a remote client to the ESA. ICIDs are created for all SMTP connections made where the ESA is the destination. This could be either Internet mail senders or your own internal hosts.
2. MID (message ID): The internal 32-bit number used to track events for a given message. Every accepted message is assigned a MID and all logging events relevant to that message and any recipient display the MID. MIDs do not change, although certain events like address rewrites or message modifications like footer stamping can result in a new MID being created from an old one.
3. RID (recipient ID): Every message has one or more envelope recipients, indicated by a numeric recipient ID. These IDs start from zero for the first recipient and are only locally significant to their message.
4. DCID (delivery connection ID): Refers to an SMTP connection made by the ESA to a remote SMTP server. DCIDs are created for all SMTP connections where ESA is the source. The destination can be any other server, whether locally or Internet.
The MID is distinct from the SMTP message-ID header, which is also recorded in the logs. Message-ID headers are an alphanumeric identifier for a message typically created by the sending mail client and not by the ESA. The MID is a purely numeric ID assigned by the ESA based on incrementing a 32-bit counter. Each new message gets assigned the next available number from that counter.
The relationships are typically one-to-many: One ICID can (potentially) be the source of many messages. One MID can have many RIDs. One DCID can (potentially) deliver many messages.
Every event line starts with the timestamp in local date and time, in 24-hour format, and a log level for the event: Error, Warning, Info, Debug, or Trace. Each log subscription determines which log levels are recorded, and they’re cumulative. Error level logs include only Error level log entries, while Info level (the default) includes Info, Warning, and Error log entries. For the most part, examining the mail logs means examining Info log entries that all start like this:
Fri Jun 26 03:00:41 2009 Info:
Following that prefix, the real event data starts, whether it’s a message attribute, policy decision, a scanning verdict, or a routing action. If you have ESAs across multiple time zones, each will record actions in their own local time, and you may want to pick a single time zone or use UTC to keep them consistent.
Lifecycle of a Message in the Log
All email messages on the ESA either start with an inbound connection or are created on the ESA itself. I expect that, most of the time, you’ll be interested in messages that were accepted from a remote client by the ESA, and then delivered by the ESA to a remote server. That starts with a new ICID line:
Fri Jun 26 03:00:41 2009 Info: New SMTP ICID 143 interface INBOUND (10.1.1.17)
address 68.244.174.120 reverse dns host mail1.example.com verified no
That inbound connection is either accepted or rejected. If it’s rejected, the ICID is immediately closed. That process is logged across two lines:
Fri Jun 26 03:00:41 2009 Info: ICID 142 REJECT SG BLACKLIST match sbrs[-10.0:-
2.5] SBRS -7.1
Fri Jun 26 03:00:41 2009 Info: ICID 142 close
The string REJECT SG BLACKLIST means that the connecting IP was classified in that sender group and that the connection was rejected. The connecting IP had SBRS of –7.1, which fell into the range defined for that sender group, which is listed here as –10.0:-2.5.
If the inbound connection is accepted, you’ll see the creation of a new MID as a message delivery is started. This line is a critical one: It’s the first place where the ICID and the MID are linked:
Fri Jun 26 03:00:41 2009 Info: Start MID 325651 ICID 143
The ESA then logs the sender address and all recipients. In this case, these are the envelope sender and envelope recipient addresses, not the header From and To addresses that users will see. These addresses come from the MAIL FROM and RCPT TO commands, respectively. These lines also log both the MID and ICID:
Fri Jun 26 03:00:41 2009 Info: MID 325651 ICID 918198 From: <[email protected]>
Fri Jun 26 03:00:41 2009 Info: MID 325651 ICID 918198 RID 0 To: [email protected]
Assuming that at least one recipient is valid, and no other policy prevents message acceptance, you’ll see a series of log entries for that MID, including the message size and subject. After that come the various entries for address transformations like aliasing or masquerading, which policy is applied, and the verdicts and actions of the security and content filters. At the end of the pipeline, as the message goes to delivery queues, you see this line:
Fri Jun 26 03:00:41 2009 Info: MID 325651 queued for delivery
Queued for delivery doesn’t mean the message has been delivered, only that it’s ready for delivery if a connection to the proper destination domain can be opened. Message logging for a given MID typically ends with the delivery of the message to another host via an available delivery connection (DCID). That situation is indicated by these lines:
Thu Nov 3 12:05:03 2011 Info: Delivery start DCID 179770 MID 348707 to RID [0]
Thu Nov 3 12:05:04 2011 Info: Message done DCID 179770 MID 348707 to RID [0]
Thu Nov 3 12:05:04 2011 Info: MID 348707 RID [0] Response 'ok: Message 11441796
accepted'
Thu Nov 3 12:05:04 2011 Info: Message finished MID 348707 done
Note that between the MID event queued for delivery and the DCID/MID event Delivery start, there can be a long delay in time. You won’t see any events related to a MID that’s queued for delivery until a successful SMTP connection to the destination is made. You will see the logging events for connection attempts indicated by this line:
Fri Oct 7 11:26:13 2011 Info: New SMTP DCID 174615 interface 10.60.10.10 address
66.94.237.139 port 25
As you can see, there’s no mention of a MID in this line, only the DCID. The DCID and MID do not come together until the DCID is successfully established and the message recipients are actually attempted. If the ESA cannot make a successful connection, ultimately the MID will timeout, and the last you’ll see of that MID is a line like this:
Thu Jun 30 16:51:33 2011 Info: Bounced: DCID 6914 MID 2629 to RID 0 - Bounced
by destination server with response: 5.4.7 - Delivery expired (message too old)
('000', ['timeout'])
Another possible end to a message is being dropped, which can happen for a variety of reasons, usually policy-based like anti-spam (CASE) or by a filter. A filter drop displays the name of the filter:
Fri Jun 26 03:23:28 2009 Info: Message aborted MID 72902 Dropped by filter
'banned_attachments'
An anti-spam drop action shows CASE as the reason:
Fri Jun 26 03:23:29 2009 Info: Message aborted MID 72904 Dropped by CASE
Another possible outcome is a quarantine, which actually isn’t a final state, because the message will either be deleted or released and delivered later. Quarantine events display the reason for it:
Thu Jun 18 19:31:03 2009 Info: MID 334420 quarantined to "Policy" (content
filter:quarantine_all)
Log events for a given connection or message always occur in the same order. For example, Start MID occurs before Subject and CASE spam negative events, and of course, those will all be recorded before queued for delivery.
Tracing Message History
If you want to become an expert ESA admin, familiarity with logs is critical, and one of the most common log-based tasks is tracing the history of a message. Of course, you could just use the message-tracking features that make this easy, but I assume you want to do this manually, because the skill comes in handy in many situations.
Let’s start with an example: I need to find out who sent the message with the subject Happy Birthday Chris, and I need to know who it came from, what host injected it, who it went to, and whether it was delivered. Because all we know about the message is the subject, we have to start there.
I’ll demonstrate searching just using the ESA CLI grep tool, but you can use any text editor or search tool—the process is the same. I start by searching for that subject:
grep "Happy Birthday Chris" mail_logs
In this case, I get back one result:
Fri Oct 28 11:05:01 2011 Info: MID 346564 Subject 'Happy Birthday Chris'
Now that I have the MID, I can search for that to get the other data:
grep "MID 346564" mail_logs
I’m searching for both the word MID and the numeric MID itself to avoid any search results that match other numeric values in the log. The result is everything in the log that corresponds to that MID:
Fri Oct 28 11:05:01 2011 Info: Start MID 346564 ICID 1042862
Fri Oct 28 11:05:01 2011 Info: MID 346564 ICID 1042862 From: <[email protected]>
Fri Oct 28 11:05:01 2011 Info: MID 346564 ICID 1042862 RID 0 To: <chriport@cisco.
com>
Fri Oct 28 11:05:01 2011 Info: MID 346564 Message-ID '<112067.438985349-em02@
granite>'
Fri Oct 28 11:05:01 2011 Info: MID 346564 Subject 'Happy Birthday Chris'
Fri Oct 28 11:05:02 2011 Info: MID 346564 ready 864 bytes from <[email protected]>
Fri Oct 28 11:05:02 2011 Info: MID 346564 matched all recipients for per-
recipient policy local domains in the outbound table
Fri Oct 28 11:05:03 2011 Info: MID 346564 interim AV verdict using Sophos CLEAN
Fri Oct 28 11:05:03 2011 Info: MID 346564 antivirus negative
Fri Oct 28 11:05:03 2011 Info: MID 346564 DLP no violation
Fri Oct 28 11:05:03 2011 Info: MID 346564 queued for delivery
Fri Oct 28 11:05:03 2011 Info: Delivery start DCID 178987 MID 346564 to RID [0]
Fri Oct 28 11:05:04 2011 Info: Message done DCID 178987 MID 346564 to RID [0]
Fri Oct 28 11:05:04 2011 Info: MID 346564 RID [0] Response 'ok: Message 10569973
accepted'
Fri Oct 28 11:05:04 2011 Info: Message finished MID 346564 done
This covers most of the information I need. It’s an outgoing message based on the policy selection. I can see the sender, recipient, size, security verdicts, and the final result. The response from the remote server is recorded. However, it doesn’t tell me what the injecting host was, because that’s part of the ICID, and not the MID. So, I need to perform one more search, this time for the ICID that was revealed in the last search:
grep "ICID 1042862" mail_logs
The result from that search includes the host that connected to the ESA to deliver this message:
Fri Oct 28 11:05:01 2011 Info: New SMTP ICID 1042862 interface primary
(10.60.10.10) address 10.22.18.105 reverse dns host unknown verified no
So, finally, we know that this message was injected from 10.22.18.105, a host without DNS information, and relayed outbound. It was delivered, and we even have the response from the remote MTA that accepted the message.
A shortcut version of this example uses the CLI command findevent to search for the relevant messages. findevent consolidates the search steps into a single command, asks you which log to search, and correlates MIDs and ICIDs for you. If multiple messages match, it provides a list of matching MIDs from which to select. Here’s an example of the same search using findevent interactively:
esa02.cisco.com> findevent
Please choose which type of search you want to perform:
1. Search by envelope FROM
2. Search by Message ID
3. Search by Subject
4. Search by envelope TO
[1]> 3
Enter the regular expression to search for.
[]> Happy Birthday Chris
Currently configured logs:
Log Name Log Type Retrieval Interval
--------------------------------------------------------------------------------
1. mail_logs IronPort Text Mail Logs Manual Download None
Enter the number of the log you wish to use for message tracking.
[1]> 1
Please choose which set of logs to search:
1. All available log files
2. Select log files by date list
3. Current log file
[3]> 3
The following matching message IDs were found. Please choose one to show
additional log information:
1. MID 373351 (Thu Jan 12 15:29:01 2012) Happy Birthday Chris
2. MID 373359 (Thu Jan 12 15:44:02 2012) Happy Birthday Chris
[1]> 1
Thu Jan 12 15:29:01 2012 Info: New SMTP ICID 1077703 interface primary
(10.60.10.10) address 10.60.10.20 reverse dns host unknown verified no
Thu Jan 12 15:29:01 2012 Info: ICID 1077703 RELAY SG RELAYLIST match
10.60.10.0/24 SBRS rfc1918
Thu Jan 12 15:29:01 2012 Info: Start MID 373351 ICID 1077703
Thu Jan 12 15:29:01 2012 Info: MID 373351 ICID 1077703 From: <[email protected]>
Thu Jan 12 15:29:01 2012 Info: MID 373351 ICID 1077703 RID 0 To: <[email protected]>
Thu Jan 12 15:29:01 2012 Info: MID 373351 Message-ID '<648851.85900809-em02@granite>'
Thu Jan 12 15:29:01 2012 Info: MID 373351 Subject 'Happy Birthday Chris'
Parsing Message Events
If you plan to extract any data from the logs, there are two steps: Decide what data you’re looking for and which event(s) contains that information, and then search for it and extract it. If the information you’re looking for is contained in a single line of the log, the task is straightforward, and regular expressions are an ideal way to do this.
For example, the log event that records the MID and its sender is easily matched with this regex:
Info: MID d+ ICID d+ From: .+
The log event for the creation of a new MID and its association with ICID can be matched with this regex:
Info: Start MID d+ ICID d+
Another important log event is the message size, which can be matched with this regex. In this case, I include a Perl-style regex capture so that I can use the message size and sender values later:
Info: MID (d+) ready (d+) bytes from <.+>
When you’re looking for more than one piece of data, spread across multiple log lines, you need to do some more advanced parsing to keep track of multiple lines tied together through their MID. We look at that in the next section.
A Practical Example of Log Parsing
If you want to dive into parsing logs directly, it helps to have a practical example. I’m going to turn to my tool of choice for text processing, Perl 5, to demonstrate a program that parses logs for a practical use. Suppose you have a business policy that allows email messages up to 25 MB in size, and that during some busy periods, some users are sending out a few messages that approach the maximum size. These larger messages, at peak periods, cause brief workqueue backups as the ESAs process them. Who’s sending these messages, and where are they going?
The built-in tools are of limited help. Message tracking doesn’t allow for a search by size. The system capacity reports provide information on average message size and total bytes transferred, in aggregate for all traffic on the appliance. You can certainly grep the logs for the line that indicates the message size:
Mon Aug 29 11:56:01 2011 Info: MID 320877 ready 53036 bytes from <[email protected]>
That log entry includes the sender address, but not the recipients, and if you extract all the message sizes events from the log, you still need to sort them and then look up the MIDs on the largest to get other message information. We can do better with a script that only examines messages above a given minimum size.
It would seem that such a script would have straightforward logic: Look for the bytes from lines and extract the MID. Add the MIDs that meet the minimum size threshold to a list, and then finally look for the lines for recipients (RID) and record them. Lastly, print out the list at the end. Unfortunately, if you’re parsing log lines in order, this won’t work because the message-size line is after the lines that record the sender address and the recipient addresses. They always occur in this order for a given message:
Fri Oct 28 11:05:01 2011 Info: MID 346564 ICID 1042862 From: <[email protected]>
Fri Oct 28 11:05:01 2011 Info: MID 346564 ICID 1042862 RID 0 To: <[email protected]>
Fri Oct 28 11:05:02 2011 Info: MID 346564 ready 864 bytes from <[email protected]>
To avoid double- or triple-parsing the log files, we need to record every MID in the log when we see the From: event, and then add the recipient information when we see the To: event. Finally, when we see the bytes event, we can finally decide if the MID meets our minimum size and either discard or save it. This running collection of MIDs is an approach that works for almost any program extracting data from the logs.
The script provides the list of MIDs that meet the minimum size and the sender and recipients. (The source code is shown in Example 6-2.) Like the other source code examples in this guide, I’m not assiduously checking input or properly handling errors, because to do so would make for a very long example.
Example 6-2. Source Code for bigsender.pl, a Log Parsing Script
#!/usr/bin/perl
#####################################################
#
# Perl script to examine ESA mail log MIDs and display information
# about messages larger than a specified size.
# Intended to give ESA admins information about the largest messages and
# their senders and recipients
use strict;
# global variables
my %mids = ();
my $filename;
my @filenames;
my $mid;
my $size;
my $minSize;
sub usage () {
print <<USAGE;
bigsender.pl <minimum size> <log files to parse>
example:
bigsender.pl 32K /logs/*.s
All arguments are mandatory. Size is interpreted as bytes, kilobtyes (if size is
followed by K), or megabytes (if size is followed by M)
USAGE
}
# main
if (scalar @ARGV < 2) {
usage ();
exit (1);
}
# get the arguments
$minSize = shift @ARGV;
if ($minSize =~ /[mM]$/) {
$minSize = $minSize * 1024 * 1024;
}
elsif ($minSize =~ /[kK]$/) {
$minSize = $minSize * 1024;
}
@filenames = map { glob($_) } @ARGV;
# print a header
print "MID size sender recipients
";
while ($filename = shift @filenames) {
open INPUT, $filename;
while (<INPUT>) {
if (/Info: MID (d+) ICID d+ From: (.*)$/) {
push ( @{$mids{$1}}, $2 );
}
elsif (/Info: MID (d+) ICID d+ RID d+ To: (.*)$/) {
push ( @{$mids{$1}}, $2 );
}
elsif (/Info: MID (d+) ready (d+) bytes from/) {
$mid = $1;
$size = $2;
if ($size < $minSize) {
# this message is below minimum size
delete $mids{$mid};
}
else {
# this message is above the threshold
print "$mid $size @{$mids{$mid}}
" if $mids{$mid};
delete $mids{$mid};
}
}
}
close INPUT;
}
Bigsender.pl 5M [email protected]
The output might look like this:
MID size sender recipients
72901275 6088112 <[email protected]> <[email protected]>
72901393 2817478 <[email protected]> <[email protected]>
72901553 26672132 <[email protected]> <[email protected]> <cporter@chrisporter.
com> <[email protected]>
72901586 1912897 <[email protected]> <[email protected]>
This script can be repurposed as a framework for a number of different tasks.
Using Custom Log Entries
If you plan to regularly search the logs for specific information on messages, you can use the Content Filter action Add Log Entry or the log-entry message filter action to record arbitrary data in the logs. Custom log entries can be free-form text or include filter action variables for message attributes. You can use this to record information that’s not normally in the logs, like attachment filenames, or to consolidate information that is normally recorded across multiple lines. Custom log entries can also be written based on specific conditions so that you can record interesting events for searching later. Of course, recording a custom log entry adds to log sizes, so if you’re taking that action on every message, or you’re using multiple log entries, expect that expansion in file sizes.
Let’s look again at the previous section’s log parsing example. If you expected to have to routinely look through the logs for large file senders, you can actually take a shortcut. You could add a custom log entry that records the sender, recipient, and message size all in one line, as shown in Figure 6-4. You don’t need to add the MID; every custom log entry starts with it.
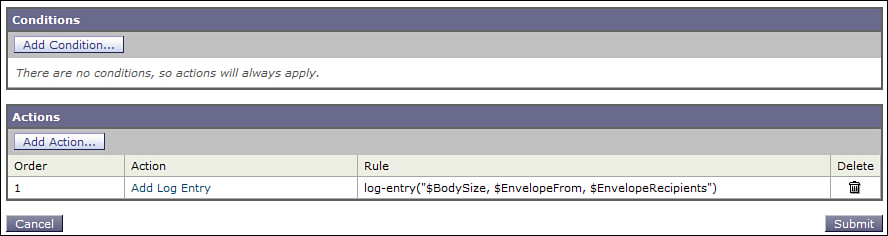
Figure 6-4. Custom Log Entry with Sender, Recipient, and Size
The output in the logs for a message looks like this:
Fri Nov 4 10:33:04 2011 Info: MID 349047 Custom Log Entry: 54495, chriport@
cisco.com, [email protected]
To avoid adding this entry for every single message, restrict it to messages above a specific threshold with a condition, as shown in Figure 6-5.
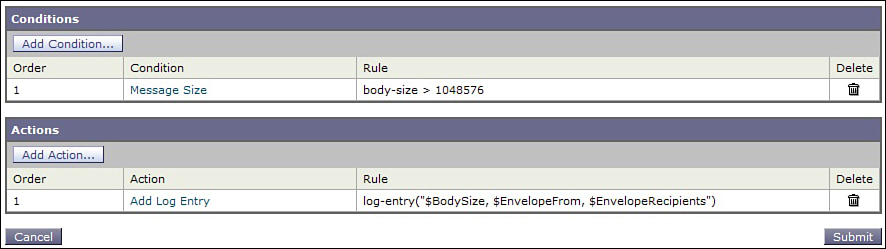
Figure 6-5. Custom Log Entry Restricted to Large Messages
Now, to reproduce the report for large senders, you only need to search for the Custom Log Entry string. The custom log entry includes the MID, which will allow you to use message tracking, grep, or findevent to display the rest of the message details.
Another example covers attachment filenames, which are not logged in the mail logs by default. You can add this by using the action variable $filenames, but there’s a catch you should be aware of. Normally on ESA, messages with attachments are not decoded from their MIME parts unless a message or content filter examines the data. This is for performance: The ESA does not incur the overhead of message body decoding unless you ask for data in the message body. As a result, attachment filenames are not available to message tracking, or the $filenames variable, unless you’re already doing message decoding. Any content filter condition that examines message body—attachment or body text rules, file type, or filename rules, and such—causes the decoding process to happen and, hence, make the filenames available. If you’re already doing this, you’re all set and there is no additional performance consideration. If you’re not already doing body searches, be aware that you won’t see the filenames unless you start doing it, and those filter conditions could impact performance.
A content filter that records attachment filenames is shown in Figure 6-6.
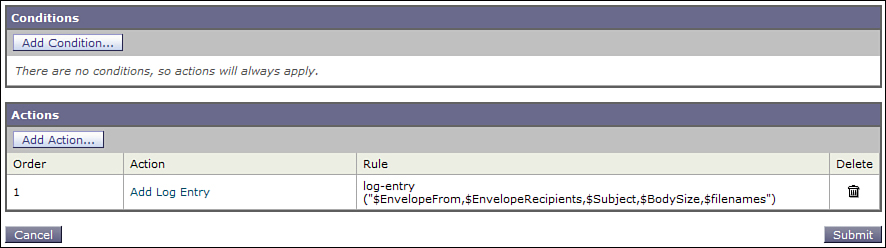
Figure 6-6. Custom Log Entry to Record Attachment Filenames
The result in the logs of this action is:
Fri Nov 4 10:33:04 2011 Info: MID 349047 Custom Log Entry: chriport@cisco.
com,[email protected],Capacity Docs,54495,CapacityPlan.xls
Summary
In this chapter, we’ve looked at several ways of peering under the hood of the ESA for detailed monitoring and troubleshooting, and how to access the ESA filesystem for transferring logs and configurations.
One of the most critical skills for troubleshooting delivery, performance, and system errors on the ESA is reading and understanding the logs. The IronPort mail logs format provides a complete history of every connection and message that your ESA handles, and the system and engine logs provide details on errors that can affect delivery or security. For monitoring the health of your ESAs, the WUI and CLI provide convenient reporting and status tools, but the best way to continually monitor appliance health is with SNMP, and we discussed setting up and monitoring your ESAs with snmpconfig.
To this point, we have focused on accessing, administering, troubleshooting, and monitoring, but in the next chapter we’ll dig deeply into mail policy, and interaction with LDAP.