Chapter 3
New Paradigms: In Search of a Third Way
Abstract
In this chapter, different types of growth are discussed, based on all economic activities in the gross national product or only by desirable activities in the measure of desirable activities. Wealth and inequality up to the present time are illustrated by a case study for Denmark, including assets such as education, health, material and economic possessions. This is followed by a critical appraisal of how goods and offered for sale, how salaried work is administered and how tolerance toward different ways of doing things is faring at present. The next section discusses constitutions, departing from a historical exposition of the major steps taken in ancient Greece, France and the USA, leading to a discussion of connecting human rights with duties, of decentralization versus globalization, and of direct versus representative democracy.
Keywords
growth
measure of desirable activity
inequality
Danish economy
education
health
selling goods
work
constitutions
globalization
direct and representative democracy
3.1. New indicators of social welfare
3.1.1. Growth, but of What?
Growth is imbedded in all human beings as a positive concept from the day we are born. Once we were all babies but wanted to grow to become children with a larger action radius. As children we wanted to grow to become adults, experience love and sex, and to form our own living quarters reflecting our personal style. It has therefore been simple for human beings to accept the worship of growth presently preached by economists and politicians. But the problem is that the term ‘growth’ is attributed different meanings in different circumstances. Some of these may conform to the childhood notion of growth being desirable, but others cover more specialized types of growth that we should not accept without critical questions. Foremost among these is the economic growth defined as growth in the very artificial quantity called the gross national product (GNP).
The GNP, as described in Section 2.3.3, has primarily appeared as a convenient indicator because it is very easy to extract from the kind of data that national statistical bureaus have specialized themselves in collecting. It measures economic activity and includes anything that involves the exchange of money. No questions are asked regarding whether the activity is useful, whether it brings benefits to society or to individuals, or whether it has negative impacts on society or environment. Given this background, it is strange that political leaders have adopted the mantra of referring to growth in GNP as the fundamental goal for their society and for their efforts in governing it, and even stranger that the voters do not question this mantra. Or perhaps it is not so surprising, considering that the political trick employed is to threaten people that without growth they shall lose their jobs and be unable to put food on the table. From this, it may be worthwhile to step a little deeper into the background behind the claimed connection between economic growth and welfare constituents such as being able to live a fulfilling life without lacking basic necessities. The further question of how economic growth might be made compatible with sustainability is occasionally discussed (e.g., Arrow et al., 2012), but really boils down to the obvious statement that growth exploiting any kind of depletable resources is necessarily unsustainable, as is growth using renewable resources above the natural upper limit of regeneration (think of wind or solar energy or biomass). Only growth in nonmaterial categories of economic activity can in principle grow unlimited, independent of whether they contribute to welfare or not.
It should immediately be noted that the politicians preaching about growth or job loss are deliberately acting contrary to the UN Human Right Charter, Article 23 (see Section 2.3.1), according to which it is their mission to ensure that citizens have jobs and get sufficient remuneration to allow a dignified and fulfilling life. This means that growth in activity is not desirable if it cannot be reconciled with arrangements where all citizens can enjoy work and leisure in a way that support the conditions for welfare. Economic growth is an acceptable goal to pursue only if it is consistent with creating conditions that maintain or improve welfare for everyone, not just for a few. The conditions for such welfare certainly include ensuring that wealth distribution is fair and disparity modest. The neo-liberal paradigm of maximizing the disparities between layers of society is not compatible with basic human rights.
As discussed in Section 2.2.1, the hope of neo-liberal advocates is that the poorer strata of society (or of nations) do not notice the increasing disparity if their own situation does not become worse, and if it does (e.g., during the recurrent financial collapses and their toll of job losses), that people should blame themselves rather than the economic system and the political leaders allowing the increases in economic disparity. Creating the notion of (nearly uninterrupted) growth is an important tool in maintaining this illusion. When the growth indicator includes both increases in the production of goods and services, growth in empty financial transactions and pollution, resource depletion and environmental degradation, then the growth will rarely halt and the population can be presented with daily news telling how well the nation is doing. The absent policy measures to ensure a fair distribution of the profits associated with the upward trend of the growth indicator can be played down, or at least so it would seem, due to the advertising campaigns and staged political discussions of petty matters in all media addressing the public, taking all the time and space available so that ‘sorry, we do not have time to discuss distribution issues, because our amateur singing/dancing shows take all our time’ or ‘sorry, we get so many letters from the readers each day that we cannot possibly publish your comment on wealth distribution’. The following sections will discuss how things might change if the GNP growth indicator were replaced with a more relevant indicator of activity.
Growth may be said to be necessary for the poorer inhabitants of the world. More precisely, development is needed and in some cases, it may involve growth in resource use and thus interfere with the ongoing resource usage of richer countries, in case limiting factors are already in sight. This raises a number of questions, including what the sustainable human population of the world is. Of course it is not a constant but depends on the technology available and the efficiency by which it is used. However, the parts of the world that already use many resources inefficiently would likely need negative growth in resource exploitation (but possibly combined with positive growth in technological skills for efficient use of resources) in order to make room for nations lacking basic ingredients of well-being. How this may be achieved is, unfortunately, not a part of the current economic paradigm. United Nation’s organizations such as the World Bank (2006) or UN (2006–2014) study group set goals for development of the poorer parts of the global economy, but rarely address the adjustments necessary in the affluent parts of the world, and seem to shy away from any discussion of population stabilization. It may happen by itself if the poor get rich, but history teaches us that this takes time and that the population levels resulting from such transitions are about an order of magnitude higher than at the starting point, which may not be acceptable in the current situation. Not long ago, a substantial interest in the relation between population size and economic growth was voiced (e.g., Nordhaus and Tobin, 1972).
In closing this section, it seems fair to quote John Galbraith in one of his more sarcastic appraisals of his own profession, ‘In economics, it is professionally better to be associated with highly respectable error than uncertainly established truth’ (Galbraith, 1976).
3.1.2. Measure of Desirable Activities
The convenience provided by the simplicity of the GNP is perhaps the reason that more meaningful indicators have not gained acceptance. Here, I shall explore an alternative that is nearly as simple to collect and work with, but which of course also can be criticised for the simplifications made. It is certainly not the first time that the suggestion of alternatives to GNP has been made. Following the oil crisis in late 1973, economists proposed valuing the exhaustion of fossil reserves, just as produced equipment is depreciated (Weltzman, 1976). Comments and an extension to a more general account of natural resources, depletable or not, were later added (e.g., Solow, 1986; Hartwick, 1990), typically using highly simplified mathematical toy models to derive obvious relations between assumptions and outcomes. In recent years, further concern has evolved around the pollution and climate change caused by the activities contributing to the GNP, and the possible aversion measures taken and also being counted by the GNP.
International organizations have stressed that both resource depletion and environmental damage should somehow be subtracted from the GNP (or, seen as more convenient by the economists mentioned earlier, from the net national product) in what is sometimes denoted a ‘green GNP’. Notably, a group of international organizations have developed a framework for environmental accounting, making it closely resemble the traditional economic accounting by representing land and other durable property through a rental value, as suggested in Section 2.1.1, but at the same time not questioning private ownership of such assets (UN, EU, FAO, IMF, OECD, WB, 2014) and tacitly assigning zero economic value to natural assets not being part of any economic activities. These limitations are the result of wishing to make the environmental–economic accounting framework as similar as possible to the framework for conventional national accounting developed earlier by essentially the same organizations (EC, IMF, OECD, UN, WB, 1993). However, the international organizations closest to actual politics have generally taken the stand that incorporating issues of environmental sustainability in the GNP would be a lot of work, because many of the necessary data are not collected (Stieglitz et al., 2009*), and therefore they instead suggest, at least for the time being, that indicators for environmental and social impacts be defined and assessed in nonmonetary units and subsequently submitted to political decision makers along with the traditional GNP (e.g., EC, 2013; OECD, 2014; a short summary can be found in Gravgård, 2013).† This would make sure that the GNP, at least for a while, can continue to be heralded as a goal in political campaigns, while the new indicators perpetually play a secondary role not associated with compulsory political action, and are mainly there just to show the voters that the issues involved have not been forgotten. The difference between activities and welfare is in any case clear from the absence of activities not paid for in the GNP (work in own household and garden, free work for charity and sports organizations, and so on). Not only does this exclude using GNP as a measure of welfare, it also prevents identification of developments changing in time, such as the transfer of care for children and the elderly from the unpaid family sphere to enterprises within the economic web. Quite generally, the activities that people consider as contributing most to welfare are rarely the activities of highest cost, as measured by GNP or any other monetary activity measure. It is therefore in any case necessary first to repair the monetary activity measure to reflect only activities desirable for society (by excluding activities such as polluting or destroying finite resources or moving funds around in circles), and then to discuss the translation of each activity into a measure of the associated welfare, if any.
In contrast to many of the earlier initiatives, which propose to treat environmental changes (in natural resources and induced from pollution) by an overall subtraction from the GNP, the consideration here will be the alternative of proceeding by an item-by-item evaluation, looking at the positive and negative impacts of each activity, not only from a life-cycle perspective but for any extent of time where impacts may happen. This idea grew out of discussions during the 1970s with Swedish aeronautical engineer Olle Ljungström, and may be called a measure of desirable activities (MDA) (Chapter 14 in Sørensen, 2014), because it divides the components of the GNP activities into three general categories: those predominantly desirable to society and its members, those more or less neutral (no benefit but likely also no harm) and finally those that are damaging to environment or society or any of its members. Each component of the GNP would be multiplied by a weight factor that is positive, zero or negative in the three cases, and finally summed up in case one wants a single number to replace the GNP, rather than a detailed account. The weighted sum would clearly be much closer to an indicator of wealth than the GNP summation with unit weight for all activities, even though the precise determination of the weight factors is of course uncertain and sometimes depending on arguments and valuations on which citizens may disagree. In its simplest form, the MDA would use a weight factor of ‘1’ for desirable activities, ‘0’ for neutral activities and ‘−1’ for damaging activities.
In practice, the weighing would be done in a slightly more complex way, because the data used for calculating a country’s GNP are available in terms of input–output matrices, telling how each category of import is distributed to manufacturers and service providers, and then how each step of industrial processing, assembly, conversion and despatch between enterprises is implying payments between companies in a matrix form. Finally, how each good or service is sold to private and public consumers, possibly enlarging the stocks of certain assets, or is exported. The negative social and environmental impacts that affect the monetary value of each transaction or activity chunk may be described as a monetary value to be subtracted from each particular activity represented by a point in the input–output matrix,
where the index ‘j’ denotes production/service sectors and the index ‘k’ denotes output sectors of private or public consumption, stock change or export. The last equality indicates the possibility of writing the impact to subtract at each input–output step as a factor multiplying the GNP contribution by the activity step in question, cjk. Some of the impacts relate more closely to the production or service-providing phase (sector ‘j’), while others relate more closely to the use and disposal phase (in sector ‘k’), allowing the impact factors to be written as
where ej and fk are weight factors applying to each sectors of input or output, so that the overall monetary evaluation of the national activities with consideration of social and environmental impacts becomes

The conventional GNP is obtained by making ej and fk equal zero. The translation of MDA into a measure of welfare (although only the components from activity flows, not from property or other stocks of wealth) would require an additional factor wk for each end-use activity, to be determined, preferably, by direct expression of opinion by the members of society themselves,

The weight factor, wk, differentiates otherwise positive activities according to how much they benefit society and its individual members, rather than to how much they cost, and expresses an attitude toward the severity of those impacts that have been found to be negative. High welfare contributions may come from activities with small monetary value, as well as from activities without monetary assignment, in which case they would have to be added to the restricted data from the national accounts, as indicated in the formula given earlier. The stocks of wealth may also have to be weighed in accordance with personal preferences, averaged over the population of the society for which the MDA is evaluated.
One may determine all the weights or at least the welfare weights by democratic vote, where each member of society can examine the list of activities (on the Internet, similar activities possibly grouped together in order to limit the overwhelming number of categories used in many current national accounts) and place his or her weight factors ej, fk and wk (using a personal identity code as already required for all communication with government entities in many countries). The average of the weight factors for a particular activity from all those voting would be the one to use in the MDA. Clearly, a particular citizen does not need to put a weight factor on each component of activity, but can restrict the entries to activities for which the voter has views and feel confident putting in a number. Also, this would allow citizens to change their voting at any time if new information or insights induces them to change their ranking of any particular type of activity. The number of votes cast for each activity category, plus average and the standard deviation of voted weight factors for the category, can be publicized as assistance to further voting actions. As with any voting over the Internet,‡ strict security measures would have to be in place to avoid misuse.
Naturally, an alternative approach would be to have weight factors determined by independent scientists with deep insights in the scientific fields affecting each weight factor assignment. Such an approach, say, with ‘experts’ placed in government committees, or with departmental civil servants instead of independent scientists, would be similar to the way such enquiries are being conducted at present in many countries. This opens the usual discussions of whether ‘official’ experts are free of influence from lobby groups or from the political preferences of the sitting government, just like the use of general referenda or direct democracy via the Internet opens questions of whether citizens have sufficient knowledge to choose the weight factors in question, and whether they can perhaps be manipulated by interest groups to vote in ways not reflecting their own basic interests, by making use of subversive hiding of underlying mechanisms determining the real implications of casting votes in a particular way. More on such kinds of direct democracy follows in Section 3.2.4, as well in the scenario in Chapter 5.
As an example, the monetary quantities needed for determinating the MDA have been calculated for the Danish input–output tables of the 2011 national account, using a quickly created set of subjective weight factors, ej and fk, not seriously subjected to scrutiny, in order to illustrate the procedure. Table 3.1 shows the effect of applying the reductions in ‘green activity measures’ derived from resource depletion and environmental and social impacts, but only to the production and service providing sectors, not to the consumption sectors. Tables 3.2 and 3.3 include both impacts on the ‘green activity measure’ arising within the production/service sectors and also those from the consumption sectors and stock changes. In Table 3.2 the effect on private consumption sectors is depicted and in Table 3.3 the effect on public consumption sectors. The Statistics Denmark (2015a) categories used in the input–output matrix divide production and service into 235 categories and consumption into 295 categories. This is far too aggregated to allow a precise determination of the impact numbers to be subtracted. It is not known if the agricultural activities use ecological (organic) cultivation methods or traditional chemical cultivation methods with pesticides, etc. Similarly, the tables do not indicate which producers or service providers use renewable energy rather than fossil or nuclear fuels, and the tables cannot identify producers that use mineral resources in danger of depletion. Some of these data may be found in other statistical bases. For instance, the known penetration of ecological farming in Denmark (Danish Ministry of Food, Agriculture and Fisheries, 2010; Sørensen, 2012) and the share of renewable energy sources (Statistics Denmark, 2015b) are available and have been considered in the choice of the weight factors shown in Table 3.1. However, in many cases, such as for soil or waterway pollution and the use of rare minerals, the available data is of limited use (for example, statistics on materials use broad categories of physical amounts, while toxicity and emissions have rarely been quantified in more than a few specific case studies). In order to proceed from statistics of physical quantities, the monetizing of health and social effects from emissions have to use available life-cycle studies to quantify impacts (EC, 1995; Sørensen, 2011). Most impacts do not respect borders, in particular, the impacts from greenhouse gas emissions are felt globally, but with differences depending on local climatic and social conditions.
Table 3.1
Example of Applying Corrections Due to Resource Depletion and Environmental and Social Impacts to the National Activity Accounts of Denmark for 2011.
| Monetary evaluation of national activities | Private and public consumption and stock changes. Environmental and social impacts in production and service phases deducted | ||
| Denmark 2011, production/service sector | Impact factor | Import origin (M DKK) | National source (M DKK) |
| Agriculture and horticulture | 0.5 | 743 | 1,680 |
| Forestry | 0.3 | 42 | 1,191 |
| Fishing | 0.3 | 92 | 95 |
| Extraction of oil and gas | 0.9 | −80 | −147 |
| Extraction of gravel and stone | 0.5 | 74 | 79 |
| Mining support service activities | 0.5 | 0 | 111 |
| Production of meat and meat products | 0.7 | 486 | 1,935 |
| Processing and preserving of fish | 0.1 | 640 | 410 |
| Manufacture of dairy products | 0.1 | 1,610 | 5,995 |
| Manufacture of grain mill and bakery products | 0.1 | 1,480 | 5,280 |
| Other manufacture of food products | 0.1 | 6,958 | 4,728 |
| Manufacture of beverages | 0.1 | 2,182 | 3,498 |
| Manufacture of tobacco products | 0.1 | 413 | −162 |
| Manufacture of textiles | 0.3 | 643 | 466 |
| Manufacture of wearing apparel | 0.4 | 3,610 | 319 |
| Manufacture of leather and footwear | 0.5 | 753 | 55 |
| Manufacture of wood and wood products | 0.3 | 743 | 446 |
| Manufacture of paper and paper products | 0.5 | 444 | 47 |
| Printing, etc. | 0.8 | 19 | 10 |
| Oil refinery, etc. | 0.8 | 539 | 2,194 |
| Manufacture of basic chemicals | 0.7 | 32 | 255 |
| Manufacture of paints and soap, etc. | 0.7 | 215 | 324 |
| Pharmaceuticals | 0.5 | 3,117 | 4,791 |
| Manufacture of rubber and plastic products | 0.6 | 169 | 385 |
| Manufacture of glass and ceramic products | 0.3 | 193 | 46 |
| Manufacture of concrete and bricks | 0.4 | 82 | 314 |
| Manufacture of basic metals | 0.5 | 177 | 157 |
| Manufacture of fabricated metal products | 0.5 | 1,280 | 713 |
| Manufacture of computers and communication equipment, etc. | 0.6 | 3,217 | 631 |
| Manufacture of other electronic products | 0.6 | 2,840 | 2,056 |
| Manufacture of electric motors, etc. | 0.6 | 162 | 342 |
| Manufacture of wires and cables | 0.6 | 83 | 33 |
| Manufacture of household appliances, lamps, etc. | 0.5 | 1,262 | 480 |
| Manufacture of engines, windmills and pumps | 0.5 | 527 | 3,333 |
| Manufacture of other machinery | 0.5 | 5,520 | 5,195 |
| Manufacture of motor vehicles and related parts | 0.5 | 8,041 | 296 |
| Manufacture of ships and other transport equipment | 0.5 | 139 | 393 |
| Manufacture of furniture | 0.5 | 2,170 | 1,339 |
| Manufacture of medical instruments, etc. | 0.5 | 581 | 579 |
| Manufacture of toys and other manufacturing | 0.5 | 1,150 | 1,236 |
| Repair and installation of machinery and equipment | 0.4 | 945 | 436 |
| Production and distribution of electricity | 0.3 | 445 | 7,855 |
| Manufacture and distribution of gas | 0.4 | 65 | 2,010 |
| Steam and hot water supply | 0.3 | 0 | 6,077 |
| Water collection, purification and supply | 0.3 | 0 | 2,127 |
| Sewerage | 0.3 | 0 | 4,683 |
| Waste management and materials recovery | 0.3 | 15 | 3,963 |
| Construction of new buildings | 0.6 | 76 | 19,614 |
| Civil engineering | 0.1 | 861 | 32,421 |
| Professional repair and maintenance of buildings | 0.6 | 56 | 17,125 |
| Own account repair and maintenance of buildings | 0.6 | 9 | 2,934 |
| Sale of motor vehicles | 0.2 | 0 | 13,020 |
| Repair and maintenance of motor vehicles, etc. | 0.7 | 0 | 3,621 |
| Wholesale | 0.3 | 4 | 34,713 |
| Retail sale | 0.4 | 8 | 48,757 |
| Passenger rail transport, interurban | 0.5 | 31 | 2,208 |
| Transport by suburban trains, buses and taxi operation, etc. | 0.7 | 30 | 2,945 |
| Freight transport by road and via pipeline | 0.8 | 13 | 109 |
| Water transport | 0.2 | 18 | 1,504 |
| Air transport | 0.9 | 68 | 41 |
| Support activities for transportation | 0.5 | 41 | 2,749 |
| Postal and courier activities | 0.8 | 0 | 168 |
| Hotels and similar accommodation | 0.4 | 0 | 3,918 |
| Restaurants | 0.4 | 0 | 18,548 |
| Publishing | 0.4 | 308 | 3,778 |
| Publishing of computer games and other software | 0.2 | 990 | 1,954 |
| Film, television and sound recording activities | 0.4 | 0 | 2,870 |
| Radio and television broadcasting | 0.2 | 7 | 3,652 |
| Telecommunications | 0.2 | 1,484 | 13,362 |
| Information technology service activities | 0.2 | 2,603 | 7,576 |
| Information service activities | 0.2 | 177 | 727 |
| Monetary intermediation | 0.8 | 1 | 5,650 |
| Mortgage credit institutes, etc. | 0.7 | 0 | 4,503 |
| Insurance and pension funding | 0.6 | 5 | 7,551 |
| Other financial activities | 0.8 | 0 | 388 |
| Buying and selling of real estate | 0.8 | 0 | 1,284 |
| Renting of nonresidential buildings | 0.2 | 0 | 419 |
| Renting of residential buildings | 0.2 | 0 | 51,325 |
| Owner-occupied dwellings | 0.2 | 0 | 84,073 |
| Legal activities | 0.8 | 62 | 693 |
| Accounting and bookkeeping activities | 0.6 | 1 | 115 |
| Business consultancy activities | 0.3 | 0 | 766 |
| Architectural and engineering activities | 0.3 | 33 | 2,820 |
| Scientific research and development (market) | 0.2 | 3,458 | 5,614 |
| Scientific research and development (non-market) | 0.2 | 0 | 2 856 |
| Advertising and market research | 0.8 | 0 | 22 |
| Other technical business services | 0.8 | 0 | 101 |
| Veterinary activities | 0.3 | 0 | 777 |
| Rental and leasing activities | 0.6 | 4 | 699 |
| Employment activities | 0.5 | 5 | 5 779 |
| Travel agent activities | 0.6 | 0 | 5,546 |
| Security and investigation activities | 0.8 | 0 | 14 |
| Services to buildings, cleaning and landscape activities | 0.8 | 0 | 520 |
| Other business service activities | 0.8 | 0 | 120 |
| Public administration | 0.5 | 0 | 38,405 |
| Defence, public order, security and justice activities | 0.8 | 0 | 9,324 |
| Rescue service etc. (market) | 0.6 | 4 | 595 |
| Primary education | 0.2 | 0 | 44,881 |
| Secondary education | 0.2 | 0 | 22,891 |
| Higher education | 0.2 | 0 | 29,283 |
| Adult and other education (nonmarket) | 0.2 | 0 | 4,297 |
| Adult and other education (market) | 0.2 | 271 | 1,567 |
| Hospital activities | 0.5 | 48 | 42,401 |
| Medical and dental practice activities | 0.5 | 57 | 16,514 |
| Residential care activities | 0.5 | 0 | 15,192 |
| Social work activities without accommodation | 0.3 | 0 | 67,718 |
| Theatres, concerts and arts activities | 0.3 | 139 | 5,604 |
| Libraries, museums and other cultural activities (market) | 0.2 | 0 | 593 |
| Libraries, museums and other cultural activities (nonmarket) | 0.2 | 0 | 8,485 |
| Gambling and betting activities | 0.8 | 0 | 826 |
| Sports activities (market) | 0.5 | 13 | 1,143 |
| Sports activities (nonmarket) | 0.5 | 0 | 2,593 |
| Amusement and recreation activities | 0.7 | 0 | 999 |
| Activities of membership organizations | 0.8 | 0 | 4,124 |
| Repair of personal goods | 0.4 | 1 | 1,972 |
| Other personal service activities | 0.5 | 62 | 4,161 |
| Activities of households as employers of domestic personnel | 0.5 | 0 | 2,340 |


Source: Basic input–output data are from Statistics Denmark (2015a).
The fraction shown in the column ‘Impact factor’ is for each sector of production or service applied to the corresponding activity figure in monetary terms and deducted to get the values given in the two last columns, representing output consumption and stock change split according to whether the input is import or a local enterprise. 1 DKK is about €0.13 or US $ 0.15 (mid-2015).
Table 3.2
Example of Applying Corrections Due to Resource Depletion and Environmental and Social Impacts to the National Activity Accounts of Denmark for 2011.
| Monetary evaluation of national activities | Consumption impact factor | Private consumption (both production and use impact estimates subtracted) (M DKK) |
| Denmark 2011, private sector | ||
| Bread and cereals | 0.2 | 8,600 |
| Meat | 0.4 | 2,708 |
| Fish | 0.3 | 1,617 |
| Eggs | 0.3 | 471 |
| Milk, cream, yoghurt, etc. | 0.3 | 3,942 |
| Cheese | 0.4 | 2,056 |
| Oils and fats | 0.5 | 1,036 |
| Fruit and vegetables except potatoes | 0.3 | 5,661 |
| Potatoes, etc. | 0.2 | 956 |
| Sugar | 0.4 | 184 |
| Ice cream, chocolate and confectionery | 0.3 | 6,603 |
| Food products | 0.3 | 2,127 |
| Coffee, tea and cocoa | 0.5 | 1,014 |
| Mineral waters, soft drinks, fruit and vegetable juices | 0.5 | 2,534 |
| Spirits and wine | 0.5 | 3,397 |
| Beer | 0.5 | 1,591 |
| Tobacco, etc. | 1.0 | −2,864 |
| Articles of clothing | 0.3 | 11,570 |
| Cleaning, repair and hire of clothing | 0.6 | 7 |
| Footwear | 0.2 | 3,314 |
| Actual rentals for housing | 0.2 | 38,118 |
| Imputed rentals for housing | 0.2 | 63,322 |
| Maintenance and repair of the dwelling | 0.4 | 925 |
| Refuse collection, other services | 0.5 | 3,845 |
| Water supply and sewerage services | 0.5 | 1,135 |
| Electricity | 0.3 | 12,909 |
| Gas | 0.7 | 758 |
| Liquid fuels | 0.9 | −1,498 |
| District heating, etc. | 0.6 | 4,368 |
| Furniture and furnishings, carpets and other floor coverings | 0.5 | 2,608 |
| Household textiles | 0.5 | 656 |
| All major household appliances and small electric household appliances | 0.5 | 943 |
| Repair of major household appliances | 0.5 | 52 |
| Glassware, tableware and household utensils | 0.3 | 1,641 |
| Tools and equipment for house and garden | 0.5 | 712 |
| Nondurable household goods | 0.6 | 350 |
| Domestic services and household services | 0.4 | 153 |
| Pharmaceutical products and other medical products | 0.3 | 2,670 |
| Therapeutic appliances and equipment | 0.3 | 1,215 |
| Out-patient services | 0.4 | 1,081 |
| Hospital services | 0.4 | 375 |
| Purchase of vehicles | 0.3 | 12,977 |
| Spare parts, maintenance and repair of personal transport equipment | 0.6 | −2,603 |
| Fuels and lubricants for personal transport equipment | 1.0 | −7,799 |
| Other services in respect of personal transport equipment | 0.9 | −2,840 |
| Transport services | 0.9 | −9,484 |
| Postal services | 0.7 | −249 |
| Telephone and data communication equipment | 0.4 | −25 |
| Telephone and data communication services | 0.5 | 4,937 |
| Radio and television sets, etc. | 0.4 | 1,658 |
| Photographic equipment, etc. | 0.5 | 154 |
| Data processing equipment | 0.4 | 2,036 |
| Recording media for pictures and sound | 0.4 | 778 |
| Repair of a/v and data processing equipment | 0.7 | −87 |
| Other major durables for recreation and culture | 0.4 | 1,060 |
| Other recreational items and equipment, gardens and pets | 0.7 | −316 |
| Recreational and cultural services | 0.1 | 16,884 |
| Books, newspapers, periodicals and miscellaneous printed matter | 0.6 | 474 |
| Stationery and drawing materials, etc. | 0.4 | 280 |
| Package holidays | 0.8 | −5,330 |
| Education | 0.1 | 4,360 |
| Restaurants and catering | 0.8 | −5,517 |
| Accommodation services | 0.5 | 1,236 |
| Hairdressing salons and personal grooming establishments | 0.7 | −824 |
| Appliances, articles and products for personal care | 0.3 | 3,153 |
| Jewellery, clocks and watches | 0.2 | 860 |
| Other personal effects | 0.3 | 1,189 |
| Retirement homes, day-care centres, etc. | 0.3 | 1,526 |
| Kindergartens, nurseries, etc. | 0.3 | 4,384 |
| Insurance | 0.0 | 8,445 |
| Financial services | 0.4 | −6,704 |
| Other services | 0.3 | 494 |
| Consumption by nonresidents on the economic territory | 0.7 | 7,542 |
| Consumption by residents in the ROW | 0.7 | −7,464 |
| Private hospital services | 0.4 | 538 |
| Private recreational and cultural services | 0.2 | 1,546 |
| Private education | 0.1 | 7,247 |
| Private retirement homes, day-care centres, etc. | 0.3 | 717 |
| Private kindergartens, nurseries, etc. | 0.3 | 116 |
| Other private services | 0.2 | 0 |


Source: Basic input–output data are from Statistics Denmark (2015a).
The fraction shown in the column ‘Consumption impact factor’ is for each sector of consumption or stock change. Together with the impact factor of Table 3.1, it is multiplied by and subtracted from the corresponding activity figure in monetary terms, to give the result shown in the last column, here only for private sector outputs.
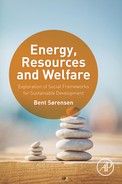
Table 3.3
Example of Applying Corrections Due to Resource Depletion and Environmental and Social Impacts to the National Activity Accounts of Denmark for 2011.
| Monetary evaluation of national activities | Consumption impact factor | Public consumption (both production and use impact estimates subtracted) (M DKK) |
| Denmark 2011, public sector | ||
| Food products | 0.3 | 93 |
| Footwear | 0.2 | 8 |
| Maintenance and repair of the dwelling | 0.4 | 38 |
| Furniture and furnishings, carpets and other floor coverings | 0.5 | 26 |
| Household textiles | 0.5 | 43 |
| Domestic services and household services | 0.4 | 322 |
| Pharmaceutical products and other medical products | 0.3 | 2,573 |
| Therapeutic appliances and equipment | 0.3 | 594 |
| Out-patient services | 0.4 | 1,534 |
| Purchase of vehicles | 0.3 | 183 |
| Transport services | 0.4 | −39 |
| Data processing equipment | 0.1 | 13 |
| Appliances, articles and products for personal care | 0.3 | 3 |
| Insurance | 0 | 66 |
| Therapeutic appliances and equipment | 0.3 | 308 |
| Out-patient services | 0.4 | 846 |
| Hospital services | 0.4 | 4,082 |
| Recreational and cultural services | 0.1 | 6,894 |
| Education | 0.1 | 60,346 |
| Retirement homes, day-care centres, etc. | 0.3 | 11,715 |
| Kindergartens, nurseries, etc. | 0.3 | 11,097 |
| General services | 0.2 | 6,692 |
| Defence | 1 | −19,745 |
| Order, safety | 0.2 | 100 |
| Economic affairs | 0.5 | 2,540 |
| Environmental protection | 0.1 | 2,514 |
| Housing, community amenities | 0.4 | 212 |
| Health | 0.4 | 544 |
| Recreation, culture and religion | 0.2 | 2,069 |
| Education | 0.1 | 1,123 |
| Social protection | 0.3 | 2,027 |
| Stock change | ||
| Dwellings | 0.4 | 8,056 |
| Buildings other than dwellings | 0.4 | 2,765 |
| Other structures and land improvements | 0.5 | 13,975 |
| Transport equipment | 0.6 | 4,491 |
| Computer hardware | 0.2 | 5,836 |
| Telecommunication equipment | 0.2 | 510 |
| Other machinery and equipment and weapon systems | 0.6 | −2,752 |
| Cultivated biological resources | 0 | −73 |
| Research and development | 0.1 | 27,676 |
| Mineral exploration and evaluation | 0.4 | −307 |
| Computer software and databases | 0.1 | 18,341 |
| Entertainment, literary or artistic originals and other intellectual property products | 0.1 | 2,892 |
| Valuables | 0 | 2,010 |
| Inventories | 0 | 7,797 |
| Exports (without deductions for negative impacts during use) | 548,106 | |
| Imports (with deductions for negative impacts in production and use) | 371,262 | |
| ‘Green GNP’ (misleading in respect to import/export ratio) | 595,090 | |
| Consumption, stock change and export corrected for national impacts | 966,352 | |
| Total stock change | 91,216 | |
| Total private consumption | 228,210 | |
| Total public consumption | 98,819 | |

Source: Basic input–output data are from Statistics Denmark (2015a).
The fraction shown in the column ‘Consumption impact factor’ is for each sector of consumption or stock change. Together with the impact factor of Table 3.1, it is multiplied by and subtracted from the corresponding activity figure in monetary terms, to give the result shown in the last column, here only for public sector outputs. At the end, imports and exports are summed up, although no consumption impact subtraction can be done for the export values without doing similar studies for the countries receiving the exports. In any case, such impacts should, for consistency, be accounted for by the receiving countries, not by the exporting country.
To arrive at the GNP (all weight factors equal to one) or the MDA (including subtractions due to impacts from resource depletion, environmental degradation and negative social impacts), one has to sum all the consumption and stock change sector activities, add the exports and subtract the imports. Using the Danish 2011 national accounts as an example, the value of the exports are 12% above that of the imports, but the MDA difference resulting from the impact corrections is much larger, because for imports, corrections are made both for production and use, but for exports only for production. This is not an error, because the impacts from the use of goods and services exported by Denmark should be incorporated in the green accounts of the countries that import them, and not in the Danish account. A dominating contribution to the Danish CO2 emissions is from air and particularly ship emissions outside Denmark, due to the country’s large presence in international sea hauling of goods. These emissions are not included in the traditional green accounting, as they primarily relate to exports of transport services.
The reduction from GNP to MDA presented here cannot be compared with the preliminary attempts to establish a green GNP by Statistics Denmark (Gravgård, 2013), because Statistics Denmark only consider a limited devaluing of natural resources similar to that of production machinery, that is with use of a similar positive discount rate, prone to the criticism discussed in Section 2.1. Global climatic impacts are not considered at all. Pollution of soil and waterways is not available in monetary terms, and neither are data for materials depletion (the data on materials maintained by Statistics Denmark only specify masses, with no distinction between gravel and gold). As a consequence, Statistics Denmark finds a modest reduction in GNP from ‘green’ corrections.
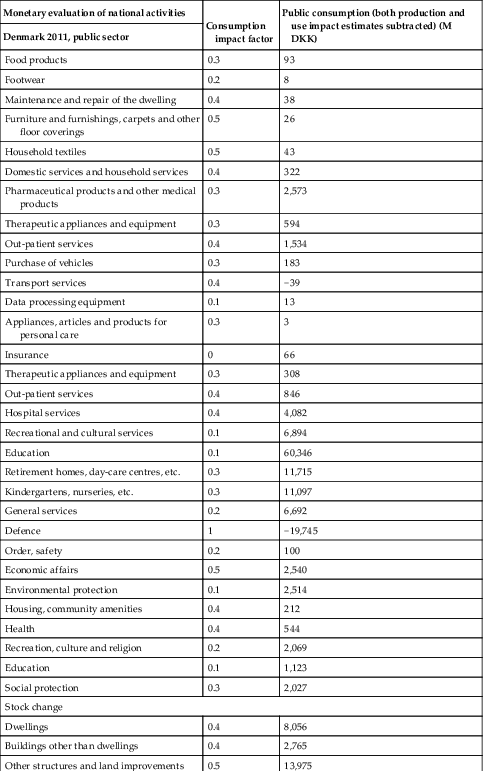
Fig. 3.1 shows the conventional GNP for Denmark in fixed prices from 1966 to 2011, along with other quantities derived from the input–output tables of Statistics Denmark (2015a). The GNP grows at a steady rate from 1966 to 1996, then nearly doubles its growth rate to 2006, after which the 2007+ financial crises halts the growth and even exhibits a slight fall in GNP. The year 1996 is the turning point where a deficit in the foreign trade balance is replaced by a surplus, growing after the financial crisis. The consumption behavior shows that it is the private consumption that has stagnated after 2007, whereas public spending grows modestly throughout the 45-year period displayed. Some of the growth after 2006 (e.g., in exports) is accompanied by a decrease in stocks.
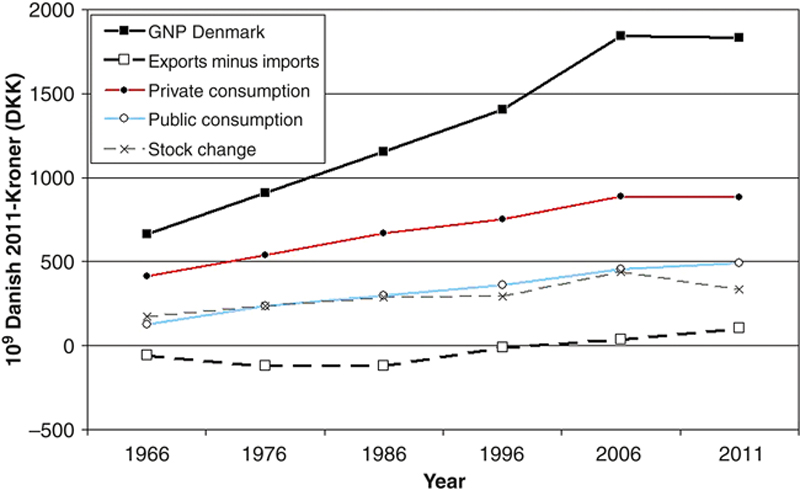
Figure 3.1 Development of the GNP of Denmark, with some important constituents (in billion DKK at 2011 prices). Input–output data from Statistics Denmark (2015a) have been used.
In Fig. 3.2, the corresponding behavior of the MDA is shown along with the deductions made by the crude illustrative model of MDA, on the same components as those shown in Fig. 3.1. First it is seen that the MDA grows much more rapidly than the GNP, and even grows after the financial crises. The reason for this is that the negative impacts subtracted to get from GNP to MDA have in a number of cases diminished during the period considered. Around 1960, the Danish agricultural production was based on extensive use of plant pesticides and preventive use of antibiotics on livestock animals. These abuses dropped by more than a factor of four from 1960 to 2010, and furthermore, ecological methods entered Danish agriculture in a major way from around the year 2000 (Sørensen, 2012). An even larger contributor to reducing negative impacts was the radical change of the energy industry, both by replacing coal by natural gas (with about half the greenhouse gas emissions) and by use of renewable energy such as the expansion of on- and off-shore wind power production. Fig. 3.2 shows that the decline in negative impacts from production is reflected in the MDA value of exports. However, as noted, the impacts from usage are not deducted from exports because they must be evaluated in the country importing the goods (or services). Because usage impacts are deducted from imported goods and services; Fig. 3.2 no longer shows an approximate balancing between imports and exports. The private and public sector consumption shows the same trends as the corresponding GNP components, including the fall in private consumption. However, the value of stocks no longer declines after 2007, because the negative impacts associated with the changing stocks are smaller than at previous times. In summary, this small exercise shows that the MDA has the potential for a much better understanding of the real development of a national economy.
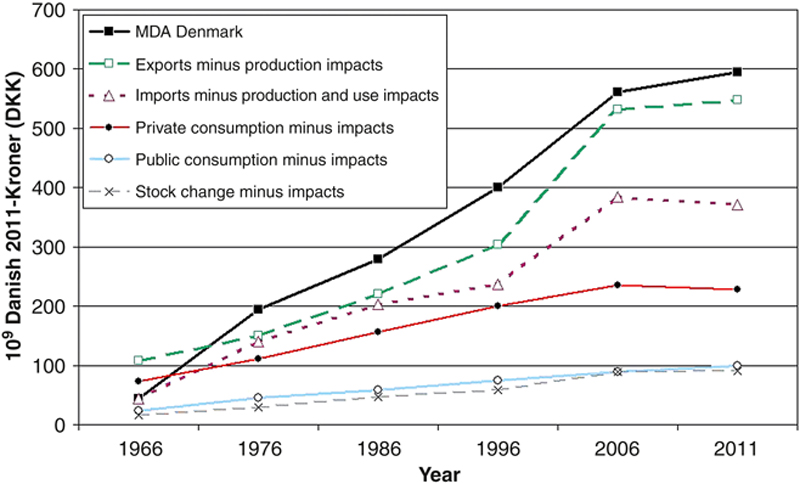
Figure 3.2 Development of the MDA of Denmark with some important constituents.
The MDA differs from the GNP by subtracting environmental and social impact costs in production and use, here based on a set of simplistic factors multiplying each activity transaction, as discussed in the text. These factors have been held constant except for the production impact factors of agriculture and electricity production, taking into account the declining use of pesticides and increasing ecological production, and the transition from oil and coal first to natural gas and then toward renewable energy power generation (currently covering about 40% of demand).
The MDA differs from the GNP by subtracting environmental and social impact costs in production and use, here based on a set of simplistic factors multiplying each activity transaction, as discussed in the text. These factors have been held constant except for the production impact factors of agriculture and electricity production, taking into account the declining use of pesticides and increasing ecological production, and the transition from oil and coal first to natural gas and then toward renewable energy power generation (currently covering about 40% of demand).
3.1.3. A New Look on Wealth and Inequality, Illustrated by a Case Study
While GDP or MDA are measures of monetary flows, wealth must be related to stocks of assets. Again, a case study for Denmark will be used, this time to exemplify an attempt to define a measure of wealth that takes into account the negative impacts, as discussed in the modification from GNP to MDA. Regarding availability of data, the situation is poor compared with the flow analyses. Often, national statistical data on stocks are obtained from a time series of flow data, by accumulating additions and losses of assets over a period, but unfortunately, frequent changes in the definitions used for statistical variables make the summing up unreliable, in addition to the fact that some items have data only for a limited number of years.
The stocks of assets are of four kinds:
1. Natural assets (land, sea, forests, soils, underground and biota, where some of these are depletable (mineral deposits) or may be destroyed).
2. Produced assets (buildings, infrastructure, vehicles and communication means, machinery, electronics, etc., all with a finite lifetime).
3. Human assets (lives, skills, knowledge, cultural and social tools for creating coherence in a society, all of which are limited in duration by lifespan and have to be renewed).
4. Financial assets (tokens that may be exchanged for real assets, typically in the categories 2 or maybe 3).
In contrast to the World Bank concept of assets (capital) mentioned in Section 2.1.1, no unspecified ‘rest category’ is left as intangible. Those components for which a method of estimation has been identified are included. This comprises all the categories that the World Bank lists as “intangible”.
The available Danish statistics enables an overview of some of the relevant assets, as depicted in Figs 3.3 and 3.4. Fig. 3.3 shows the sum of important produced assets (category 2), along with fossil assets (a depletable resource in category 1) and pension funds (category 4). Also indicated is the balance of financial instruments and two components of the passives: public and private debt. The private debt is one of the largest (per capita) in the world and some studies have expressed worry over the apparent stability of the Danish economy in the light of such debt levels (Schwartzkopff, 2013; Davies et al., 2009). The Danish National Bank has in response explained why the debt is not causing it concern (Andersen et al., 2012), first of all arguing that the pension funds build up by Danish citizens are also among the highest in the world, so that along with the welfare economy of the largely free medical, educational and to some extent social services, Danes do not have much motive not to consume as much as the money lenders will allow them, expecting the pension savings to ensure a satisfactory retirement life. The pension wealth is largely of the insurance type, and since the introduction of the welfare paradigm during the 1930s, it has been shaped by most salaried Danes paying 15% of their income to the pension operator. This has typically been 5% paid by the salaried person plus an additional 10% paid by the employer. This scheme was an important incentive when the system was introduced, because individuals not wanting to part with 5% of their earnings also lost the 10% from the employer. Subsequently, the employer part has of course figured as part of the salary in union–employer negotiations.
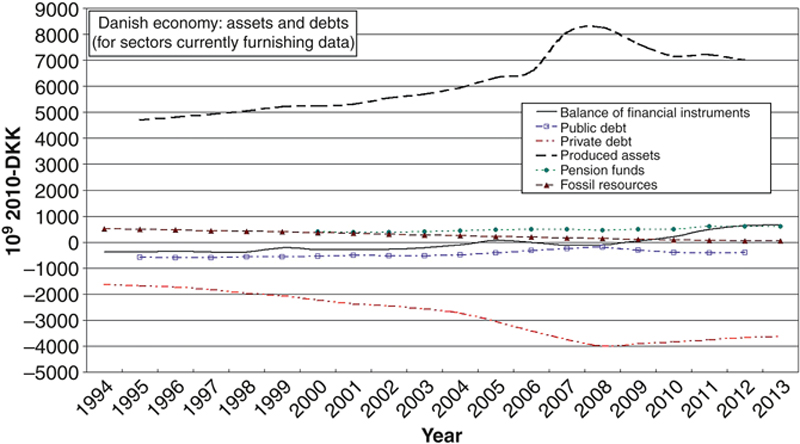
Figure 3.3 Selected stock inventory of the Danish economy in market prices adjusted to the 2010 price index.
The balance of financial instruments covers all sector of the economy and both domestic and foreign assets and liabilities. The public debt comprises both domestic and international debts, while the private debt includes only domestic loans. The produced assets are detailed in Fig. 3.4. The pension funds are stock and equity holdings of private pension enterprises, as valued for each specific year, and the fossil resources are the sum of market values over the years remaining to depletion (the feasible production has already declined to a value that makes the estimate of extrapolated future extraction rather unimportant). Data sources: Statistics Denmark (2015b; Skat (2015); Danish National Bank (2015).
The balance of financial instruments covers all sector of the economy and both domestic and foreign assets and liabilities. The public debt comprises both domestic and international debts, while the private debt includes only domestic loans. The produced assets are detailed in Fig. 3.4. The pension funds are stock and equity holdings of private pension enterprises, as valued for each specific year, and the fossil resources are the sum of market values over the years remaining to depletion (the feasible production has already declined to a value that makes the estimate of extrapolated future extraction rather unimportant). Data sources: Statistics Denmark (2015b; Skat (2015); Danish National Bank (2015).

Figure 3.4 Stock inventory of some important produced assets in the Danish economy in market prices adjusted to the 2010 price index.
The dominating values, those of building property, are taken from (currently biannual) taxation assessments (Skat, 2015), comprising all property with buildings (all types of dwellings, industrial, commercial and farm buildings). The value of the plot of land upon which the buildings are erected is included, but not the value of open land, forests, lakes or ocean areas. The remaining tangible assets are valued at purchase price minus depreciation along an assumed average lifetime, and a similar procedure is used for intellectual property (Statistics Denmark, 2015c). Infrastructure includes roads, bridges and railways, while equipment comprises any equipment used in commerce, industry and private households.
The dominating values, those of building property, are taken from (currently biannual) taxation assessments (Skat, 2015), comprising all property with buildings (all types of dwellings, industrial, commercial and farm buildings). The value of the plot of land upon which the buildings are erected is included, but not the value of open land, forests, lakes or ocean areas. The remaining tangible assets are valued at purchase price minus depreciation along an assumed average lifetime, and a similar procedure is used for intellectual property (Statistics Denmark, 2015c). Infrastructure includes roads, bridges and railways, while equipment comprises any equipment used in commerce, industry and private households.
The pension funds shown in Fig. 3.3 are the market values of the assets accumulated in the pension enterprises at present, that is stock and bond quotes, plus any other property of the pension enterprises, such as buildings. The very strict legislation regarding permitted pension investments in effect until 2 decades ago have been replaced by less strict rules. As a result, some pension enterprises lost considerable value in 2008–10 when stock values fell. Future pensions will depend on capable management of the pension funds, which may or may not materialize, and the current market value is therefore used here, rather than the predicted stock value with some projected interest earnings to the future start time of pension payments (on average 20–25 years) used by the National Bank in the 2012 paper quoted.
The Danish fossil resources, oil and natural gas from the North Sea, have been declining since their first exploitation around 1980. Because very few are left today and the extraction correspondingly declining, a credible stock curve is constructed based on an assumed depletion by early 2020s, by adding extracted amounts annually, backward to the beginning of the graph in 1994.
The largest assets depicted in Fig. 3.3 are those of produced goods including buildings. The assets valuated are detailed in Fig. 3.4. For the category 2 assets of vehicles, equipment, agricultural livestock, infrastructure such as roads, bridges and airports, the valuation is taken from Statistics Denmark (2015c), based on price at purchase or construction, adjusted by a standard rate of depreciation over an assumed lifetime. Also included, because they appear in the same context in the data sets used, is intellectual property (from the arts to technical patents, all belonging to category 3).
In the case of buildings, the similarly calculated data from Statistics Denmark are not used because this would hide market changes in value such as those seen after the burst of the bubble economy in 2007. It is a surprising fact that Danish houses are bought and sold at prices that do not decline systematically toward the end of life of the structure. Despite the compulsory condition and energy use reports that have to be produced when houses are traded, prices of houses at similar locations but with widely differing ranking are quite similar. In order to take such behavior into account, assessment values from the Danish tax authorities are used. They reflect actual sales prices in each neighborhood and comprise both the building (of any type from dwellings to agricultural, industrial and commercial buildings) and the plot of land on which it stands, thus stretching over categories 1 and 2. Other land resources without buildings are not included. The assessment for taxation purposes takes place biannually (one year for dwellings, the next for other buildings) and aims to provide market prices. Therefore, the effect of the building price bubble’s rise and fall is captured with only a slight delay.
Turning to human capital assets, Fig. 3.5 gives some background information on financial activities aimed to build up such assets, notably health and old age care, education and unemployment compensation, but also general expenses for administration, security, recreation and environmental protection. It is seen that the largest annual cost is for old age care, including help in homes (food delivery, cleaning, gardening, personal care) as well as in institutions (from especially equipped houses and apartments with access to mobile nurses to retirement homes and intensive care units). Next come health expenses for hospitals, specialized clinics and general practice doctors (dental work is strangely not supported except for certain age groups such as school children) and unemployment compensation. For poverty assistance the expenses include not just living expenses, but also aid in paying for dwelling rent or mortgage payments, such that for example a time-limited unemployment period does not force a family to move away from the dwelling they are accustomed to living in. The curve for educational expenses is discontinuous because before 2007, only government expenses are included, not the substantial municipal outlays, particularly for primary schools. The same is true for environmental protection, where the expenses carried by municipalities, for example for securing coastal and forest areas against storm damage or cleaning up after such damage, have not been included.
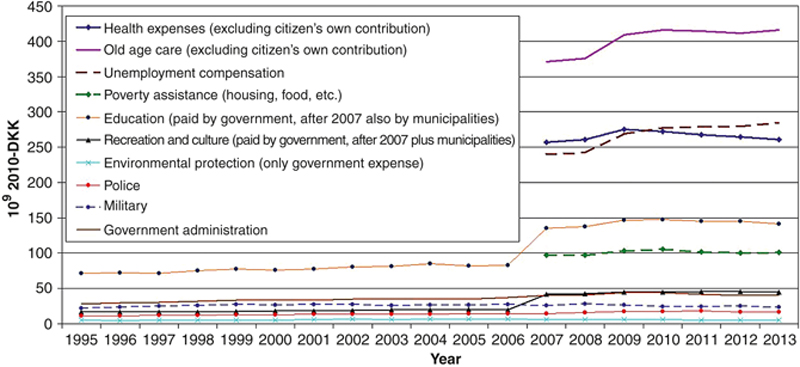
Figure 3.5 Annual Danish expenditures for building or maintaining human and social capital (see text for details). Based on Statistics Denmark (2015c).
However, on a more general level of discussion, entities such as the capital health and education assets may not have any strong relation to the expenses spent on activities in these areas, and many of the social ‘repair’ expenses, such as unemployment compensation, do not have any obvious function in building up human capital. First, education will be considered.
3.1.3.1. Education
In the most recent version of the World Bank study of wealth, education is included and represented by the expense that nations put into educational activities (World Bank, 2011). As argued earlier, this is not an entirely fair representation of educational capital, so a different method of evaluation should be found. Educating individuals does not, of course, create a permanent stock of assets, but in the current, highly technology-oriented societies, it has to be renewed by further education, at least through the working life of each person, and then has to be passed on to the following generation by new education or other learning avenues.
An idea of the value of education may be obtained from the differences in earnings for people with different education. Again using Denmark as a case study, Fig. 3.6 shows the development in the distribution of the numbers of people attaining a given level of education, and Fig. 3.7 shows the income they on average is able to derive from their level of education. Because it takes longer to reach a higher level of education, it is sometimes argued that the subsequent number of years with a higher income is smaller than for those with less education. This is only partially right, because unskilled jobs (in present societies) are on average more physically demanding and lead to earlier attrition. As a result, people with higher education have a tendency to retire later, and therefore the lifelong earnings are not reduced as much as indicated by the length of study. It is interesting that Fig. 3.6 shows that the number of people with higher education has increased dramatically during the last decades, while Fig. 3.5 showed that the expenses devoted to education have stayed constant or slightly declined. One could marvel over the increase in educational productivity, but the real effect of the budget cuts relative to the number of students have also included dilution of the depth of curriculum, in addition to the obvious decline in individual student–teacher contact.
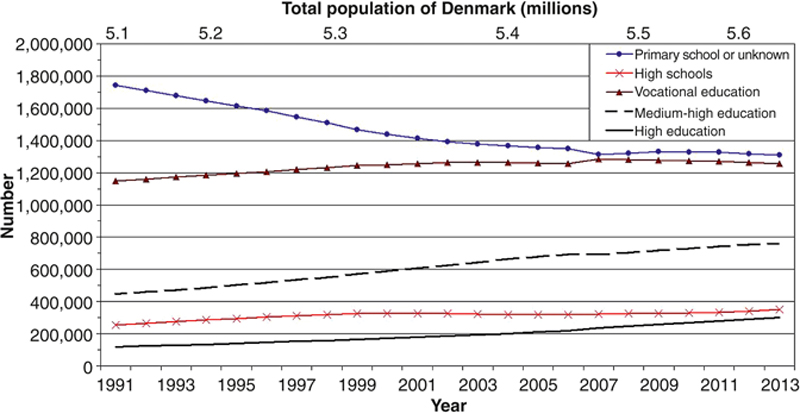
Figure 3.6 Highest level of formal education reached by the Danish population (total population at top). Based on Statistics Denmark (2015e).

Figure 3.7 Average income per capita in Denmark (from salary, subsidy or own business) as a function of the highest educational level reached.
Only persons in the age interval 15–65 are included. Subsidies such as unemployment benefits are included, and their size can be seen in Fig. 3.8. Pensions are not included. Based on Statistics Denmark (2015f).
Only persons in the age interval 15–65 are included. Subsidies such as unemployment benefits are included, and their size can be seen in Fig. 3.8. Pensions are not included. Based on Statistics Denmark (2015f).
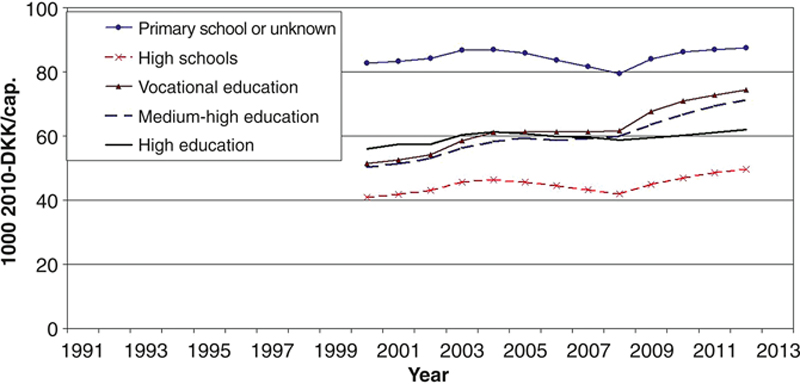
Figure 3.8 Level of public support (unemployment compensation and social contributions such as poverty assistance) averaged over all persons in each educational level group (ie not just over those receiving the support). Based on Statistics Denmark (2015f).
Fig. 3.6 indicates that the number of people with only primary school education is declining in Denmark, the number of people choosing vocational training is levelling off, and the number of people taking medium and long (academic) educations are on the rise. The income implications shown in Fig. 3.7 show that when both earned and subsidized income are counted, people with a vocational education earn 50% more than those with only the compulsory schooling, those with medium–high education have, since about the year 2000, earned around 80% more and people with an academic education earned on average 180% more, a picture that is only modestly altered by considering lifelong accumulated earnings. It should be noted that the statistical data used comprises all persons aged 15–65 years but counts income only from those with an earned income, either salaried and self-employed people or people living off interest/insurance or subsidy.
The implication of including income by public subsidy follows from Fig. 3.8, which distributes the subsidy payments on the same grouping of educational levels. Here it is seen that the group with only primary school education on average receives half of its income from subsidies and thus only half from their own work. For the higher education groups, the subsidy part is considerably smaller and for the academic level only 10–11% of the income has come from subsidies during the period 2000–12.
In order to calculate the value of the educational effort one might take the increase in earning for each person in society and multiply it by the average number of years through which the learning is expected to sustain a higher earning. In a future where lifelong education beyond the initial ‘formal’ education is more closely connected with increased income, more complex schemes of evaluation need to be used, but for the information presently available, using the difference between the earnings of each group from Fig. 3.7 and the subsidies of Fig. 3.8 to estimate the capital stock associated with further education will do. The earning difference should then be multiplied by 30–35, representing the years an average person of age just under 40 in each education group will continue to earn more than an unskilled person. Finally, a stock value for the assets of people with only primary school education should be added. This value is certainly not zero, as the primary school education in countries such as Denmark allows the recipients to perform many functions not possible by someone not having had primary school attendance. Setting the earning of the latter (rather hypothetical in a society like Denmark) at zero, the educational stock should just be calculated as indicated earlier, but relative to zero earning rather than relative to the earning of someone with only primary school education. This procedure along with an average knowledge lifetime at no depreciation of 35 years has been used in constructing the educational capital shown in Fig. 3.10. No depreciation is applied under the assumption that forgotten or outdated education is continuously renewed through professional experience and through adult education of suitable nature, whether taught or self-administered. The ability to update knowledge is fortunately becoming part of most current education, but unfortunately, many jobs are organized in ways that leave insufficient time for systematic and continued learning (ask your practising medical doctor what scientific journals he or she reads!).
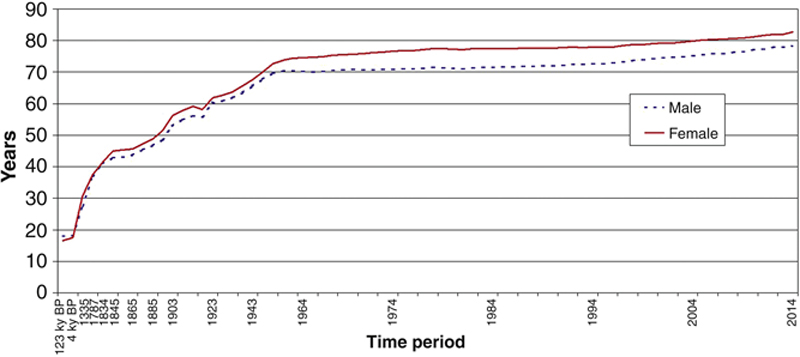
Figure 3.9 Variations in life expectancy at birth in Denmark (Sørensen, 2012; Statistics Denmark, 2015g). ‘ky BP’ is 1000 years before present.
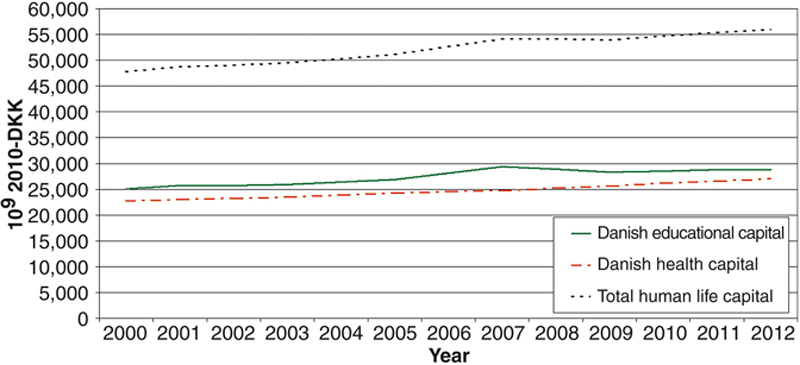
Figure 3.10 Valuation of Danish human assets.
The total life capital is calculated as the sum of values describing the human capacity to service society through work, valued as earnings depending on education, and values of health and longevity extensions by medical and lifestyle advances, in turn permitting social coherence activities and cultural activities such as producing science and knowledge, art and entertainment. Data are derived from the sources of Figs 3.8 and 3.9, as well as from EC (1995) and Sørensen (2011).
The total life capital is calculated as the sum of values describing the human capacity to service society through work, valued as earnings depending on education, and values of health and longevity extensions by medical and lifestyle advances, in turn permitting social coherence activities and cultural activities such as producing science and knowledge, art and entertainment. Data are derived from the sources of Figs 3.8 and 3.9, as well as from EC (1995) and Sørensen (2011).
3.1.3.2. Health
The consideration of citizens’ health as an asset for society has been suggested by Arrow et al. (2012). Realizing that the expenditures of the health sector may be a poor indicator of value, Arrow et al. propose to measure the health as a capital asset by way of life expectancy, arguing that increased longevity is the outcome of medical activities. The ‘zero-point’ of this scale of value is not easy to define. What would the life expectancy be without health services? Hardly less than 20 years, like the life expectancy of early Stone Age humans (Sørensen, 2012). Life expectancy has risen as a result of changes in lifestyle, more adequate food selection, less dangerous work and many other things not part of the basic efforts of the health sector. In the case of Denmark, used earlier as an example, the average life expectancy at birth rose from around 44 years in around 1850 (for a while, poor living conditions characterizing early industrialization here halted the previous increase in life expectancy) to about 71 years by 1950, then showed little increase until the recent 2 decades with new life extensions from 75 to 81 years (Fig. 3.9). None of the changes correspond well with the changing amounts of money made available to the health sector, and in particular, the recent increase in life span has occurred in a period of declining health expenses (Fig. 3.5), suggesting lifestyle changes as a main cause (stopping smoking, eating less sugar and fat).
It thus appears that if health sector expenses contribute to increased life span, they do so by only 10–20%. The fact that citizens have a given length of life can be seen as an asset to society, and its valuation could be divided into the value of the work each member of society can provide (and this is already quantified in the discussion of education and shown in Fig. 3.10, so it should not be double-counted as health capital), and a value attributed to other aspects of a citizen’s life that may be termed contributions to social coherence. This again touches upon a discussion of the economic value of a human life that has been ongoing for a couple of decades.
In an effort to quantify externalities caused by pollutant emissions from power plants, the project ExternE of the European Commission (EC, 1995) used a value of a statistical life (VSL), lost due to adverse health effects outside the control of the victim, equal to €2.6 million in 1994 or about US$4.4 million in 2010. The basis for this highly uncertain value is a discussion of evidence for salary increases related to willingness to accept risky work, willingness to pay interviews and actual payments made to prolong life (antialcohol drugs, antismoking drugs, etc.). The most important determinant may well have been actual payments to victims of work-related deaths, such as the compensation paid by the French government to families of personnel dying while taking part in the Muroroa nuclear tests in the Pacific. In a discussion of these estimates, Sørensen (2011) first of all distinguishes between personal perceptions of the value of life, as revealed by life insurance payout and the indirect methods mentioned, and, on the other hand, the loss to society when a member accidentally dies. The societal definition should be used in economic discussions to avoid the criticism that losing a life has ethical dimensions that do not lend themselves easily to monetizing, and to some people should therefore not be discussed in prosaic terms.
The obvious loss to society when one of its members accidentally dies is losing the ability of that person to contribute work. This might be valued differently depending on whether the society has near full employment or not, but in any case, the average earning that a person dying at mid-life could otherwise have derived from working an average number of hours through a full life would be one quantifiable component of the VSL. Assuming an average 20 years of work lost at the time of premature death, this would, in the Danish case study, correspond to a value of about 4 million DKK§ for an average income earner, disregarding subsidy incomes (which society no longer have to pay after the person dies, cf. Figs 3.7, 3.8 and 3.10). It follows from this estimate, that the ExternE VSL comprises a substantial component of intangible values, for example attributed to the citizen’s contribution to social coherence, and perhaps also values reflecting ethical reasoning. The US Environmental Protection Agency has proposed a value of US$7.4 million in 2006 for a VSL in the United States (US EPA, 2015; Viscusi and Aldi, 2003), and notes the large differences between valuations in different parts of the world.
The valuation of VSL based on the loss of a member of society at mid-life would indicate that the total stock value of an entire human life, which to distinguish it from VSL may be termed SVL, the statistical value of a life, is about twice, that is the capital asset associated with a healthy member of society in the European framework is of the order of $9 million. The human asset provided by the Danish population of 5.6 million would thus be about 50,000 × 109 2010-DKK, from which the educational capital of 29,000 × 109 2010-DKK (Fig. 3.10) already counted should be subtracted. The resulting health asset would thus be about 21,000 × 109 2010-DKK (about 3,000 × 109 US$/cap.). Recent variations in the two components are included and shown in Fig. 3.10. In the context of the components of human capital discussed at the outset of Section 3.1.3, the educational component has been sorted out and estimated in isolation, whereas the life expectancy and SVL-based component combines health, educational and cultural contributions to the human capital. Subtracting the part connected with work ability, the remaining part is determined by the chosen magnitude of the SVL and further division specifying the role of culture versus general social coherence cannot be made. As mentioned earlier, significant contributions to literature, art, music and science are often beyond valuation, which in economic terms translates into a human heritage of a value that must be taken as infinite (putting in perspective political or religious extremists purposely destroying such assets).
3.1.3.3. Adding Up Wealth
Returning to the list of human assets or wealth listed in the beginning of Section 3.1.3, most of the natural assets (all types of land, sea and natural biota) should be accorded infinite value. As regards subsoil resources, depletable resources can be given a value, as it was done in the Danish case study for fossil fuels (Fig. 3.3), whereas others, such as clay, sand, gravel and stone, have a near-infinite value, partly because they may be reused and partly because—at least in the Danish context—they are renewed by rock withering and decay elsewhere, followed by sea transport to Danish shores. The produced assets are in principle much easier to list and valuate. The dominant component is buildings, as shown in Fig. 3.4. Net financial assets, comprising monetary instruments not already counted as representing physical assets (ie most stocks and bonds) minus debts, should be considered as assets. For Denmark, the net value is modest (Fig. 3.3). Finally, the human assets estimated in Fig. 3.10 round off the picture. They are considerably larger than the produced assets, which again are larger than the remaining valued components of wealth, but still one should keep in mind the infinite value of assets such as land, which have dropped outside the margins of these pages.
3.1.3.4. Inequality
Inequality in income has been monitored since the first publications around 1900 from Statistics Denmark and from similar agencies in other countries, sometimes condensing the data into a single number such as the Gini coefficient (Gini, 1912; partial English translation by Ceriani and Verme, 2012), and sometimes focusing on the disparate concentration of income in a small group of wealthy individuals within a country (e.g., Piketty and Saez, 2013, 2014), with particular focus on long time series of variations in the income share of such minorities groups. In the United States, the top earning 10% currently presently has a larger share in income than ever before, and in Europe one that has not been seen since 1939. Figs 3.11–3.13 show the family income distribution for Denmark in 2012, displayed in three different ways. The first just lists how many families have earnings in a given monetary interval, the second gives the share of total income for a certain fraction of the families, ordered from low to high earnings and the third arranges this material in terms of 10 equal-size family groups (deciles). Families are defined as groups of people living together in a household, including single individuals as well as couples with or without children, and income is derived from tax authority information, including all types of income, including government subsidies, but all before tax.
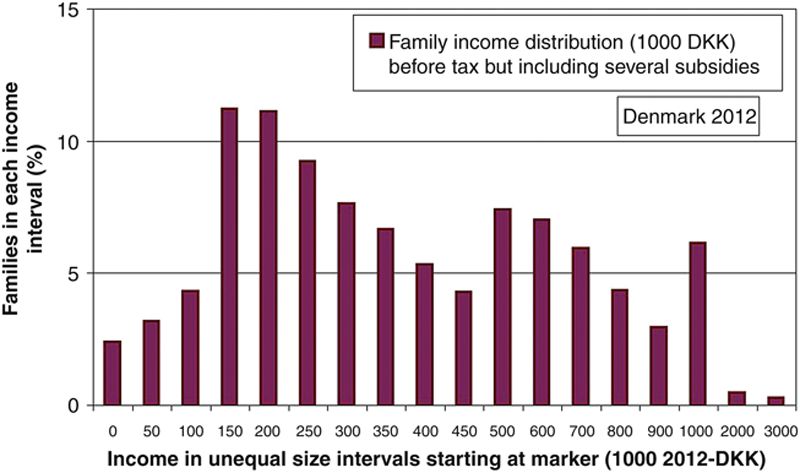
Figure 3.11 Distribution of Danish family incomes 2012, without subtraction of income tax but including both salaries, business surpluses, interest earned and income transferred from pension funds, insurances and public subsidy transfers.
The discontinuities at 500,000 and 1,000,000 DKK are mainly due to the change of scale (Statistics Denmark, 2014).
The discontinuities at 500,000 and 1,000,000 DKK are mainly due to the change of scale (Statistics Denmark, 2014).
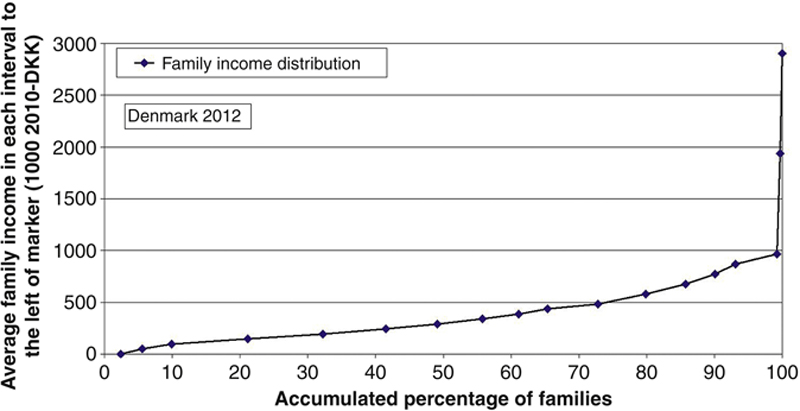
Figure 3.12 Distribution of Danish family incomes 2012, as in Fig. 3.11 but shown according to accumulated number of families instead of size of income.
The data points are again not equidistant (Statistics Denmark, 2014).
The data points are again not equidistant (Statistics Denmark, 2014).
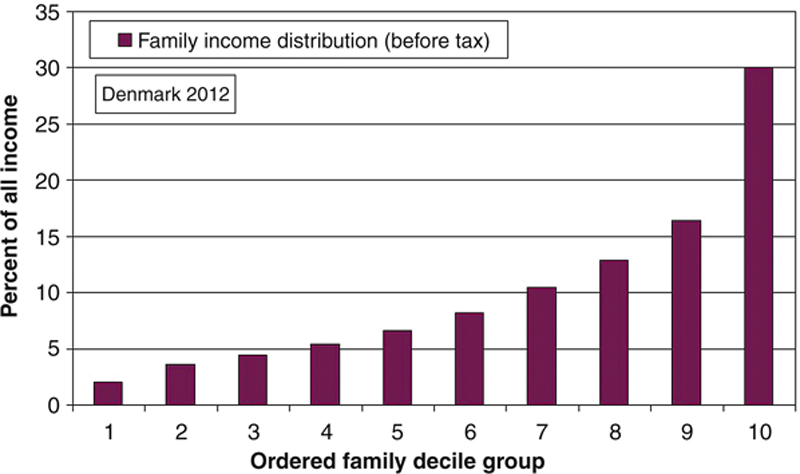
Figure 3.13 Distribution of Danish family incomes 2012, now presented as percentages of all incomes ordered according to equal family number segments (Statistics Denmark, 2014).
In view of the Danish introduction of the welfare economic paradigm during the 1930s, followed up after World War II and continually expanding until about 1990, where the neo-liberalistic paradigm took over, it is instructive to take a look at the changes in Danish income and wealth inequality over the 20th century. Fig. 3.14 looks at the income distributions during the two periods 1903–17 before the welfare economy introduction and 1933–36 during the actual introduction effort. Fig. 3.15 does the same for 1972 (at the end of an exceptional economic growth period), for 1996 (before the neo-liberal policies made much of an indent), as well as for 2012, where Denmark like other European countries is still struggling with the aftermath of the 2007 bubble economy crash. The early statistics (Fig. 3.14) did not employ the concept of a family but it also excluded married women and children below age 18 years, implying that the set of tax return respondents used by Statistics Denmark is fairly close to that designated as families in more recent statistics. The postwar practice (used for 1972 in Fig. 3.15) was to include independent taxpayers down to age 15 but to lump married couples and their children together, again effectively using a family or household concept and attributing most income to a ‘head of household’. Later, legislation aimed to limit underpaid child work, and the change in educational enrolment (Fig. 3.6), made the income from people below18 years become less important. As noted, the recent statistics just define families as groups of one or more people living together.
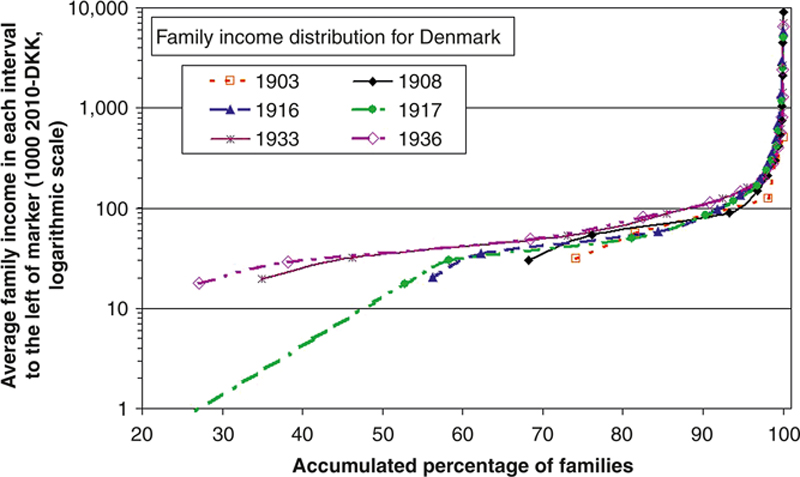
Figure 3.14 Family income distribution for Denmark for selected years between 1903 and 1936, shown according to accumulated percentage of families as in Fig. 3.12, but in fixed 2010 Danish Kroner (1 2010-DKK is roughly 0.2 2010-US $).
The statistical data collection did not during the period in question consider incomes below 800 DKK (around 40,000 2010-DKK), but Statistics Denmark did try to extrapolate the curve for 1917 downward, using the known number of families with no reported income at all, around 7%. The definition of a family is discussed in the text (Statistics Denmark, 1919, 1938).
The statistical data collection did not during the period in question consider incomes below 800 DKK (around 40,000 2010-DKK), but Statistics Denmark did try to extrapolate the curve for 1917 downward, using the known number of families with no reported income at all, around 7%. The definition of a family is discussed in the text (Statistics Denmark, 1919, 1938).
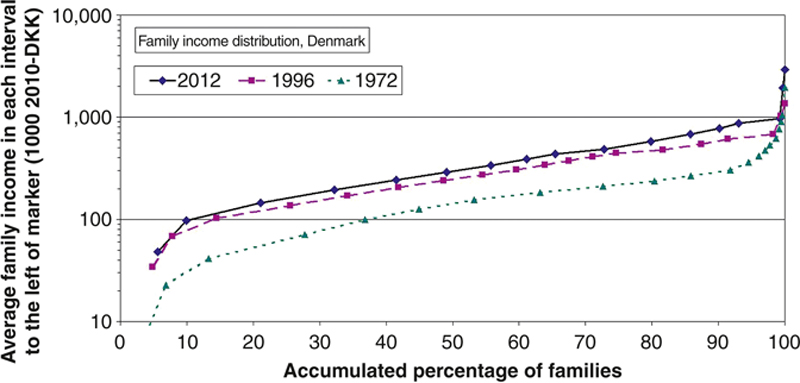
Figure 3.15 Family income distribution for Denmark for selected years between 1972 and 2012, shown according to accumulated percentage of families as in Fig. 3.12, but in fixed 2010 Danish Kroner (1 2010-DKK is roughly 0.2 2010-US $).
The definition of a family is discussed in the text (Statistics Denmark, 1975, 1998, 2014).
The definition of a family is discussed in the text (Statistics Denmark, 1975, 1998, 2014).
The early statistics (Fig. 3.14) shows a very large dispersal of incomes (note the logarithmic scale), particularly for the highest incomes, earned by the top 10 and top 2% of the accumulated families, where incomes are 10–100 times higher than at the 90% mark. The top-end inequality is diminished in the more recent data (Fig. 3.15), typically to less than a factor of five above the income at the 90% mark. Even the recent neo-liberal mantra of encouraging income differences has only produced a moderate increase in inequality, notably in the accumulation interval 80–98%, and still much less than for the period 1903–08. The achievements of the welfare economy are very clear in the 1972 data and persist to the 1996 situation. The entire curve is shifted upward except for the 92–98% accumulated family percentage interval, where the rise disappears, and furthermore, the percentage increase in income is consistently larger the lower the income is, down to the lowest incomes. The income redistribution policy of the welfare period has in this sense worked well up to 1996, but its original intent to reduce the disparity between the richest and the poorest to under a factor of three has certainly not been realized. The absolute income level in fixed prices indicated by the middle part of the distribution curve was largely unchanged between 1903 and 1936, but by 1972 has increased by more than a factor of three, and from 1972 to 2012 has further doubled. The reasons for the overall increase in income may well be global and local advances in (education-based) technology, but the advances with regard to equality are evidently caused by the redistribution policies of the welfare economy. The redistribution transfers significantly influence the incomes of the poorest and to some extent the richest families (as further discussed in connection with Fig. 3.16), and had redistributed income not been included in the figures, the curves would have been much more similar to those for 1903.
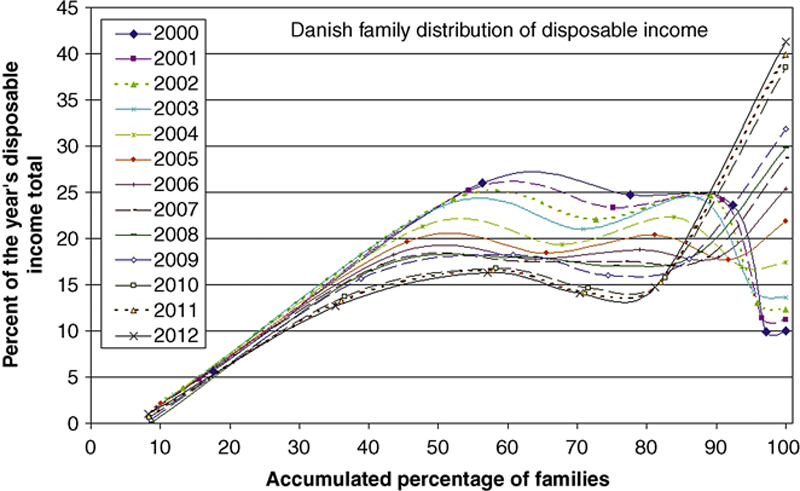
Figure 3.16 Recent developments in the family distribution of disposable income in Denmark (based on Statistics Denmark, 2015f). Disposable income is income after tax and interest payment, with a fictive value of housing rental added for house owners. The position of data points is moving between years, because Statistics Denmark uses the same income intervals for all years.
The early period depicted in Fig. 3.14 shows that the 1% of very rich families persists nearly unchanged from 1903 to 1938, but the income in the lower parts of the accumulated family distribution increases systematically, gradually diminishing the number of families at the lowest monitored income. Another change is a modest increase in income for the families in the accumulated 80–90% area, between 1908 and 1933. The deflator used to transform all incomes to the 2010 price level is the GNP-deflator after 1966 but the general consumer price index earlier. During the period where both are available, the difference between the two methods has been checked and found small enough to rarely make any noticeable change in the graphs.
One part of income redistribution is achieved by public subsidies, primarily to families of lower income, and it has been included in Figs 3.11–3.15. These transfer incomes amount to as much as half the income among citizens with only basic education, according to Figs 3.7 and 3.8. However, because the incomes are shown before tax, it is not disclosed where the subsidy money has come from. The welfare economy did base the transfers on a progressive tax rate, ensuring that the subsidies to the low-income groups were predominantly taken from the highest-income groups. Available data on taxation are for many of the early periods not ordered in the same way as income before tax and the available tax revenue data do not directly reflect redistribution of income because the tax money is used for many other purposes, including, for example infrastructure, schools and hospitals. In recent years, Statistics Denmark has tried to make the effect of redistribution stand out more clearly, by providing tables on a quantity called disposable income. It includes all income including subsidies, but subtracts income taxes (but not taxes on consumer goods), and it tries to compensate for the different monetary options of people owning their dwelling and those renting it. This is done by adding a fictive rental value for owned dwellings (a value already estimated by the tax authorities using it in connection with property tax calculations) and by further deducting the interest payments on real estate loans. However, as these are not separately known, instead all interest payments are deducted, for house owners as well as for renters. Fig. 3.16 shows the development of the Danish disposable family income from year 2000–12. There is an overall income growth in this period, but the curves have been normalized to the total disposable income for each year. The results indicate quite strikingly the transition from the preceding 70 years of welfare economy to a neo-liberal paradigm of rewarding the highest income earners. The top 3% of families by the year 2000 had a low share compared with the upper middle incomes, but by 2012 it has grown by a factor of four and much above that of the middle incomes. The middle-income groups are the losers in this development, while the low-income families are neither losing nor improving their shares of disposable income.
Inequality may be better described by wealth rather than running income. The distribution of assets provides a different and, in a sense, clearer display of the overall disparity between groups in a society or between different societies. On the other hand, data availability is often inferior to that of income, which most countries regularly monitor for taxation purposes. Several countries have abandoned general wealth tax (although still taxing possession of certain assets, such as land, buildings or stocks), so data series tend to be discontinuous and incomplete. In some countries, it has been possible to derive wealth information from assessments of death estates (Piketty et al., 2006).
In the case of Denmark, some data are generally available up to 1996 because tax returns had to specify wealth, but this disappeared from 1997 when wealth taxation was abandoned. Later accounts only cover real estate and stock holdings, toward which taxes were still levied, and most of the wealth connected with those individuals having a personal business is no longer recorded. However, also in 1996 and earlier, the statistics are incomplete. Funds bound in pension and life insurance schemes for later payments were not included (but estimates such as the one in Fig. 3.3 are available) and neither were equipment, furniture, art or antiquities in family possession. Figs 3.17 and 3.18 gives the estimated distributions of Danish wealth during the early and late 20th century, plus a partial estimate for 2005.
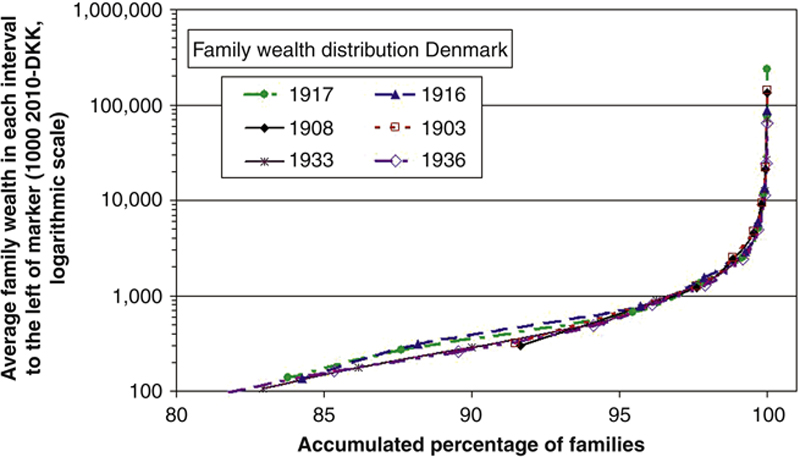
Figure 3.17 Distribution of Danish family wealth in selected years from 1903 to 1936 (Statistics Denmark, 1919, 1938).

Figure 3.18 Distribution of Danish family wealth in selected years from 1972 to 2005 (Statistics Denmark, 1975, 1998, 2007; note negative values for 1996 and 2005).
The curves for selected years 1903–36 in Fig. 3.17 are remarkably similar for the most wealthy 4% of the families. Although wealth data below 400 2010-DKK were not collected in 1903, the slope of the curve indicates that little wealth was bestowed on the lower 85% of the families. By 1917, the curve reaches down to the 80% ordered and accumulated level, and although the top wealth is not significantly changed, the 85–96% accumulated family interval enjoys increased wealth. A major reason was the ‘new-rich’ strata of shady Danish businessmen, who profited from selling subquality canned food to consumers in the World War I-fighting European countries. After the war, many such businesses went bankrupt and took a large Danish bank down with them (Sørensen, 2012). The curves for the 1930s are much more similar to the 1903–08 curves than to those of the intermediary period, except that the peak wealth has dropped from above 100 million 2010-DKK to 30–60 million 2010-DKK. The explanation is the financial crises of 1930, which as seen took at least the wealth part of the Danish economy 30 years back.
Moving to the post–World War II period in Fig. 3.18, the 80–90% family interval in 1972 is not much changed relative to the prewar data, but the top wealth is reduced and the trend of increasing wealth extended to the lower parts of the distribution is continued. By 1996, the 72–98% family interval has gained wealth, the top wealth is a bit reduced, but first of all the wealth for the entire lower 72% of families is dramatically lowered. The data for 1996 and the partial data for 2005 show a new phenomenon of substantial negative wealth. This has become possible due to increased options for creating debt. By 1972 the Danish real estate financing institutions could only offer a loan of up to 80% of the estimated value of an owned dwelling (with associated land). Banks could provide further loans, but were very restrictive if no collateral security could be offered. People living in rented apartments had even fewer options for obtaining loans. The energy supply crisis in 1973/74 brought about the decision to allow loans in excess of the 80% limit for energy related building improvements, and during the 1990s, loans were generally offered without much consideration of collateral security, only with an appraisal of annual income. This continued into the following century, helped by the conviction that full employment was permanent and by a 2002 government decision to reduce real estate taxation, which caused house prices to skyrocket and gave the impression that house owners had plenty of collateral. One reason behind the old 80% limit had been a belief that house prices could fluctuate over time, but this seemed forgotten after year 2000, until the housing bubble burst in 2007 and brought house prices down by at least 12%.** However, Statistics Denmark has found that nearly half the negative wealth segment in Fig. 3.18 represents families not owning their dwelling. In both the house-owning and nonowning section, the financial crisis that began in 2007 created many bad-loan cases, due to loss of job or other loss of income, and several major Danish banks would have become insolvent had the government not decided to bail them out. Nationalizing the banking sector was not discussed and no conditions were set for the banks’ future handling of loans. The banks responded by doubling the management salaries, seemingly using a neo-liberal style argument that the banks might have acted less foolishly if the bank management had been better paid. In any case, Fig. 3.18 shows that 45% of Danish families had a negative wealth in 1996, and 39% in 2005. The omitted contributions to the 2005 wealth data imply that the data points should be moved upward, so a comparison with earlier years is not meaningful. For all the years considered, the wealth disparity has been similar to or larger than the disparity in incomes.
3.1.4. Buying and Selling Goods
The current setup for trading at the consumer level involves a commercial sector acquiring materials or other goods from wholesale distributors, import businesses or directly from manufacturers, and selling them to individuals through a web of retail outlets, physically strategically located or selling through Internet sites with postal or parcel services taking care of delivery. Central in the approach to buyers is massive advertising through a variety of media, with advertising costs typically in the range of 5–50% of the sale price. Goods may be categorized as daily needs, such as primarily food and hygiene items, intermediate duration merchandise such as clothes, batteries, garden plants or toys and more durable consumer items such as computers, bicycles, refrigerators and cars. Typical lifetimes for the three roughly defined categories are weeks, months to years and 15–25 years. This raises the question of what type of insurance the manufacturer and seller should be obliged to offer, as regards quality, functionality during the expected lifetime and provisions for repair and end-of-life handling.
Current legislation differs from country to country, but usually includes a codex for sober information before purchase, a declaration of the ingredients of the item sold, and a warranty typically much shorter than the expected product life. A few manufacturers offer better than legally required guarantees, such as 5–10 years for computer hard disks, automobiles and furniture. As regards ‘sober information’, most advertisements leave much to be desired, giving no serious information at all or giving misleading information by focusing on positive properties of the product in question but not mentioning areas where the product falls short of other products serving the same purpose. Certain software companies have tried to avoid the consumer legislation valid in some countries by stating that they do not sell their products but only lease them and therefore are not bound by consumer legislation (because consumer legislation in most countries do not deal with leasing, assumed to be of interest only for arrangements between companies).
From a resource and energy perspective, the current situation also leaves much to be desired. Unnecessary short lifetime of many products, as well as poor design with respect to ease of disassembly for reuse and recycling entails a greater-than-necessary resource and energy usage, forcing consumers to buy several consecutive products for the same purpose over a time period where one decent product would have sufficed. Not designing the products for reuse means that disposal options fall back to incineration, which usually limits recycling to certain metals. A slight concern for the environmental issues would lead to the requirements that customers are fully informed not only about the lifetime of a given product, but also is told where it stands compared with optimal products serving the same purpose. More serious concern would lead to a requirement of specific legislation governing lifetime, resource and energy use by the manufacturer and user, as well as a warranty obligation extending throughout the lifetime of the product under specified conditions of use. Isolated legislation along such lines is in place in some countries, for example for building shell–heat losses of new buildings, and in other countries it is approached by providing an open rating system for voluntary consideration at consumer purchase decisions. In Europe, this has, for example led to several classes of refrigerators no longer being produced because consumers always bought those in the top one or two energy rated classes. For cars, this rating system has led to a clear division of consumers into two groups, with one going for the best energy efficiency cars on the market, while the other group intentionally buys the least efficient vehicles, in order to exhibit their indifference to resource and environmental concerns.
A progressive list of measures for improving the situation would start with expanding the rules for declaring ingredients used in the product. The present full declarations required for food products should be used for all products that may be associated with human intake, such as lotions and other cosmetics applied to human skin and nearly all being internalized by absorption through the skin. The explosive rate of adding chemical substances to products that may consequently be harmful to humans would indicate the advantage of working with a fixed ‘positive list’ of allowed substances having undergone long-term testing. Consumers should also know the expected lifetime and the environmental and energy consumption characteristics of each product before purchase, meaning that all products offered for sale to consumers should have undergone a certified life-cycle analysis.
It would seem that current advertising is a poor way of communicating between sellers and buyers. Instead of praising one product over similar ones, the customers would be much better advised by having access to a searchable database where different offerings for each kind of product can be compared on an objective basis, as regards all the concerns mentioned earlier. Some such databases are already available on the Internet for a number of product groups, but they are commercial and would need certification from an independent overseer, such as a government committee operating in full openness. The manufacturers would of course have to pay a standard fee for having their products included in the database, but this would normally be considerable less than the current advertising costs. As it is not in any society’s interest that people buy products they do not need or flawed products, a general prohibition of all advertising would contribute to heightening the quality of commerce and in consequence the welfare of consumers. An overseeing institution can handle disputes over the correctness of database information offered. Prices may go down as the advertising costs are avoided, and eliminating the dishonest manufacturers and sellers is also a positive move.
The end-of-life handling of products is another area where legislation may be necessary. In Germany a lively debate took place during the 1990s, suggesting that manufacturers reduced the number of components in their products and designed them to be easy to disassemble for reuse or recycling of components, and that manufacturers should be compelled to take the decommissioned product back for reuse/recycling after its service life. Several industrial companies expressed their sympathy with the idea, noting that, for example a car door in the past contained several hundred components, but that a better design would greatly diminish the number of components and make it easier to treat after its service life, particularly for the company that had manufactured the product in the first place. Some industries went along this way, for example by standardizing components so that all cars manufactured by a given company had the same door handles and other components that offered themselves to standardization across model variants. Unfortunately, this debate never went further, indicating that such requirements should rather be made compulsory, so that they impose the same requirements for all manufacturers and thus do not affect competitiveness among industries that know their business.
Legislative requirements of this type should not discourage small manufacturers. This would be avoided if insurance type schemes were available to rescue industries not having an internal economic capacity to absorb occasional mistakes.
Provided that leasing or rental access to consumer products are subjected to the same rules as purchased products, many consumer products (and in particular those of longer lifetimes) could be offered for rental rather than ownership, making it even more natural that the manufacturer assumes the responsibility to ensure the proper functioning of the product through its working life as well as in the disposal phase by taking the product back for proper treatment or disposal. If computer software manufacturers continue to insist that they only lease their products to consumers, it is even more important that the consumer protection legislation is the same for leasing and purchase, so that consumers are not buying deeply flawed software that the manufacturer expects to improve by frequent updates†† as the consumers identify the flaws.
This would also eliminate the discussions of guarantee periods, because warranties would effectively be for the entire product life. If purchase and change of ownership is the preferred way of handling commerce, the warranty rules will have to be changed in such a way that guarantees against manufacturing flaws prevail throughout the product life, while maintenance and wear during use is accepted by the customer, but on conditions that the need for and extent of these have been clearly communicated before purchase.
Following these simple rules will make significant contributions to improved resource and energy usage and will at most affect the general welfare in a positive fashion. Losers are in principle only businesses purposely wanting to cheat the people who buy their products. However, the suggestions will also affect the current practice of having consumer items manufactured in developing countries with low salaries, claiming that in exchange for a poorer quality and low product lifetime, one helps these countries develop. This is false for two reasons. First of all, intercontinental shipping of consumer products appears feasible only due to the current low cost of oil for (mainly ocean) transport,‡‡ and secondly, only false advertising can influence consumers to think that buying five successive short-lived products made in an underdeveloped country is cheaper than buying one properly crafted product with the best lifetime possible and thus the smallest resource use, environmental impact and energy use. These remarks do not mean that international assistance cannot help to rapidly develop less developed regions. The requirements are to improve local education and offer initial design assistance from advanced countries, a method that has produced successful results notably in China, but along with other local product manufacture characterized by all the negative lifetime and quality issues mentioned.
3.1.5. Work Versus Meaningful Activities
The concept of work plays a large role in present societies because nearly all components of welfare have been monetized and are therefore only accessible to people who possess money. As seen from the case study in Section 3.1.3, very few people today have access to money unless they have a paid job or a personal business. For this reason work is considered essential and most people will accept much to keep this source of income. That has not always been so. Work is really a fairly new invention, introduced in connection with the Scottish industrialization during the 18th century (Anthony, 1977). Of course, toil had been common long before that, in order to provide the necessities of life or build defence walls as slaves for some king or emperor, but the philosophy of labor changed. Once, village societies had provided the necessary food and assets by just a few hours of daily activity, integrated into a meaningful life with time for leisure and enjoyment (Lee, 1979; Wiessner, 2002). Early city states, for example in Mesopotamia or Egypt, had organized division of tasks between classes of citizens, including forced labor, and similar arrangements are found all the way through history, to Medieval, Renaissance and Enlightening Periods. However, the introduction of factory work required new types of coercion because instead of persons determining the pace of labor activities they were now being dictated by the machines. Because investment in machines was seen as high compared with worker’s salaries, pauses were no longer allowed and work in shifts was introduced. In order to help gaining acceptance for this new order of labor, the Protestant Church was very helpful by declaring that ‘idleness is a sin’. Much has changed since the early industrialization, and studies have been made concluding that continuous work is not optimal for productivity, just as many societies have reduced the number of working hours in order to leave more time for social life (and of course to create more demand for the products of industrial machinery). Still, there is disagreement between those who think that the cake (total output) has to grow in order that the workers can get a modest salary rise aimed to prevent rebellion, and those who favor a redistribution of wealth, in order to possibly remove the need for a constantly rising growth and its negative effects on resources and environment (Illich, 1978; Gemynthe, 1998; Sørensen, 2014, Chapter 12).
In a more concrete way, it is proposed that the time has come to replace ‘work’ by ‘meaningful activities’, or rather to return to it (focusing on those activities of the past that made sense and gave satisfaction, as opposed to slavery). The implication is that anyone should have both an understanding of why a given job has to be performed and an acceptance of being the right person for the job. This means that society should be clearer in defining what has to be done in the interest of common welfare, and that education should be offered to make sure that each citizen can appreciate the job he or she is asked to perform and can do it well. In a way, elements of this attitude to the activities by which we earn our living can be seen in many current societies. Many people perform their work ‘con amore’, being satisfied with what they contribute, not caring too much of how long time it takes to finish the job or if the salary/income is a bit higher or a bit lower than that of the person next door. The problem is that a large portion of current work serves purposes that do not contribute to common welfare.
One possibility is to get rid of the concept of ‘working hours’. The transitions that have taken place in many societies over the recent decades have removed much factory work (that could be further made superfluous by increased use of robot technology, leaving only a few operator and supervision employees, similar to what is seen, e.g., in the electric utility sector). In fact, many jobs need not have the employee come to a particular workplace (with negative implication for transportation energy and time use), but could be performed from where the person happens to be. Some people today oppose ‘home work’ because they say that it blurs the distinction between work and leisure time. But this may well be desirable and something one should work toward, along with redefining work as meaningful activity and eliminating current work types no longer seen as meaningful. There are jobs today that cannot immediately be ‘flexed”, such as those of bus and train drivers, power line maintenance units, hospitals and other medical assistance. However, even some such activities might in the near future become much more flexible: vehicle systems may be (and some already are) driverless with use of techniques such as computerized collision avoidance systems, education need not take place in a classroom but can proceed via telecommunication through phone or computer media. Still, there will be medical and social job functions, plus some management and supervision jobs that need to have personnel available at all times, but the ‘meaningful activity’ paradigm also assumes that everybody understands that there are such needs and are willing to undertake them in a planned combination with leisure and other activities.
In any case, a gradual transition to a society with emphasis on meaningful activities will impose many conditions on the technology and social arrangements that will best facilitate the new structure. Current waste of time and resources on commuting can be largely avoided, as can many sales activities such as shopping, that to a large extent needs no supermarkets or retail shops, but only an optimized system for transportation of goods. Similarly, service jobs are not optimized by the current setup of traveling craftsmen, and building and other construction activities are often made in ways that increase work as well as cost more than needed. If such activities are conducted under a system of fixed price and quality guarantee, for example by creating a public company with optimal cost structure, then free competition from any number of private small or large companies can be accepted without risking ending in permanent high-cost markets such as is often the case now. Evidently, setting up such public/private competition is only one suggestion of how the present inflexibilities of purely private building and repair sectors can be avoided.
3.1.6. Tolerance and Multiple Solutions
The last remarks in Section 3.1.5 are examples of the principle of not necessarily choosing a single solution, but to allow different solutions to coexist side by side. The world has seen centralized communism and neo-liberalism fail (the latter unfortunately unnoticed by quite many people), and any proposed ‘third way’ may well with time similarly lose its attraction. The idea of creating a system that allows different paradigms to live together in peace may be a better solution. It requires tolerance from each of the coexisting schemes, but this is precisely the quality that has to prevail in any functioning society, so it is not a bad thing to make it stand out as a fundamental condition. This is obvious if one looks at the causes for conflict in the past. Tolerance toward different views on religious matters, on social setup and interhuman interactions must be introduced and generally accepted if we are to avoid new conflicts based on fundamentalist views on how other people ought to behave. Tolerance must be part of our upbringing of children, which clearly means that parents cannot be allowed to transmit their prejudices to the children. This is one basic condition for improving the lot of our societies and will therefore have to be incorporated in the fundamental rules of human societies. How to approach that is the subject of the following sections.
3.2. How to formulate constitutions
Constitutions should deal with fundamental conditions for living in a society and leave debatable issues to daily political deliberations, restricting the constitutional text to setting the general frame for political debate and resolutions. The main text of a constitution would therefore be the formulation of basic human rights and duties in the context of the structure and maturity of the society in question, as well as defining the type of governance that should be used to ensure compliance with and further development under the set rules. Section 2.3.1 gave the UN’s bid for formulating a basic set of human rights, and Section 2.3.2 outlined governance schemes currently employed. This chapter will discuss ways that have been suggested as well as new ways of tackling the problem of governing a society, and will also question if the division of societies into national states is the best way of achieving societies that function in accordance with the human rights and duties accepted.
Some current constitutions go further than stating human rights and frameworks for making political decisions and ensuring that citizens comply with both, in that they also favor specific economic, religious or other social paradigms. Examples of this are both in constitutions and the UN set of human rights that include ‘property rights’ and ‘inheritance rights’, and also ‘enrolment in a specific religious institution’ (Section 2.3.1, in the list of basic human rights and duties). By doing this, the constitution of course loses some of its fundamental standing and become a vehicle for conflict, inside the society as well as in relation to other societies with possibly different paradigms in their constitutions. Stating basic human rights in a constitution has therefore historically not prevented ferocious wars and crusades aimed to remove those thinking differently from the surface of the Earth.
Before going systematically into the range of issues involved in writing alternative constitutions, a few remarks will be made on the role of economic paradigms in defining the rules by which societies operate. Some of these have already been introduced in Chapter 2. On one side there are the neo-liberalists, who claim that although the conditions shown by Adam Smith to have to be fulfilled for classical liberalism to work are far from fulfilled in any current society, the ‘market knows best’ paradigm may still work, and at least it helps increase inequality, which they believe is a desirable trait because it favors indiscriminate economic growth as defined by the GNP. On the other side stands the remains of the socialist movement, which has lost lots of appeal after the successful media campaign staged by the liberals, claiming that the fall of the centralized oligarchic rule in the Soviet Union was the end of socialism. It may be instructive to attempt an objective assessment of how these two paradigms stand in current national societies.
As said, neo-liberalism aims to maximize inequality. Studies such as the Danish case study described in connection with Figs 3.11–3.18 shows that inequality has indeed increased during the last 10–20 years, but is still much less than in the early 20th century. The 10–99% interval of the income-ordered families have been in a relatively stable situation for several decades, although with an education-related inequality of a factor of 10, but tax-financed redistribution of income has rendered the lot of the lower range of families tolerable. The neo-liberal politics that took over from the 1990s caused this to change from around 2005 (Fig. 3.16), but the relative loss by the middle incomes have been hidden for those involved by the overall growth in incomes (Fig. 3.15). The situation in several other countries have been similar, independent of whether they have gone through a period of ‘welfare economy’ or not, but the level of inequality at the top differs and is quite high for countries such as the United States (Ohlsson et al., 2006). In other words, many societies have developed in the direction of less social solidarity as regards equality but at least a desire to remove beggars from the gutter.
It must be realized that true neo-liberalists are not unhappy about the recurrent financial crises inherent in the capitalist paradigm. These offer great opportunities for the rich to make lots of additional money, for example by intelligent buying and selling of shares. It is only the ‘common people’ that suffer from destruction of welfare by each crisis.
Taking a look at the fate of the variant of socialism called ‘communism’, in its original form, one may turn to the manifest written by Marx and Engels (1848), which can be summarized as follows:
1. Abolish property rights to land.
2. Use progressive income taxation.
3. Abolish inheritance.
4. Allow only state banks to issue loans.
5. Strategic sectors such as communication and transportation should be operated by the state.
6. Make the state in charge of agricultural and industrial production.
7. Equal liability of labor (put agriculture and industry workers on the same footing).
8. Gradually decentralize settlements.
9. Abolish child labor.
10. Make primary education free and leave further education to industry.
The manifest contains blatant criticism of socialist movements outside Germany, such as the French with their preoccupation with literary beauty and Proudhon’s acceptance of modern technology, as well as the British bourgeoisie criticism seen as restricted to administrative adjustments. As Marx and Engels see it, only armed revolution can put the proletariat in power. Poor treatment of women in factories is briefly touched upon, but there is no word on free medical care or other social security reforms advocated by the other socialists. To Marx and Engels there are only two classes: workers and bourgeoisie, and all other socialist ideas aim to eliminate workers by lifting them to bourgeoisie status. Marxism offers no explanation of why it is important to preserve a class of workers with only primary school education, and if these workers take over the means of production, it is difficult to see the possibility of any improvement in outdated and polluting technology, a fear that has been fully borne out by the Chinese ‘Cultural Revolution’.
Looking at the points listed earlier, the second (progressive taxation) has gained universal acceptance, albeit with different severity, the strategic sector ideas in point 5 was pursued in several countries before the privatization wave of neoliberalism and reducing child work and making primary education free (points 9 and 10) have been accepted in large parts of the world. The other points have not been supported, except that state-operated industries and agriculture have been tried for a while in the Soviet Union and China but subsequently given up. The top-end income and wealth disparity mapped in the preceding section may remain a problem today, but the number of people in the extreme top-segment seems too small to warrant upholding the notion of a classical class society. If the distribution problem finds a solution, it is thus unlikely to be by revolutionary fights between 98% of the population and the last 2%.
One dogma shared by Marxism and capitalism is the faith in economic growth. The difference has been in choosing the distribution of proceeds between workers and owners or investors. In capitalist theory the production factors are monetary inputs (investments), means of production (tools, machinery and intellectual input including but not limited to patents) and labor input. They share the profit in some proportion, determined by the owners or open to negotiation in countries with bargaining systems implemented, and in recent times occasionally regulated by public law, such as by setting minimum wages. Investors/owners tend to have more influence than other production factors, and in particular much more than the essential input from the inventors of desirable products and suitable production processes. In Marxist theory, the owners are replaced by the state, and the investment in means of production (based on an overall plan made by the state) is not accorded any share of the profit at all, implying that any increase in profit derived from improvements of technology is supposed to be given to the workers (although they did not have the skills to contribute to the technological advance).§§ If a robot can do the work of 100 human workers, the one worker operating it would in principle earn 100 times more profit (which, of course, did not happen in actual communist societies). Marx was wrong in giving the profits from new technology to the workers, but capitalism was equally wrong in giving them to investors that also make no important contribution, but just hope to make their wealth, often acquired by inheritance, grow further.
By the latter part of the 19th century, the international socialist movement was much more inclined to follow Mikhail Bakunin (1814–1876) than his opponent Karl Marx, caught in making false accusations accusing Bakunin of being an imperial agent (Wikipedia, 2015a). Bakunin (1882) was anarchist in the spirit of his friend Proudhon and he rejected all authorities, including churches, social classes and Marx’s ‘dictatorship of the proletariat’, which he (correctly) predicted would soon become more authoritarian than the regime of the Russian Czar, in favor of total individual freedom. His idea of self-governing communes was implemented by the noncommunist but short-lived Paris Commune formed in 1871. The rejection of any hierarchical social organization may sound as relying on direct democracy, but Bakunin was never able to clarify who should see to the implementation of decisions taken by individuals on matters affecting more than themselves.
The revolutionary socialist parties formed in several countries around 1900 were challenged by the more moderate Social Democratic parties, notably the French ‘Socialist Party’ led by Jean Jaurès from 1902 and advocating a program formulated at a congress in Tours, comprising
1. General elections for parliament (all citizens can vote) based on lists of candidates (not parties)
2. Direct democracy (referenda) used for important decisions
3. Freedom of the press
4. Equal rights for women and men
5. Administrative freedom for local governments
6. Separation of church and state
7. Churches and other congregations may not interfere in politics
8. Legal council and representation should be free
9. Abolish the death penalty
10. Make all courts civil, no military courts
All of these points can at present be found in constitutions of many advanced democracies, and most them have been generally accepted as desirable anywhere. Jaurés was assassinated in 1914 for his antimilitary views, and the nationalization intents of the 1902 congress drowned in conflicts between French socialist fractions and the charismatic political rhetoric of Georges Clemenceau, representing the Radical Party (Orth, 1913; Wikipedia, 2015b). The specific welfare variety of the Social Democratic paradigm, which was subsequently developed in the Nordic countries, has already been described in Section 2.3.3, because it has been an actually implemented form of governance starting at the time of the 1929–30 economic crisis and still partially remaining, and with several elements copied to other, mostly European countries.
The following sections will discuss further ideas for remedying the problems in the current political paradigms, of which the inequality discussed in Section 3.1.3 is an essential part. A general remedy of course remains using progressive taxation of income and wealth, combined with assistance to low-income groups, as discussed in the Section 3.1.3 case study in terms of redistribution, but even the fairly aggressive redistribution of the early Danish welfare economy is seen not to remove the advantage of the top-incomes and top-wealth segments, due to the Social Democratic promise not to interfere with the private sector entrepreneurship in general. One must therefore be wary of proposals to solve the inequality problem by taxation without fundamental change in the underlying economic paradigm (e.g., Piketty, 2014).
3.2.1. From Ancient Greece to Revolutionary France and Liberal USA
The rulers of the Greek city states were quite aware, in 7th century bc,*** that states could be ruled by one person, by a small group of persons or by many persons, and writing down the preferred rules in constitutions was not at all foreign to them (including the first known practice of voting; Larsen, 1949). What happened over the following two to three centuries was that more and more governance concepts resembling those we use today were discussed and sometimes introduced. The first significant step forward was made by Solon (638–558 bc) in the city state of Athens (including the surroundings of the city). He forbade using children as collateral for loans, freed existing slaves and extended the previous administration by noblemen selected among themselves to comprise all (male) citizens, now eligible for an assembly responsible for legislation (but still based on proposals by the much smaller council of upper class citizens), and for justice through a new court where any male citizen could be called to sit in a jury. Lottery-style selection for office was used. Surviving poems by Solon exhibit a humanistic inclination, expressing contempt for the greed of many Athenians (Hansen, 1989). Legislation was introduced to limit dowries and inheritance, but after Solon’s retirement, many of his reforms were abandoned, eventually leading to new dictatorial rule by a ‘tyrant’.
After the collapse of the reign of a sequence of tyrants, two men wanted to rule Athens. The initially preferred candidate exiled hundreds of citizens in order to rob them of their property, and a revolt by the city and its council ousted him and recalled the second candidate, Cleisthenes, who in 508–507 bc reorganized the various assemblies and courts in order to make them better reflect the composition of the city’s inhabitants. In particular, the basic constituencies (tribes) were redefined to better reflect common interests and avoid quarrels. Proposing new laws remained the task of the ‘upper house’ council, as under Solon, but the main assembly, not formed by elections but by willingness to appear, convened up to 40 times a year and could pass as well as reject proposed legislation. The lottery was still in use for selecting administrators, but in case of the council partially ceded to elections by the assembly (Aristotle, 328 bc). Cleisthenes may have increased equality before the law, but he also allowed an assembly majority to exile citizens they did not like, with very vague charges.
Solon and Cleisthenes were rulers who wanted to consider the opinions of a wider part of the population, through staged assemblies for the different strata of society. Similar ‘enlightened’ autocrats are known throughout history in all parts of the world. Actually passing concrete power to the Athenian people still lacked an underlying framework (such as a declaration of human rights), and providing the assembly with the direct power to exile enemies is a clear example of the dangers of ill-prepared approaches to rights and duties in a democracy.
The next step in Athens’ development toward a direct democracy was taken under the leadership of Pericles (495–429 bc). He furthered the ongoing process of strengthening the power of the courts over the assembly, and removed much of the remaining power vested with the council, with help from his friend Ephialtes. He had no reservation to using the existing law to have the assembly exile two of his worst political opponent. The ruling ‘office of the strategos’ had 10 elected members of which he was only one. Thus he ruled as long as he was looked up to and things changed toward the end of his life. Pericles’ views are primarily known through a speech he made in the winter 431/430 for the victims of the Peloponnesian War, recorded by the historian Thucydides (431 bc). Pericles expresses the view that Athens is the most advanced democracy of its time, expressing its merits in this way.
Our constitution does not copy the laws of neighboring states; we are rather a pattern to others than imitators ourselves. Its administration favors the many instead of the few; this is why it is called a democracy. If we look to the laws, they afford equal justice to all in their private differences; if no social standing, advancement in public life falls to reputation for capacity, class considerations not being allowed to interfere with merit; nor again does poverty bar the way, if a man is able to serve the state, he is not hindered by the obscurity of his condition. The freedom, which we enjoy in our government, extends also to our ordinary life. There, far from exercising a jealous surveillance over each other, we do not feel called upon to be angry with our neighbor for doing what he likes, or even to indulge in those injurious looks, which cannot fail to be offensive, although they inflict no positive penalty. But all this ease in our private relations does not make us lawless as citizens. Against this fear is our chief safeguard, teaching us to obey the magistrates and the laws, particularly such as regard the protection of the injured, whether they are actually on the statute book, or belong to that code which, although unwritten, yet cannot be broken without acknowledged disgrace.
The part of the speech claiming that Athenians could treat their differences in an urban way does not seem to agree with actual events, such as the exiling manoeuvres and perhaps the fact that the assembly on more than one occasion tried Pericles himself under a variety of accusations and fined him substantial sums. He died in a devastating plague epidemic, and left an Athens subject to increasingly errant governance (Aristotle, 328 bc).
The dominating role of the assembly increasingly took the form of mob rule. A failed assault on Sicily and new attacks from another city state, Sparta, added to destabilization. In 406 bc 10 generals (including Pericles’ son) managed to save Athens and its grain import by winning the naval battle at Arginusae. However, on return they were sentenced to death and executed by the assembly, on a charge of not having picked up survivors in the water. The assembly was here in violation of three provisions of the constitution: the judging was made by the assembly without involving the courts, the generals were sentenced collectively and not individually as required by the constitution and the accused were not allowed to defend themselves. Furthermore, attempts by citizens to use their right to question the decision of the assembly were rejected with threats of death penalty. A similar death sentence by the assembly befell the philosopher Socrates in 399 bc (Lewis, 2011).
These events had a profound influence on the philosopher Plato’s view on the Athenian democracy. Plato (c.424–347 bc) saw democracy as the worst kind of governance, which could only lead to collapse and take-over by a tyrant (dictator). Instead, he suggested that governments should be led by philosophers (such as himself), and that the administrators (guardians) of the state were free to lie and break the law as long as it benefitted the state (current politicians would have loved him!). On the other hand, they should not own personal property and they should live in forced marriages and have their children removed to some remote countryside (an idea later reused by Mao in China). The general population exists only to serve the state. He uses an elegant, albeit increasingly monotonous, literary style, in which he puts his words in the mouth of the late Socrates and his friends, assembling regularly to get drunk and discuss politics (Plato, 380 bc, 345 bc; Hansen, 2013a).
After the massive failures of Athens, militarily and constitutionally, the democracy is revived in a milder form by introducing a number of restrictions, notably restoring the role of the judiciary system and giving the council a little more to say (Hansen, 1999). Also around 400 bc, the assembly attendance is rewarded by a pay, like the one Pericles had introduced earlier (about 450 bc) for jurors, administrators and council members. The public service payment was financed, first by voluntary contributions from wealthy citizens, and later by taxing all persons possessing wealth. This created an income redistribution contributing positively to furthering equality in the city state (Lyttkens, 1994, 2010).
Plato’s pupil Aristotle (384–322 bc) observed the 3rd century bc adaptation process of Athenian democracy and, in contrast to his teacher, concluded that democracy could be made to work and in that case would be one of the best choices of constitution, at least for the city state that was his prime interest. He does not exclude the possibility of gaining stability by mixing oligarchy and democracy, and like Plato he finds it necessary that children receive a uniform public education, rather than being influenced by their parents. To define ‘best choice’, he used a measuring stick of welfare, which he denoted ‘happiness’ (Aristotle, 326 bc; Hansen, 2013b). Aristotle was not only a philosopher but also a broadly oriented interdisciplinary scientist, making contributions to several different fields. As a general comment to Aristotle’s Politics and the Athenian constitutions, Rubin (2001) notes that Aristotle is very clear on stating that electing rulers and legislators by lottery and limiting the time a person can sit in office is democracy, but representative elections by vote is oligarchy. The city state Sparta (in perpetual conflict with Athens), where all offices are filled by election is thus an oligarchy, despite its egalitarian law that all citizens should wear similar clothes and eat the same food, and so would any present nation be, despite our flirting with the name democracy.
After the Athenian democracy is nullified following another military defeat in 322 bc, not much was heard about democracy until the 13th century, and even then only sporadically, in connection with minor autonomous areas in Europe. An exception is the Roman writer Cicero’s reiteration of the constitutional questions raised by Plato and Aristotle. Cicero (54 bc) comes out in preference of monarchy but is willing to accept some features of other governance forms. The actual constitutional basis of the Roman Republic was first a kind of direct democracy (by popular assemblies and more restricted councils), which elected magistrates running the passing of legislation, the courts and the military activities. Later, the imperial Rome was ruled by dictators conferring with various representative bodies (Wikipedia, 2015c). The ‘things’ of the North European Viking period around 900 were probably no more than councils in which the leader conferred with or was elected by important landowners and warlords (Sørensen, 2011). William of Moerbeke’s translation to Latin of Aristotle’s Politics appeared around 1260 (Bolgar, 1958) and in 1291, the three autonomous Swiss regions (cantons) Schwyz, Unterwalden and Uri instituted a federation with elements of direct democracy, which later developed into the present Swiss Federation. Already before signing the 1291 treaty, the three forest states had instituted community management of forests, pastures and livestock herds, based on frequent assemblies (Landsgemeinde) of all interested male inhabitants, agreeing on actions on these issues by simple majority vote. This might be interpreted as bringing out the suitability of direct democracy for smaller communities such as cities or here individual, modest-size regions. Already the federation-forming treaty of the three Swiss regions was decided not by direct democracy but by representatives elected by the three individual assemblies (Elazar, 1993).
Over the following centuries, several city states appeared in Europe (such as Andorra, Monaco, San Marino and Liechtenstein), with Republican-style government and various degrees of direct democracy. One feature was the introduction of a legal system with judges elected by the assemblies, and charging these with an arbitration role in case of conflicts with other regions or states, and with functioning as courts for criminal charges within the region. The Swiss cantons were during the Renaissance period challenged by the Church, and later by Napoleon during his imperialistic adventures, but the federal structure as well as many of the local direct democracy traditions has, in fact, been preserved to the present.
Elazar (1993) described the difference between Swiss democracy and, for example US democracy by noting that in Switzerland, individual freedom is promoted inside the liberty frame provided by the community, not outside and not above it. Community democracy requires citizens to contribute to the community and to show tolerance toward others, including minorities, rather than worshipping individualism as the highest goal. One should remember that the success of South European city states in general during the medieval period was due to the difficulty of maintaining central control over large areas by the kings and other rulers following but much less organized than those of the Roman Empire. Most of these city states, such as the Italian cities of, for example Venice, Turin and Florence, had oligarchic or dictatorial rulers, although considerations of trade and commerce created powerful interest groups that sometimes were able to force a political debate. Further North, in Germany, the Lowlands and Scandinavia, cities were less important, but a similar fight emerged between local landlords and kings trying to establish larger territorial states, neither being keen on democratic participation in governance. In several countries, the kings involved the Roman Catholic Church in an attempt to exert a comprehensive mind control over the populations (Downing, 1989; Sørensen, 2012).
Town meetings in New England had some similarity to European city assemblies. In 1628 the British king authorized private companies such as the Massachusetts Bay Company to run the local government including courts and law making (Zimmerman, 1999, Chapter 2). Town meetings were at first spontaneous and without any formal basis, but attendance soon became compulsory and before the end of the 17th century, most town matters were indeed decided at these meetings. In 1634, the General Court imposed on any male above 20 years of age living in the colony, that an oath be taken that he and his family would be obedient to the magistrate and obey any law enacted, and promise to report others who broke the laws, as codified in the 1636 Pilgrim Code of Law (Lutz, 1998, Chapter 20). Each state passed a similar code of law, often with constitutional statements of human rights, such as in the 1639 Fundamental Orders of Connecticut, the 1650 Connecticut Code of Law and the 1647 Rhode Island Acts and Orders (Chapters 52 and 39 in Lutz, 1998), but these were all aimed at securing law and order in the British crown colony and did not set rules for democratic activity, although the documents themselves were agreed at meetings and often after general voting. Human rights and liberties had been covered in documents such as the 1641 Massachusetts Body of Liberties (Chapter 22 in Lutz, 1998), partly based on the English Magna Carta (Anonymous, 1215), an unsuccessful attempt to set some basic rules for an armistice. These human rights and constitution precursor documents were heavily influenced by the church, which in the New England case meant by the puritan protestant persuasion. ‘Puritans’ was the common name given to a variety of church groups in Britain who fought against the autocracy of the king and wanted to constrain him from engaging in arbitrary wars, while establishing an level of moral-based personal freedom and liberty for the citizens (the debate is preserved in the Putney debates from 1647, see Clarke and Woodhouse, 1938; further discussion of their New England impact on the democracy debates may be found in Zimmerman, 1999; Chapters 3–8).
The ‘modern’ type of democracy originates from debates during the period of Enlightenment and gets implemented as a constitution by the French Revolution in 1791 and the founding US constitution, drafted in 1787 and coming into effect over the next couple of years. Thomas Jefferson and Benjamin Franklin visited France and participated in formulating the French Rights of Man declaration (Anonymous, 1789), which like the US Bill of Rights form the basis for the constitution text itself. This is the first time that a constitution is directly formed as a superstructure on a declaration of human rights, and at least in this sense does precisely what the Greek constitutions had failed to do. The modern version of democracy is representative and has no relation to the classical Greek form of direct democracy, and in contrast to the city democracies mentioned earlier was not similar to or influenced by the Greek experiences (Rubin, 2001; Markoff, 1999). Not all British were against the independence and republic formation in colonies such as America. Thomas Paine (1776) noted the absurdity of kings and hereditary succession as a prelude to his call to stop British barbarity and let the United States be free. An exhaustive and sober account of the US society and its political structure in the 1830s has been provided by an envoy of the French government, Alexis Tocqueville (1835, 1840).
The contents of the French and US constitutions are quite similar,††† except for a few amendments seen as required due to the particular situation of the United States after the Civil War, for instance allowing soldiers to keep their weapons and act as police in the western states, where no regular police force could be formed immediately. At least some of these amendments were supposed to be deleted later, and it is a gross misinterpretation of the permission for ex-soldiers to act as police, when conservative Americans currently claim that the constitution allows every man to bear firearms and use them, as it now happens down to elementary school quarrels. The ‘right’ to defend one’s property with firearms is rooted in Locke (1689), who advocated (in contrast to Proudhon, see Section 2.1.1) that man should have full freedom to do as he pleased with any part of his property, whether physical or intellectual, including use of any means to defend it against intruders.
The intellectual debate on human rights and constitutions was initiated by Jean-Jacques Rousseau (1712–1778), along with his work in literature and music. In his analysis of inequality (Rousseau, 1755), he asserts that man shall be loyal only to the entire common good, meaning the welfare of the total society, rather than some monarch or oligarch. He also expresses his antiwar sentiment and disdain for private property, an issue that he follows up in his main political opus entitled The Social Contract (Rousseau, 1762). The contract binds man to serve other members of society in solidarity, and rejects the idea that each man has some ‘natural rights’, such as for the land he is able to be the first to lay hands upon. Rousseau’s concept of a constitution distinguishes between laws, which he believes should be suggested and passed by direct democracy, and their administration by governments and courts, which should be populated by civil servants, hired or elected for their skills and knowledge. His treatise is not suggesting concrete paragraphs of constitutions, but keep the discussion on the level of principles, however not avoiding strong statements such as ‘Representative democracy is one day of democracy followed by four years where the people are nothing but slaves’. Voltaire (1694–1778) criticized the inequality essay and called Rousseau a romantic ‘back-to-nature’ freak, favoring inarticulate and fighting mobs over proper government (e.g., in Candide; Voltaire, 1759), which might have been fair criticism had it been directed at Rousseau‘s early literary works and not the political works described here, where the responsibility toward the entire society is based on articulated demands and not uninformed quarrel. The attack on those preferring life to be as simple and as close to pristine nature as possible should rather have been directed at the American writer Thoreau (1754).
3.2.2. Rights and Duties
The human rights debate following the increasing popular interest in these matters in Europe and its colonies after the Renaissance, and the constitutions subsequently passed in various countries, bore witness of an increased longing for personal freedom embracing a larger fraction of the populations than just the upper classes. Several constitutions, such as the British, emphasized liberty as a general good, while maintaining a firm restriction of governmental power to the king and his sworn allies in church and nobility. If rights were increasing, duties were still confined to obeying the laws of the ruler, as exemplified in the previous section, both for Europe and for the most advanced colony of America. The slogan of the French revolution, ‘freedom, equality and brotherhood’, survived the rapid monarchial reversal of power in France at the end of the 18th century and resurfaced at the 1848 revolution and subsequently became the banner inscription of the new republic. What exactly was contained in these catchwords?
Away from Paris (notable in the direction toward the Pyrenees), there was always a tendency to emphasize ‘freedom’, interpreted both as freedom from the centralized administration and as personal freedom. ‘Equality’ had primarily been associated with equal treatment before the law and in court actions, while equal access to, say, public office was considered negotiable, due to the different qualifications of people seeking such jobs. ‘Brotherhood’ was sometimes even omitted,‡‡‡ but if it was there, it could mean consideration for society at large, a desire to optimize common welfare or just try to avoid conflicts between groups and fractions. The French Revolution is primarily remembered for its atrocious use of the guillotine. The 1791 ‘revolution’ almost immediately decayed into mob rule, used by people like Danton and Robespierre to execute their personal enemies (not unlike the Greek situation after Pericles’ death). Despite these circumstances of creation, the Declaration of Human Rights and the constitution based on it became the foundation for nearly all implementations of democracy during the following years and decades, and the ‘Rights of Man’ particularly became the point of departure for the 1948 UN declaration discussed in Section 2.3.1. The original declaration read as follows in English translation (Anonymous, 1789):
1. Men are born and remain free and equal in rights. Social distinctions may be founded only upon the general good.
2. The aim of all political association is the preservation of the natural and imprescriptible§§§ rights of man. These rights are liberty, property, security, and resistance to oppression.
3. The principle of all sovereignty resides essentially in the nation. No body nor individual may exercise any authority which does not proceed directly from the nation.
4. Liberty consists in the freedom to do everything, which injures no one else; hence the exercise of the natural rights of each man has no limits except those, which assure to the other members of the society the enjoyment of the same rights. These limits can only be determined by law.
5. Law can only prohibit such actions as are hurtful to society. Nothing may be prevented which is not forbidden by law, and no one may be forced to do anything not provided for by law.
6. Law is the expression of the general will. Every citizen has a right to participate personally, or through his representative, in its foundation. It must be the same for all, whether it protects or punishes. All citizens, being equal in the eyes of the law, are equally eligible to all dignities and to all public positions and occupations, according to their abilities, and without distinction except that of their virtues and talents.
7. No person shall be accused, arrested, or imprisoned except in the cases and according to the forms prescribed by law. Any one soliciting, transmitting, executing, or causing to be executed, any arbitrary order, shall be punished. But any citizen summoned or arrested in virtue of the law shall submit without delay, as resistance constitutes an offense.
8. The law shall provide for such punishments only as are strictly and obviously necessary, and no one shall suffer punishment except it be legally inflicted in virtue of a law passed and promulgated before the commission of the offense.
9. As all persons are held innocent until they shall have been declared guilty, if arrest shall be deemed indispensable, all harshness not essential to the securing of the prisoner’s person shall be severely repressed by law.
10. No one shall be disquieted on account of his opinions, including his religious views, provided their manifestation does not disturb the public order established by law.
11. The free communication of ideas and opinions is one of the most precious of the rights of man. Every citizen may, accordingly, speak, write, and print with freedom, but shall be responsible for such abuses of this freedom as shall be defined by law.
12. The security of the rights of man and of the citizen requires public military forces. These forces are, therefore, established for the good of all and not for the personal advantage of those to whom they shall be entrusted.
13. A common contribution is essential for the maintenance of the public forces and for the cost of administration. This should be equitably distributed among all the citizens in proportion to their means.
14. All the citizens have a right to decide, either personally or by their representatives, as to the necessity of the public contribution; to grant this freely; to know to what uses it is put; and to fix the proportion, the mode of assessment and of collection and the duration of the taxes.
15. Society has the right to require of every public agent an account of his administration.
16. A society in which the observance of the law is not assured, nor the separation of powers defined, has no constitution at all.
17. Since property is an inviolable and sacred right, no one shall be deprived thereof except where public necessity, legally determined, shall clearly demand it, and then only on condition that the owner shall have been previously and equitably indemnified.
Neither equality nor brotherhood is explicitly mentioned in this declaration. It is seen that the basic human rights (Article 2) are taken to include property ownership, as further expanded in Article 17. The concept of ‘sovereignty’ introduced in Article 3 and accorded uniquely to the state is here the monopoly on the use of violence. Later interpretations associate sovereignty with how to divide tasks between individual states and a federation or union, for example in the cases of the USA or the European Union. Article 5 limits the permitted laws to exclude arbitrary law making (a fine reminder to current politicians), and Article 6 gives the people the sole right to pass laws, whether by direct or indirect voting. Articles 7–9 provide the protection of the citizens in legal matters such as arrest and trial and Articles 10–11 ensure the freedom of speech.
Duties are introduced in the following Articles 12–14, noting the possible need for military service and taxation (or other ways in which citizens can contribute to maintaining their society). Article 13 suggests a fixed taxation rate for all. Article 15 requires accountability from civil servants and governments and Article 17 ensures that private property can be expropriated by the state if common causes are thereby furthered. The declaration is the first to make up with the earlier definitions of human rights as selfish privileges that can be enjoyed without giving anything in return. Here living in a society is seen as providing benefits conditioned on fulfilling certain obligations, without which there would be no society but just a bunch of individuals trying to maximize their own well being. Emphasizing the coupling between rights and duties is as important today as during the modern democracy formation years, especially after the appearance of the neo-liberal economic paradigm that puts personal gain above anything else.
From a contemporary point of view, there are several of the human rights and duties concepts that appear to need further qualifications. The freedom of speech article was formulated at a time with censorship on written and spoken communication. Although the concerns over such quenching of criticism are still valid, a major problem today is rather junk information and the perversity of advertising, aimed at hiding the inferiority of certain products rather than at making purchasing decisions easier, and also the kind of advertising used in political campaigns to deceive voters to put their cross in favor of politicians who may not be the least interested in the needs of the citizens, but only in securing their own livelihood. Thus, a modern formulation of the freedom of expression should subject commercial messages to strict ethical conditions, making dissemination of false or misleading information a criminal offence. One method could be the use of obligatory labelling (contents, method of production, energy consumption, environmental emissions, etc.), to be required as part of any address to the public concerning a product, along with an objective description of the usage of the product. A radical version of this could be to forbid advertising entirely and only allow a public web description of competing products, as discussed in Section 3.1.4. The same objectivity and completeness condition could be imposed on political advertisement.
The French declaration misses a precise description of equality. For example, equal opportunities are possible only if personal inheritance is abolished, and further require equal access to education and health provision, which de facto means free access, because equal opportunities do not remove inequality in society. The other missing requirement is the establishment of a brotherhood, which in practice will imply a need to emphasize the solidarity, without which the right to hold different opinions and beliefs cannot be secured. Thus, the banner tripartition might take the form conditional liberty, increased economic equality, and first of all a deep-felt social solidarity.
In the present context, free education should be specified as lifelong, continued education, because this is the requirement that our current technology and knowledge stage sets in order for it to function. The duty part of the French declaration should be generalized to require everyone to contribute to the common good according to ability and not just by paying a tax. This has been the requirement of recently proposed constitutions (Sørensen, 2012, Chapter 12) and will receive a more detailed exposition in Chapter 5.
3.2.3. Levels of Society
History has demonstrated how some smaller city states and Swiss-style local areas found it easier to work with direct democracy. Larger units such as nations have instead introduced representative democracy, which was thought to send people to parliament who still retained the knowledge of the smaller community that elected them. This has largely failed and representation has been taken over by political parties, originally based on political ideas but increasingly just being centrally managed entities with little interest beyond being in power and rewarding friends. The policies of parties is still formally based on a program with some dogma, but in practice, once elected, the party members often simply obey the wishes of certain lobby groups (often those who financed their election) and of the heads of government, influenced by similar interest groups. In election campaigns, a spiffy version of the underlying aim (the party program) may have been hinted at, or efforts may simply have been made to hide the real intentions, if the spin doctors did not think that the party program would promote election (Mair, 2013).
In recent decades, globalization has been worshipped (as requested by multinational industries) and supranational structures such as the European Union have moved decisions further away from the local communities. As a result, most Europeans do not have the surplus to even check what is going on in the distant European parliament and administration. In any case, the EU construction (originally a trade organization) neglects the most basic conditions of democracy, that laws are proposed and passed by an elected parliament before being carried out by the administration. In the European Union, the civil servants (called the Commission) propose laws, and the parliament just has to accord a lump sum annual budget for the Commission. A further Council of Ministers allows representatives from the governments of the member states to vote on the laws and regulations proposed by the Commission (EU, 2015). If the EU project has alienated the population from the political process, the US federation has done much better in making the inhabitants of each state have an interest in what goes on in the federal government. This shows that it is not the size of a supranational structure that determines its success, but the way the construction is made.
If the globalization paradigm is followed, in contrast to aiming for little-interacting regions, the problem of global equity becomes acute. The state of affairs in this respect is miserable (Ward, 1979) and more global trade can only make it worse. One issue hinted at in Section 3.1 is that environmental costs of production and overseas transportation are not considered, due to the World Trade Union’s imposed ‘rules of trade’, but the basic problem is of course the underlying belief that one can always find or create regions with low salaries, where the goods enjoyed by the rich regions can be produced at minimal cost. This is similar to the thinking of the colonial times, that one could always find ‘new worlds’ with land and resources that could be exploited in favor of the rich, neglecting any indigenous population that might already inhabit such regions.
Several political observers have called for a worldwide supranational structure, a ‘World Government’ with more comprehensive charges than the help in avoiding warfare between individual nations that lies behind previous or existing organizations such as The League of Nations and The United Nations. The United Nations has a structure with a large assembly where each country has one vote independent of size, plus an executive Security Council (because ensuring global peace is the primary task of the organization), where the countries with the largest weapons arsenals sit permanently and a few other countries in rotation (UN, 2015).**** All offices and organizations in the United Nations are financed by voluntary contributions from member states. Accusations of nepotism (employing the brother of some African dictator, etc.) have been made and decisions unfavorable to large countries have been avoided by threats of withdrawing funding. In any case, the United Nations has not fulfilled its objective, as many wars have erupted since World War II, and several of the Security Council nations have themselves started wars of aggression against other nations, despite not getting a UN endorsement that punishing the nation in question was justified.
Nations are a relatively new invention. They appear at different periods in time, depending on where one looks, but in Europe, they were primarily formed during the first millennium, by intricate and sometimes bloody fights typically involving a self-declared king and the local clan leaders possessing the power earlier. Apart from pleasing multinational companies, the extrapolation to make the planet one global super-state has been claimed to be a way of reducing the frequency of wars. In the current epoch, war is primarily encouraged by the arms industry, and it would seem evident that war will not go away unless arms are first removed. Arms reduction requires that security be maintained in other, nonviolent ways, which would certainly clash against paradigms of unrestricted trade of any merchandise, territorial imperialism and the pride that political leaders feel in seeing army parades and feeling superior to each other. Constitutions such as the French revolutionary one clearly identifies the need to give a monopoly of violence to the top level (in that case the state) and nobody below it, and the natural extrapolation would therefore be that only a supranational entity such as the United Nations may possess arms and use them, not the individual member nations. This idea is clearly behind the UN construction, although it is far from implemented. The Security Council can decide that a military action against a national despot bothering other nations is needed (but at present has no jurisdiction inside a nation). However, the United Nations has no standing army so certain member states must pledge to supply the forces. As mentioned the problem is that these existing national forces are also used for wars outside the consent of the United Nations, and that the arms-dealing industry is supplying arms to just about anyone willing to pay for it, from nations down to rebel groups of any kind. What is needed is to enforce the restriction of military power to the highest level of world government, and to forbid anyone below that level to carry arms, which of course needs an ordered transition period before it is possible. Terrorist groups and weapons-based states (including nuclear powers) must first be barred from acquiring weapons from any source, that is a comprehensive ban on weapons trade, between or inside nations, and the existing weapons must be destroyed, forcefully if needed.
Only after the problem of violence has been solved, can one hope to make the World Government a viable institution for regulating trade, environmental impacts and resource utilization, as a road to creating or maintaining human welfare across the planet.
There is an evident alternative to creating a World Government, namely to divide the world into regions that may choose different economic and social organization, use different schemes of government and accept different ambitions regarding technological development. However, this can work only if globalization is suppressed because otherwise economic predators will make use of the differences to further their own interests (use cheap labor abroad, hijack resources, export poor products to other regions, etc.). Such an Earth in separate pieces has worked for millions of years, before the exploits of colonization and international trade, and even up until today, many abuses of trade have been avoided by the system of duties and import regulations aimed at preventing destruction of indigenous industry by multinationals. Also current mass tourism is a two-sided coin: on one side, it is beneficial that people visit people in other places in order to remove prejudices and appreciate the common aspects of human culture, but on the other side, such visits have created artificial demands for things that cannot sustainably become global. Each inhabitant of India or China cannot have a $100,000 gas-guzzling car; so responsible globalization would require currently affluent countries to dispense with such displays of contempt for resources and environment.
3.2.4. Direct Versus Representative Democracy
Whether a democracy works or not depends on the insights of the voters. We have seen voting introduced in countries with poor education or countries where media manipulations exert a strong influence on voting behavior. That is not democracy. Voting makes sense only when those voting have a reasoned and comprehensive insight into the issue involved and a realistic impression of the consequences of voting in one way or another. The political setup in many countries, including both government and interests operating in the background, is such that hiding the consequences of voting in particular ways has become a national sport. Just as the ancient Greek democracy and the French revolution led to mob rule because the voters had no understanding of the larger picture, then modern representative democracies have led to oligarchic leadership, shutting out the general population from most serious decision making and at the same time creating apathy or contempt for the profession of politicians. The extra complication of political parties has removed the voters further from influence, particularly regarding what issues are being considered in their parliaments.
An early discussion of democracy based on elected representatives was made by the prolific scientist Thomas Hobbes (1588–1679). He departs from human rights such as individual freedom and natural equality but concludes that the best governance is by an absolute sovereign. Yet he sees the need for an input from civil society and concludes that the sovereign must have the consent of the people through a representative structure in what he sees as a social contract (being the first to use this concept; Hobbes, 1651). Disagreeing on the need for an autocratic monarch but supporting representative democracy, the prolific English philosopher John Stuart Mill (1806–1873) notes that many citizens in his time are fed up with the behavior of their government, and he advocates as a remedy more dialogue between citizens and their rulers as a way to approach his ideas of the greatest happiness for all (utilitarianism) and of individual liberty balanced by the needs of a market-based society. Yet, he was open to guild or cooperative ownership of businesses (economic democracy), and he thought that unlimited growth was incompatible with environmental concerns (Mill, 1861; Wikipedia, 2015d).
The discussions over the century following Mill’s treatise make one thing clear: it is a fundamental condition for a representative democracy to work that it is not the same people who make the laws and administer them. A further idea voiced but rarely followed is that citizens elected to sit in a representative assembly should have fixed terms and strict rules for re-election. In ancient Greece service was for one year with the possibility of one re-election. The precise length of time is less important than to make the firm statement that being a politician is not a bread and butter profession. All experience tells that even good politicians fall into routine if not corruption, if they are allowed to regard the parliamentary job as their source of livelihood.
Some countries have the phrase in their constitutions that once elected to the parliament only the member’s own conscience should guide his or her voting. This is probably fair but removes the representative function. The members of parliament no longer need to promote the matters their constituency elected them for. The situation is worse if the parliament is based on political parties, as most parties require their delegates to vote as the party leader or prime minister dictates, independent of any private ‘conscience’. In fact, this is connected with the introduction of cabinet responsibility, meaning that a government should always be backed by a majority in parliament. This requirement was added to the constitution in several countries, after bad examples of governments ruling by ‘provisional laws’ not supported by parliament.†††† In any case, all these issues point in the direction of criticizing representative democracy for having weakened or eliminated the influence of citizens on government. This, of course, becomes worse if new or altered legislation is no longer originating within the parliament, but imposed by the government or a president/king, acting (as in the EU case mentioned earlier) both as law-giver and law-executer, in violation of the division between the law-giving, the executive and the judiciary institution or branch. This tripartite system was hinted at by Aristotle, used in the Roman Republic and later England, and named by the conservative French political philosopher Montesquieu (1748). Today it is nearly universally in use.
Why there is in the classical works on tripartite governance as well as in some current nations a king or president above the three branches is not clear. It complicates governance because there now is a novel need to divide power between the hereditary or elected top figure and the branches of legislators and of a practicing government and its civil servant helpers. In some countries, the sovereign has nearly zero power, whereas in others, he/she can influence the executive government and suggest legislation in competition with the parliament (or neglect it and rule by decree or provisional law). Perhaps the invitation to duplicate power is meant to help avoid misuse of the system for corrupt or externally lobby-imposed purposes. The sovereign is in some countries (such as the United States) head of the executive government with certain rights to veto parliamentary decisions, while in other countries, the sovereign is only signing the employment contracts for the head of government and her/his ministers/secretaries.
The whole question of how to avoid possible misuse of positions in the tripartite structure is difficult to address and have given rise to different precautions. In addition to interpreting the laws passed by parliament, the juridical branch in some countries can question whether laws and executive decisions are in conflict with the constitution, and can handle cases of impeachment charges against elected leaders including the president (in republican states). In other national constitutions, an overseer (ombudsman) outside the government has the right to bring charges against government members for misconduct, but the power to oust the culprits remains with the parliament or the Supreme Court. The overseer is functioning for a fixed number of years and is usually a professor of law with a spotless record. Bias may be introduced by the fact that Supreme Court judges and overseers (where relevant) are usually appointed by the head of government that happens to be in office when a new person in the job is needed. This in itself can be misused, for example in cases where by chance a majority of judges die or retire when a particular party is in power.
It has been seen with increasing frequency that nations introduce or use existing provisions for staging public referenda in cases, where far-reaching decisions have to be made, such as yielding sovereignty to international organizations. This, among other things, makes it less likely that the decisions are reversed next time the majority in parliament changes colour. Usually, making changes in the constitution is required to involve a qualified majority (such as 2/3), being passed by two consecutive elected parliaments, or by parliament and by public referendum.
The current party or party coalition-based executive governments are as already mentioned in Section 2.3.2 at variance with several of the conditions for a representative democracy to function (Mair, 2008). They frequently introduce new legislation based on yesterday’s media coverage and often on minor or specific issues that should have been left to the judiciary branch or the executive departments based on existing legislation of a more general nature. However, also the judiciary branch often has problems, usually in the form of yearlong periods for handling cases where the outcome is needed more or less instantly. A standing advisory legal body could help the administration in such cases, but the practice is rather to form committees that take years to come out with a simple report (leaving additional options for shelving cases inconvenient for a given government).
A common form of corruption in representative assemblies and party-based executive government is to allow lobbies direct access to decision makers. In certain types of governance setup it is even required that so-called stakeholders get preferred access to the legislative process. In Brussels, a whole section of town surrounding the EU Commission’s quarters is devoted to industry and special interest lobbyists. But stakeholder involvement is not democracy, as noted by Blinder (1997). In recent times, the debate has continued to reveal weaknesses of the representative political system. As mentioned in Section 2.3.2, Katz (1987) identified the need to replace at least the highest-ranking civil servants when governments change. This is done in the United States, while in Europe, civil servants are in lifelong tenured positions (perhaps motivated by the need to run the country during collapse, such as in Germany at the World War II defeat). Katz and Mair supplemented each other in presenting arguments showing that party-based democracy has failed and should be abolished (Katz, 2001, 2014; Mair, 2008, 2013; Katz and Mair, 2009; Rahat et al., 2008). A similar conclusion was reached by Zakaria (2003) in his treatise on populist and delegated democracy.
Various adjustments to the way democracy is currently practiced have appeared. Bessette (1980) and Fishkin and Laslett (2003) suggest that voting should be accompanied by a deliberation phase, where issues are discussed by professionals and citizens. This appears to be little more than suggesting that voters should be knowledgeable about what they are voting on. The German sociologist Habermas (1962, 1981) criticized, like many others, the representative democracy for marginalizing input from the public sphere, through commercial and mass media manipulation of public opinion, and subsequently expressed the hope that the deliberative democracy idea can revive public participation, influenced by Max Weber’s thoughts on sociology and the Bessette article. A more elaborated proposal is the ‘Inclusive Democracy’ idea of Fotopoulos (1997), combining direct democracy and economic democracy (leaving political decisions as well as production to the ‘people’, the latter as proposed by Mill) and ensuring that basic needs are satisfied for everyone (not exactly copying Russell’s idea, but involving a contribution of forced work, presumably only from those capable of it, in contrast to the many other suggestions of a basic income, cf. Chapter 5), while leaving a free choice of doing additional work to secure nonessential consumer goods. It is acknowledged that people should somehow be given the necessary insights, including ecological ones, if the extended decision making by ordinary citizens is to work (Arapoglou et al., 2004).
New electronic options could lead to better ideas for balancing direct and representative democracy. Article 11.4 of the EU 2009 treaty (Lisbon Treaty) contains a possibility called a citizen initiative. It allows more than one million European citizens (with some further conditions on national distribution) to submit a proposal to the European Commission, which then, if it finds the proposal suitable, may submit it to the European Parliament and the Council. The idea was to allow Internet debate and solicitation by participants from the entire European Union. Upon implementation in 2012, a number of additional conditions were added, on the number of participants in each of seven member countries, on the kinds of suggestions that would be considered, and on a cumbersome national procedure for collecting participant endorsements, excluding Internet use across the entire European Union, and further prescribing a lengthy verification process by the Commission (Carp, 2014). Carp notes the large number of proposals actually submitted, of which none seem to have been accepted, and lists a number of initiatives refused by the Commission, demonstrating that each refusal involved a political standpoint taken by the Commission’s civil servants. This initiative seems to use ‘e-democracy’ to please only those European citizens who have no intention to try it out. The more obvious step of allowing EU-wide referenda, by Internet or otherwise, has already been rejected at a European Convention. The Lisbon Treaty states that the European Union is based solely on representative democracy, although, as mentioned earlier, the actual EU construction is in basic conflict with most definitions of democracy.
Clearly, this negative example does not preclude that e-democracy can be used in the future. The claim is of course, that while early cases of direct democracy was limited to a city or a small number of people, then Internet usage may extend the possibilities to much larger societies, who can interact to conduct the informed debate on issues before voting upon them, even if they are physically far from each other.
In summary, neither direct nor representative democracy will function unless the citizens master sufficient knowledge to be able to understand the issues voted on and are able to ignore noise from special interests trying to influence the outcome. Furthermore, any democracy requires knowledge on the side of those ruling. If they are elected, a condition for running for office in any of the tripartite branches of government or for presidency must be both a deep knowledge of the (general or specific) subject area involved, but also a spot-free record of incorruptible personal behavior and soberness in any previous political activities.
..................Content has been hidden....................
You can't read the all page of ebook, please click here login for view all page.