
Thermal Energy Harvesting System
Thermal energy harvesting (TEH) is the process of converting thermal energy to electrical energy by using a thermoelectric generator (TEG) made of thermocouples. Thermoelectric power generators have been successfully developed for decades for kilowatt-scale power generation by using waste heat from industrial processes such as vehicle exhaust, space travel, and so on [84]. Such systems involve heat flows at the kilowatt scale and a temperature of hundreds of degrees Centigrade. However, small-scale TEGs [85–86] for obtaining power on the order of milliwatts or lower from ambient thermal energy sources with small temperature differences have only recently been researched [37]. The challenges with utilizing TEG technology in small-scale TEH are low energy conversion efficiency, inconsistency, and low output power due to temperature fluctuation and high costs [85]. As such, there is a significant need for an efficient power management circuit to maximize the power transfer from the TEG source to its connected electronic load over a wide range of operating conditions.
For decades, maximum power point tracking (MPPT) schemes [87, 88, 89 and 90] have been proposed for large-scale power generation systems. However, these MPPT schemes are not suitable for small-scale energy harvesting systems as they consume a significant amount of power for their continuous operation. At lower power levels of milliwatts of interest in this chapter, implementation of such accurate MPPT schemes for small-scale TEH, whereby the power consumed by the complex MPPT circuitry could be higher than the harvested power itself, is not desirable. It is thus important to ensure that the gain in input energy is always higher than the additional losses that are caused by the MPPT operation. Thus far, limited research can be found in the literature that discusses a simple but yet compatible MPPT algorithm addressing the issue of a small-scale TEH system. This chapter presents a resistor emulation approach and its associated circuitry for harvesting near maximum energy from the thermal energy source. The rationale behind the resistor emulation approach [69, 70 and 71] is that the effective load resistance is controlled to emulate the source resistance of the thermoelectric generator to achieve impedance matching between the source and load; hence, the harvested power is always at its maximum at any operating temperature difference. A power-electronic-based converter with minimal open-loop control overhead is realized to act as a near-constant resistance at its input port to emulate the TEH source while transferring energy to the time-varying load resistance, which consists of an energy storage element and a wireless sensor node.
The rest of the chapter is organized as follows: Section 3.1 describes the TEH system and energy conversion effect. Section 3.2 discusses the resistor emulation-based maximum power point (MPP) tracker for TEH; Section 3.3 describes its implementation using a DC-DC (direct-current-to-direct-current) buck converter. The experimental results of the optimized TEH wireless sensor node prototype are discussed in Section 3.4, followed by a summary of the TEH research work in Section 3.5.
The thermal energy harvester employed in this chapter for converting thermal energy into electrical energy is shown in Figure 3.1. The thermal energy harvester is designed for two main purposes: (1) to house the miniaturized thermoelectric generator for ease of deployment and (2) to channel the thermal energy, generated from the heat source at a certain high temperature of TH, to the enclosed TEG via a thin film of thermally and electrically conductive silver grease between them and then release the residual heat accumulated in the heat sink to the surrounded ambient air at a lower temperature TC.
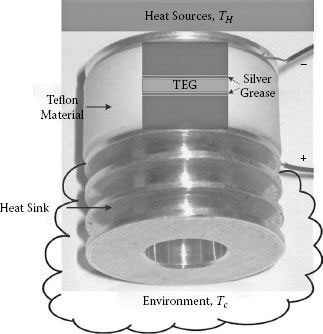
FIGURE 3.1
A thermal energy harvester consisting of a housing structure and a TEG.
3.1.1 Description of a Thermoelectric Generator
Thermoelectricity describes the relationship between heat flow and electrical potential in conducting materials. The ability to generate electrical power from a temperature gradient in materials is due to Seebeck’s effect [91]. This Seebeck’s effect can be observed in a thermocouple made of two dissimilar conductors. If the two junctions are maintained at different temperatures, that is, TCJ and THJ, an open-circuit voltage proportional to the temperature difference ΔTTEG would be developed. For a TEG, which is composed of n thermocouples connected electrically in series and thermally in parallel, the open-circuit voltage Voc of the TEG is given as
(3.1) |
where α and S represent the Seebeck’s coefficient of a thermocouple and a TEG, respectively. In this TEH research, a Thermo Life TEG is used; it is based on the development of a unique thin-film technology for the deposition of highly efficient thermoelectric materials of the Bi2Te3 type on thin Kapton foils [91]. Based on the technical datasheet provided by Thermo Life, the essential geometrical and thermal parameters of the TEG prototype are presented in Table 3.1. The high output voltage of the Thermo Life TEG, due to over 5200 thermocouples in series as well as the relatively high thermal resistance, makes this device ideal for energy scavenging, where only a small temperature gradient is available, such as in body and waste heat applications [91].
3.1.2 Analysis of the Thermal Energy Harvester
To illustrate the thermal and electrical characteristics of the thermal energy harvester, an equivalent electrical circuit model is provided in Figure 3.2.
Main Parameters of Thermo Life Prototype
Geometrical Parameter |
Unit |
Value |
Total height of device |
mm |
0.85 ± 0.05 |
Outer diameter of device |
mm |
9.60 ± 0.05 |
Volume of device |
mm3 |
62 ± 5 |
Mass of device |
mg |
185 ± 2 |
Number of thermocouples (n) |
5200 |
|
Thermal Parameter |
||
Total thermal resistance (RTEG) |
K/W |
14.1 ± 1.0 |
Seebeck’s coefficient of TEG (S) |
V/K |
1.1 |
Seebeck’s coefficient of a thermocouple (α) |
mV/K |
0.21 |
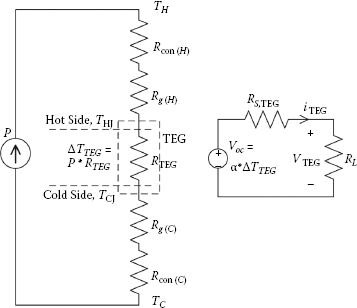
FIGURE 3.2
An equivalent electrical circuit of the thermal energy harvester.
Referring to Figure 3.2, it can be observed that the TEG is connected to the hot and cold reservoirs via the thermal contact and thermal grease resistances, which are given by Rcon(H), Rg(H) and Rg(C), and Rcon(C), respectively. Considering all these thermal resistances RTotal (see Figure 3.2, left circuit) residing in the housing structure of the thermal energy harvester and comparing them with the TEG’s internal thermal resistance RTEG, the actual temperature drop across the thermoelectric generator ΔTTEG may then be expressed as
(3.2) |
Due to the finite thermal resistances of the thermal energy harvester, the temperature difference ΔTTEG across the junctions of the TEG is lower than the temperature gradient ΔT that is externally imposed across the thermal energy harvester. To minimize this negative effect, the thermal resistance RTEG of the TEG must be as high as possible, or in other words, the rest of the thermal resistances of the thermal energy harvester must be minimized.
The unwanted thermal resistance of the thermal energy harvester, which is defined as RThermal = Δx/K A, can be minimized by carrying out some appropriate hardware design on the thermal energy harvester, such as: (1) increasing the contact surface A of the heat transfer area, (2) reducing the thickness of the material Δx used like the fins of the heat sink, and (3) selecting aluminium material, which has very high thermal conductivity K for good thermal conduction. To maintain the temperature difference across the thermal energy harvester, the Teflon material is inserted between the hot and cold sides of the housing structure shown in Figure 3.1 to prevent the adverse effect of parallel parasitic thermal resistance [92].
It should be noted that the effective temperature gradient TTEG depends not only on the thermal and electrical properties of the TEG but also on the resistive load that is connected. When connecting a load resistance RL to the TEG as shown in Figure 3.2, a current ITEG flows, which is given by Dalola et al. [93].
(3.3) |
Depending on the dimension of the TEG, that is, h and Aleg, which are the height and the area of a single thermocouple leg, respectively, and the electrical resistivity ρ of the materials used, the TEG internal electrical resistance Rs,TEG, which is composed of n thermocouples of p-type and n-type semiconductor materials, is given by Dalola et al. [93].
(3.4) |
The output power PL delivered by the TEG to the load RL can be expressed as
(3.5) |
Referring to Equation 3.5, it can be seen that the output power PL is dependent on both the TEG electrical resistance Rs,TEG and the electrical resistance of the external load RL. Under an impedance-matching condition where the load resistance RL is equal to the internal electrical resistance Rs,TEG, the TEG is generating the maximum output power given by
(3.6) |
During operation of the TEG, the output voltage is reduced by the ohmic voltage drop across its internal resistance Rs,TEG. Consequently, the voltage at its maximum power VMPPT is about half that of the open-circuit voltage Voc (Voc = SΔT ≈ 2VMPPT), and the maximum power changes with temperature difference ΔT2.

FIGURE 3.4
P-V curves of a thermoelectric generator at different thermal gradients.
3.1.3 Characterization of a Thermal Energy Harvester
Based on the thermal analysis, the thermal energy harvester has been designed to maximize the overall output power of the TEG. The geometric design parameters, such as x and A, and the thermal interface-related parameters are the main design factors of the thermal energy harvester. The physical size of the optimized thermal energy harvester prototype is 20 x 20 x 20 mm. Some characterization works are performed by applying a temperature difference (TH − TC) between the energy harvester faces and measuring both the output voltage and the current with different loads connected. This operation is repeated for temperature differences in the range between 5 and 30 K.
Referring to the power curve (power versus load voltage) shown in Figure 3.4, it can be observed that the maximum obtainable power for each thermal gradient corresponds to an output voltage of the thermal energy harvester. This is unlike the case of the other energy harvesting sources like solar, vibration, and so on, where their power curves peak near a particular output voltage of the energy source. As such, it is not possible to utilize this simple and ultralow-power MPPT approach, that is, fixed reference voltage to the thermal energy harvester. In order to overcome that, Kim et al. [90] propose the adaptive and tracking MPPT approaches that are suitable for TEH; however, these energy-hungry approaches require high computational power and cost with respect to the milliwatt or even lower harvested power levels of interest in this chapter.
Since most of the conventional MPPT approaches are not suitable for TEH, this chapter presents an alternative MPPT technique based on the concept of emulating the load impedance to match the source impedance as illustrated by the power curves in Figure 3.3. This technique is also known as the resistor emulation or impedance matching approach. The power curve plotted in Figure 3.4 shows that when the load resistance matches the source resistance of the thermal energy harvester of 82 kΩ, the harvested power is always maximum for different temperature differences. However, for other loading conditions, shifting away from the internal resistance of the thermal energy harvester, either very light or heavy electrical loads, the electrical output power being generated by the generator drops significantly. This exhibits that the MPPT technique based on resistor emulation is a possible option to assist the small-scale TEH system to achieve maximum power harvesting from the thermal energy harvester.

FIGURE 3.3
P-R curves of thermoelectric generator at different thermal gradients.
3.2 Resistor Emulation-Based Maximum Power Point Tracker
Resistor emulation techniques have been widely used in the impedance-matching applications [69, 70 and 71]. For instance, Paing et al. [70] successfully demonstrated the resistor emulation approach in energy harvesting from variable low-power radiative radio-frequency (RF) sources. Khouzam and Khouzam [69] have also discussed the resistor emulation concept used in their direct-coupling approach for optimum impedance matching between the energy harvester and its load by carefully selecting the harvester’s rated parameters with respect to the load parameters. However, very limited research works can be found in the literature that discuss the design and implementation of resistance emulation techniques and their approximation for a small-scale TEH system to achieve resistor emulation-based MPPT.
In this chapter, the proposed MPP tracker uses a power converter as an open-loop resistance emulator to naturally track the MPP of the thermal energy harvester with very little control circuit overhead. A buck converter topology is selected for the power converter due to the high output voltage of 5 to 35 V (see Figure 3.4) generated by the thermal energy harvester (input voltage Vin to the buck converter). The main purpose of the buck converter is to match the optimal resistance of the thermal energy harvester, that is, Rs,TEG = Ropt = 82 kΩ at the converter input port, and efficiently transfer the energy to its output port based on the voltage and charge characteristics of the energy storage element. A previous approach [70] has shown that over a certain range of input power level, operation of a boost (step-up) converter in discontinuous conduction mode (DCM) with a fixed duty cycle results in maximum output power. The results as reported by Paing et al. [70] and Paing and Zane [94] can be related to this research work by showing that the DC-DC converters (e.g., buck, boost, and buck-boost) in DCM acts as a near-constant resistance at its input port for large step-up/step-down conversion ratio.

FIGURE 3.5
Buck converter.
To fully understand how the buck converter, when operating in DCM, emulates the source resistance of the thermal energy harvester (Rs,TEG = 82 kΩ)to achieve MPPT, the electrical model of the buck converter shown in Figure 3.5 has been modelled into an averaged equivalent circuit model as shown in Figure 3.6. The modelling process is based on the analysis made by Erickson et al. [71] that shows the average voltage and current of the semiconductor switch are proportional, thus obeying Ohm’s law, and the switch can be simply replaced by an effective resistor, Re (d). In a similar context, the average diode’s voltage and current obey a power source P characteristic, with power equal to the power effectively dissipated by Re (d). Hence, the buck converter in Figure 3.5 can be represented by the averaged equivalent circuit shown in Figure 3.6, where the switch and diode are replaced with an effective resistor Re (d) and a dependent power source P, respectively [71].

FIGURE 3.6
An averaged equivalent circuit of a buck converter.
Based on the DC analysis of the buck converter in DCM [95], the conversion ratio M of the buck converter can be derived [96] as follows:
(3.7) |
In addition, the emulated resistance of the buck converter in DCM Re (d) is obtained as follows [71]:
(3.8) |
where d and Ts = 1/fs are the duty cycle and the switching period/frequency of the gating signal of the PWM (pulse width modulation) switch, respectively. In practical cases, the step-down conversion ratio M of the buck converter (Vin ≫ Vo) may not be large enough such that the correction factor 1/(1− M)is approximately unity. As such, taking into account the effect of the correction factor M on the emulated resistance Re (d) equation of the buck converter derived in Equation 3.8, the overall emulated resistance Rem then becomes
(3.9) |
Knowing that the source resistance of the thermal energy harvester Rs,TEG as obtained experimentally in Figure 3.3 is fixed at 82 kΩ, the input port of the buck converter has to constantly emulate this resistance value such that MPPT can be achieved. In this DCM operation, the converter parameters such as L and fs are fixed, whereas the duty cycle d is tuned to the required value to achieve an equivalent emulated resistance. Hence, the equation expressed in Equation 3.9 has been resolved to determine the duty cycle dem that can emulate the source resistance of the thermal energy harvester (Rs,TEG =82 kΩ) to achieve MPPT, which is given by Dalola et al.
(3.10) |
To demonstrate the competency of the buck converter as a resistor emulation-based MPP tracker and to verify its governing equation expressed in Equation 3.10, the buck converter has been experimentally tested under varying temperature differences and different loading conditions. First, a fixed resistance of 10 k was used as the test load for the operation of a resistor emulation-based MPP tracker under varying temperature differences; the experimental results are shown in Figure 3.7.
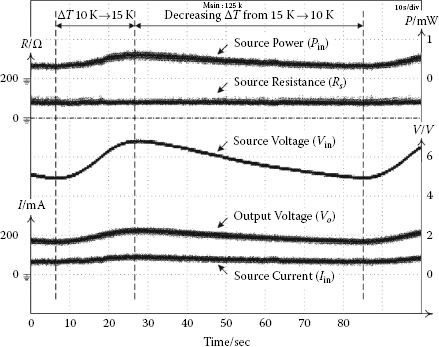
FIGURE 3.7
Operation of a resistor emulation-based MPP tracker under varying temperature differences.
Referring to Figure 3.7, as the temperature difference ΔT across the thermal energy harvester increases from 10 to 15 K, the harvested power Pin, which is the result of the product of the source voltage Vin and source current Iin, increases from around 300 to 600 μW. During this time when ΔT is increasing, it can be seen from Figure 3.7 that the source resistance Rs is emulated by the resistor emulation MPP tracker to remain steadily at the optimal resistance of 82 kΩ.
Based on Seebeck’s effect, as the temperature difference across the thermal energy harvester rises from 10 to 15 K, the source voltage increases from 5 to 7 V, and the step-down voltage Vo output from the buck converter with resistor emulation-based MPP tracker also increases from 1.8 to 2.2 V. Given that the converter parameters are chosen as L = 30 mH, fs = 18 kHz, and dem = 0.14, using Equations 3.7, 3.8, and 3.9, the source resistance obtained experimentally, as shown in Figure 3.7, is verified to be around 82 kΩ. The buck converter is able to maintain the thermal energy harvester near its MPPs for various input operating conditions. Hence, the buck converter yields good performance as a simple resistor emulation-based MPPT under varying temperature differences. These observations and analyzes apply to the decreasing temperature difference condition as well.

FIGURE 3.8
Operation of a resistor emulation-based MPP tracker at 10-k loading.
Second, the operation of a resistor emulation-based MPP tracker for different loading conditions were experimentally tested, and the experimental results are shown in Figures 3.8 and 3.9. Equation 3.10 is used to determine the duty cycle that emulates the source resistance of the thermal energy harvester (Rs,TEG = 82kΩ) for maximum power transfer between the source and the load. The operating range of the loading conditions is determined based on the two extreme ends of the operational bandwidth of the buck converter when connected to a 0.1-F supercapacitor, the initial charging and final charged states of the supercapacitor can be emulated by two load resistances RL of 10 and 56 kΩ, respectively. Based on Equation 3.10, the emulated duty cycles of the two resistance values (i.e., 10 and 56 kΩ) are calculated to be 0.14 and 0.27, respectively.
Referring to Figures 3.8 and 3.9, the complementary emulated duty cycles (a P-MOSFET [metal-oxide-semiconductor-field-effect-transistor] [PMOS] is used instead of an N-MOSFET [NMOS] as the high-side switch of the buck converter) obtained experimentally are 0.14 and 0.251 for the load resistances RL of 10 and 56 kΩ, respectively, and the experimental results tally with the calculated duty cycles of 0.14 and 0.27. At the emulated duty cycles, it can be observed in both Figures 3.8 and 3.9 that the approximate desired Rem =82 kΩ is achieved, and the maximum electrical power PMPPT = 580 μW (see Figure 3.3) is harvested.
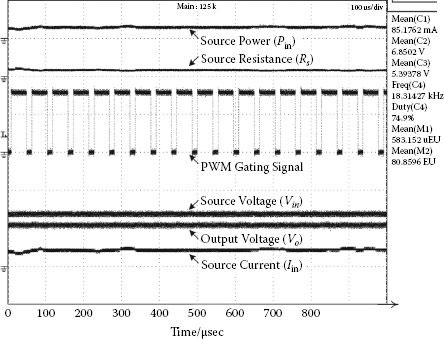
FIGURE 3.9
Operation of a resistor emulation-based MPP tracker at 56-kΩ loading.

FIGURE 3.10
A schematic diagram of the TEH system.
3.3 Implementation of an Optimal Thermal Energy Harvesting Wireless Sensor Node
The schematic diagram of a self-autonomous wireless sensor node powered by the designed TEH system and its ultralow-power and efficient power management circuit is illustrated in Figure 3.10. Referring to Figure 3.10, the designed power management circuitry with resistor emulation MPPT approach can essentially consist of three main building blocks: (1) a buck converter with MPP tracker and its control and PWM generation circuit that manipulates the operating point of the TEH to keep harvesting power at the MPP, (2) an energy storage element (i.e., supercapacitor to buffer the energy transfer between the source and the load), and (3) a regulating buck converter to provide constant voltage to the wireless sensor node and other electronic circuitries.
3.3.1 Buck Converter with Resistor Emulation-Based Maximum Power Point Tracking
The buck converter in the DCM has been illustrated to perform well as a near-constant resistance at its input port to manipulate the thermal energy harvester to transfer maximum power to its output port, which is connected to a 0.1-F supercapacitor, based on the duty cycle d of the PWM gate signal applied to the buck converter [70]. Within the operational bandwidth of the buck converter under different loading conditions, in the range of 10 to 56 kΩ, a duty cycle value of 0.16 has been selected to operate the buck converter to its near MPPs. Substituting the duty cycle value, d = 0.16, into Equation 3.9, the emulated resistances, with the connected load of 10 and 56 kΩ, are calculated to be 68 and 126 kΩ, respectively. Referring to Figure 3.3, it can be observed that the power losses at these resistance values, which are near to the MPPs, are less than 5% of the maximum obtainable power at Rem = 82kΩ. This power waste (few tens of microwatts) is much less than the power consumed by the high-power overhead of complex control circuitry required to perform the accurate and precise closed-loop MPPT techniques.
The operation of the buck converter as an open-loop resistance emulator is as follows: A low-frequency PWM control signal, about 100 Hz, of the desired duty cycle of 0.16 is generated by a Texas Instruments microcontroller (TI MSP430F2274). An ultralow-power PWM generation circuit is designed to transform the low-frequency PWM control signal generated from the reduced clock speed microcontroller to a higher switching frequency of 10 kHz, so smaller filter components are used in the buck converter to miniaturize the overall TEH system. The PWM generation circuit is made up of a micro-power resistor set oscillator (LTC6906) used for sawtooth generation and a micropower, rail-to-rail complementary metal-oxide semiconductor (CMOS) comparator (LMC7215), which compares its reference signal (dem ∗ Vre f = 0.16 ∗ 2.5V = 400 mV) with the high-frequency sawtooth signal to generate the PWM gate signal to control the buck converter.
For long-term deployment of the TEH wireless sensor node, it is required to have an energy storage device such as supercapacitor and batteries on-board the sensor node to accumulate the input energy generated from the heat source and use it to sustain the node’s operation throughout its lifetime. The supercapacitor has superior characteristics over batteries, which include numerous full-charge cycles (more than half-a-million charge cycles), long lifetime (10 to 20 years operational lifetime), and high power density (an order of magnitude higher continuous current than a battery) [34]. Unlike the discrete capacitors, which have very small capacitance values in the picofarad to microfarad range, the supercapacitor has a very large capacitance value in the farad range suitable for energy storage purposes. For the design of the buck converter as a resistor emulation-based MPP tracker, it is important to consider the dynamic response of the supercapacitor to ensure constant MPPT operation is achieved.
For a time period of 500 s as shown in Figure 3.11, the supercapacitor is charged by the TEH system from its initial state of 1 V. As the supercapacitor is charging, the dynamic response of the supercapacitor changes according to the operating conditions of the TEH system; the impedance of the supercapacitor is equivalent to the range of load resistances RL between 10 to 56 kΩ. At Vcap (500 s), the 0.1-F supercapacitor is being charged to voltage levels of 2.57 V with the MPPT scheme and 1.73 V without the MPPT scheme. Comparing the two schemes, it is obvious that the charging performed by the TEH system with MPPT is much higher than its counterpart without the MPPT scheme. This is because the thermal energy harvester is maintained at its near MPPs; hence, more electrical power is transferred to the supercapacitor. When the TEH system is operating with the MPPT scheme, the amount of energy accumulated in the supercapacitor after 500 s is 0.28 J, which is two times its counterpart of 0.15 J; hence, this exhibits the superior performance of the TEH system with the MPPT scheme over its counterpart under a dynamic loading condition.

FIGURE 3.11
Performance of a TEH system with MPPT and without MPPT for charging a supercapacitor.
3.3.3 Regulating a Buck Converter and Wireless Sensor Node
The TEH system is designed to power a commercially available wireless sensor node supplied by Texas Instrument known as the wireless target board, eZ430-RF2500T. A buck converter (LTC1877) obtained from Linear Technology is inserted between the supercapacitor and the wireless sensor node to provide a constant operating voltage of 2.8 VDC. The efficiency of the buck converter is around 80% to 90%, consuming an operating current of 12 μA. In this chapter, the operation of the wireless sensor node deployed in an application field is illustrated in Figure 3.12.

FIGURE 3.12
Operation of the wireless sensor node.
As seen in Figure 3.12, the sensor node’s operation is comprised of (1) sensing some external analog signals of sensors such as temperature and (2) communicating and relaying the sensed information to the gateway node every 5 s. On receiving the data at the base station, the collected data is then postprocessed into usable information for any follow-up action. This duty-cycling approach could significantly reduce the power consumption of the energy-hungry radio module of the sensor node with a slower transmission rate of every few seconds.
The optimal TEH wireless sensor node has been successfully implemented in a hardware prototype for laboratory testing. Several experimental tests have been conducted to differentiate the performance of the TEH system and its resistor emulation MPPT scheme in powering the connected load consisting of a supercapacitor, control and PWM generation circuitries, and wireless sensor node. The operation of the electrical load, as shown in Figure 3.13, is first powered solely by its onboard supercapacitor and then the TEH system with its integrated MPPT harvesting at a temperature difference of 20 K.
Referring to Figure 3.13, it can be observed that the supercapacitor voltage Vo keeps decreasing during the period of time when neither the TEH system nor its integrated MPPT is connected to the sensor node. The conventional sensor node, which operates solely on the supercapacitor, consumes 200 μW of average power from the 0.1-F supercapacitor; hence, the voltage across the supercapacitor drops from 4.65 to 4.5 V in around 330 s, which is calculated to be 69 mJ of energy transferred to the load. Once the TEH system with MPPT is activated, the harvested power of around 450 μW is used to power the sensor node as well as to charge the supercapacitor back to 4.6 V in 170 s. This indicates that solely depending on the energy storage to sustain the operation of the sensor node is not sufficient; it is only when the TEH system with its MPP tracker is employed that sufficient power is provided for both the operation of the wireless sensor node and charging the supercapacitor.

FIGURE 3.13
Operation of a wireless sensor node.
The designed buck converter with the resistor emulation MPPT approach has already been demonstrated to yield good performance in extracting maximum power from the thermal energy harvester, but this comes at the expense of additional power losses in the converter and its associated control and PWM generation circuits. It is thus necessary to investigate the significance of these power losses as compared to the total harvested power. The first investigation is to determine the efficiency of the buck converter ηconv as a function of its output load power Pload over its input DC power Pdc under different temperature differences and loading conditions. Take, for example, at a temperature difference and output load resistance of 20◦C and 10 kΩ, respectively, the efficiency of the buck converter is given by
(3.11) |
For all other temperature differences and loading conditions, the efficiencies of the buck converter are calculated using Equation 3.11 to be on an average of 90%, and the computed results are shown in Figure 3.14. This high-efficiency buck converter is very favourable and desirable in a very low power rating condition of milliwatts or even lower. Another investigation being carried out is to determine the power consumption of the associated control and PWM generation electronic circuits and its significance as compared to the harvested power. Based on the voltage and current requirements of each individual component in the TEH system shown in Figure 3.10, the total power consumption of the electronic circuits can be calculated as follows:
(3.12) |
These power losses associated with the resistor emulation-based MPP tracker at different temperature differences are illustrated in Figure 3.15. Taking into account both the power loss across the buck converter and the power loss in the associated control and PWM generation circuits mentioned by Equations 3.11 and 3.12, respectively, the performance comparison between the TEH system with MPPT and without MPPT are tabulated in the bar chart in Figure 3.16. For all the temperature differences shown in Figure 3.16, it can be observed that the electrical power harvested by the TEH system with MPPT is at least two to three times more than the TEH system without MPPT. Taking into account the power losses of the buck converter and its associated circuitry, the net harvested power from the TEH system with the MPPT scheme is still more than the case without the MPPT scheme. Hence, this exhibits the importance as well as the contribution of implementing MPPT in the TEH system.
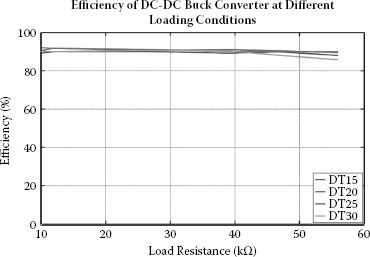
FIGURE 3.14
Efficiency of a buck converter with resistor emulation-based MPPT for various temperature differences.

FIGURE 3.15
Power losses associated with an MPP tracker.

FIGURE 3.16
Performance comparison between the TEH system without MPPT and with MPPT.
In this chapter, an efficient TEH system and its power management circuit have been proposed to maximize power transfer from the heat source to its connected wireless sensor node. The electrical characteristic of the TEH system is unlike the case of the other common energy harvesting sources like solar and vibration, where most of the conventional MPPT approaches with very little control overhead are not suitable. This chapter presented a resistor emulation-based MPPT technique to emulate the load impedance to match the impedance of the TEH system. Experimental results showed that the self-autonomous wireless sensor node powered by the designed TEH system and its ultralow-power and efficient power management circuit yielded better performance than the conventional battery-operated wireless sensor node. At a temperature difference of 20 K, the efficiency of the buck converter was 92%, and its associated power management circuit consumed 289 μW of power to operate. From the experimental test results obtained, an average electrical power of 629 μW was harvested by the optimized TEH system at an average temperature difference of 20 K, which is almost two times higher than the conventional energy harvesting method without using MPPT.