Chapter 1
Preparing Drawings in CAD or BIM for Enhancement
Communicating design ideas with plans, elevations, and section drawings is second nature to architects, engineers, builders, and designers in related disciplines. Many professionals subconsciously assume that everyone is aware of what is actually an obscure set of graphic conventions surrounding measured drawings. These conventions are either learned in design school or integrated through osmosis early in one’s career.
Chapter Contents
- Making drawings readable by everyone
- Preparing drawings in CAD or BIM
- Working with AutoCAD 2011 drawings
- Working with Revit Architecture 2011 models
Photo courtesy of iStockphoto, © Vasko, Image #502782
Making Drawings Readable by Everyone
Does the average man or woman on the street know what a section drawing is, let alone how to read a section tag referencing a drawing? What do dashed lines represent to someone not in the design world? How do centerlines appear, and what do thicker lines indicate? More important, who cares?
For those working with design principles every day, it might be surprising to hear that some members of the general public, and maybe even some of your clients, don’t fully understand 2D computer-aided design (CAD) drawings; they remain an abstraction for many people and, more important, these people might not verbalize this fact. After all, although we all inhabit 3D architecture every day of our lives, most of us do not have to correlate that experience with 2D drawings on a regular basis.
Whether or not you choose to create 3D building information models (BIMs) or show 3D imagery to your clients, at the end of the day you’re still required to generate 2D drawings as legal construction documents. This chapter teaches you how to begin the process of enhancing your drawings, whether you start in CAD or BIM. In Chapter 2, “Enhancing Drawings in Photoshop,” you’ll learn how to add color, gradients, textures, and shadows to enrich technical line drawings and render them comprehensible by technical and nontechnical people alike.
Preparing Drawings in CAD or BIM
CAD and BIM programs are primarily vector tools. Software engineers have programmed intelligence in these programs in the form of numerous parameters that control the appearance of building components for most conceivable real-world situations. Modern CAD and BIM programs include a few raster features, such as the ability to do the following:
- Assign pixel-based textures to objects and bounded spaces
- Print or export images directly
- Access 3D rendering features that calculate pixels based on geometry, lighting, and materiality
Photoshop, on the other hand, is primarily a pixel-manipulation tool, with a few notable exceptions (such as the Pen tool and 3D toolset). When it comes to enhancing drawings, what we are really talking about is rasterizing, or softening, hard-edged objects and bounded spaces with pixel-manipulation techniques, which is where Photoshop truly excels.
Although it’s possible to enhance a single-layer line drawing exported from CAD or BIM, my preference is to import multilayered drawings so that line thickness and anti-aliasing can be managed in Photoshop. The ability to transfer multilayered drawings from CAD or BIM into Photoshop is complicated by fundamental differences between vector and raster data.
On this book’s accompanying DVD I’ve included a LISP program I wrote to automate the transfer of drawings from AutoCAD to Photoshop. (LISP is the LISt Processing interpreted programming language that has been part of AutoCAD for decades.) Such automation is theoretically possible in other CAD programs, but not provided in this book.
There is no way to transfer multilayer drawings from Revit Architecture directly into Photoshop without using AutoCAD as an intermediate step. We therefore need to enhance single-layer drawings coming directly from Revit (see “Working with Revit Architecture 2011 Models” later in this chapter).
Working with AutoCAD 2011 Drawings
I’m working with AutoCAD 2011 in this book, but the LISP program and techniques presented will work in versions of AutoCAD going back more than a decade, to AutoCAD 2000. There are various steps to working with AutoCAD drawings, which I cover in detail in this section.
The game plan for transferring any CAD drawing into Photoshop is to first clean up the CAD drawing you’re interested in enhancing. Cleanup will be necessary for every drawing you transfer from AutoCAD into Photoshop.
The first time you go through this procedure, you’ll need to create a raster print driver in order to export single-pixel-width lines from AutoCAD. In addition, you’ll create a custom “paper size” (actually specified in pixels) and create a custom plot style to properly export lines as pixels. Once these drivers are set up, you can use them indefinitely to convert vector drawings into raster images.
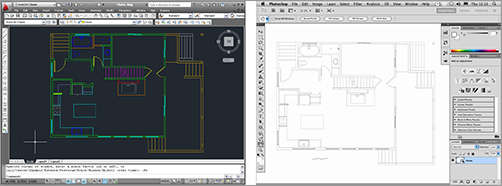
You’ll also need to make a test plot in order to configure the LISP program to automate the creation of images from each layer in your CAD drawing. The last preparatory procedure is reassembling all image layers exported from the LISP program within AutoCAD into a smart object in Photoshop (see Figure 1-1).
Figure 1-1: Converting an AutoCAD drawing to a Photoshop smart object
Cleaning Up Drawings
The data of CAD drawings must be in a suitable form before it can be used successfully in Photoshop. It is therefore important to follow a few basic cleanup guidelines when preparing CAD drawings for use in Photoshop:
- Follow “clean” drafting practices so that end points of entities snap together precisely.
- Verify that entities are on the correct layers.
- Simplify layers into human-readable form; the layers you transfer into Photoshop are for your reference and do not need to adhere to a standard CAD layer-naming convention.
- Purge any unused layers and blocks (because blocks can trap layers).
- Cut away and erase any nonessential areas of the drawing that you won’t be enhancing in Photoshop.
- Erase any filled or hatch areas, symbols, title blocks, or dimensions you don’t want to appear in Photoshop.
- Simplify the drawing as much as possible to maximize readability.
Note: If you do not follow “clean” drafting practices in CAD, your job in Photoshop will be much harder. It is best to spend some time in CAD cleaning up legacy drawings before working on them in Photoshop.
Setting Up a Printer Driver and Paper Size in AutoCAD
AutoCAD is fundamentally a vector program, meaning it stores entities as mathematical objects by using a spatial coordinate system. Lines are stored as end points that are located by their x-, y-, and z-coordinates in space. To convert this vector data to pixels, you need to set up an image printer driver. After you “print” the drawing, the entities from CAD end up as black pixels on a white background in a raster image.
The following procedure doesn’t actually print on a real device; you are merely setting up a virtual “printer” to export raster data from AutoCAD. These steps need to be performed only once. After you configure the image printer driver and its associated custom paper-size file, you can use these steps as often as you’d like to export images from AutoCAD. If you are a CAD manager, you can copy the driver files you set up here onto your file server and have all AutoCAD users in your organization reference them.
To set up a virtual printer, follow these steps:
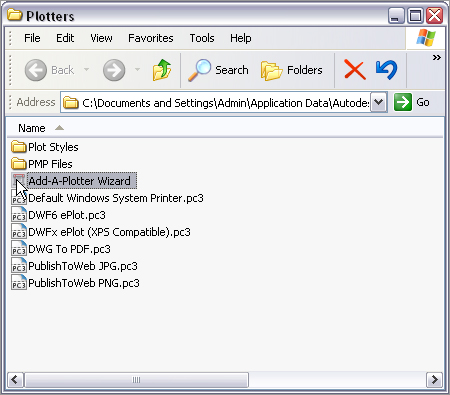
1. In AutoCAD, type PLOTTERMANAGER and press Enter to open the folder containing plot drivers.
2. Double-click the Add-A-Plotter-Wizard (as shown in Figure 1-2).
Figure 1-2: Plotter driver folder
3. On the Introduction screen, click Next to open the Begin screen.
4. Leave the My Computer radio button selected and click Next, as shown in Figure 1-3, to open the Plotter Model screen.
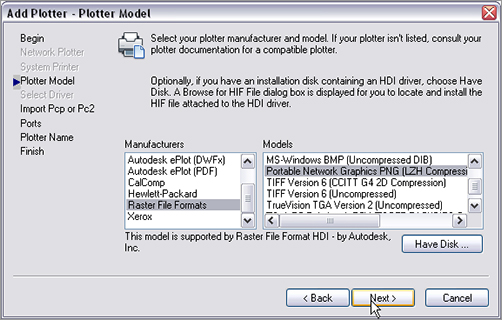
5. Click Raster File Formats in the Manufacturers list, and then select the Portable Network Graphics PNG (LZH Compression) option in the Models list (Figure 1-4).
Figure 1-3: Configuring the driver to be managed locally
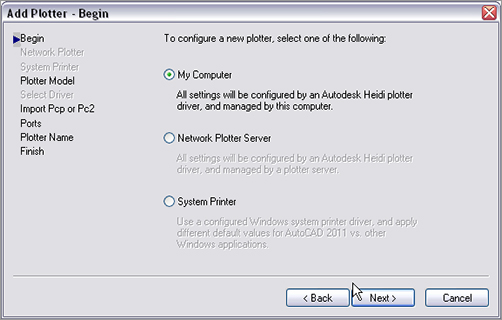
Figure 1-4: Selecting the PNG image format
6. Click Next and Next again to accept the defaults on the Import PCP or PC2 and Ports pages.
7. Click Next again and type ImagePrinter as the Plotter Name (Figure 1-5).
Figure 1-5: Naming the plot driver
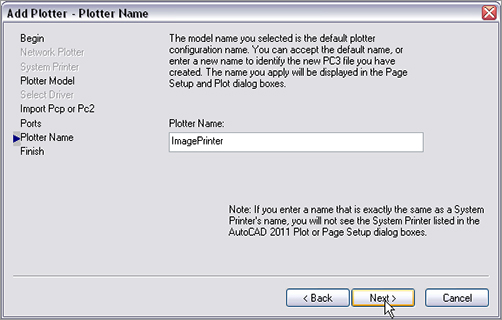
Note: The name ImagePrinter is used in the AutoLISP file on the accompanying DVD. Please use this name so that the LISP program functions properly later in this chapter.
Next, you’ll need to get rid of all the default “paper sizes,” which for this virtual image plotter driver are actually pixel sizes. You’ll then create your own custom size that is larger than any of the presets. Continue with these steps:
8. Click Next and then click the Edit Plotter Configuration button.
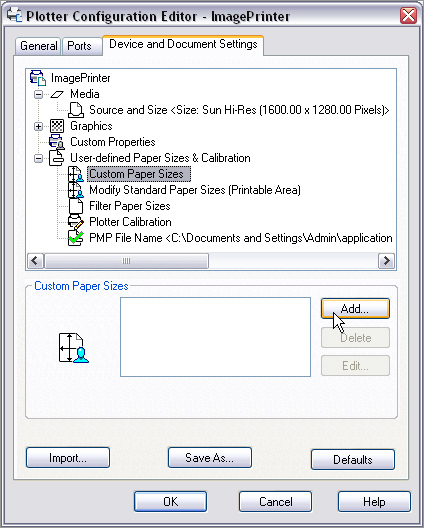
9. Click the Device And Document Settings tab in the Plotter Configuration Editor that appears and expand the User-Defined Paper Sizes & Calibration node in the driver hierarchy.
10. In that expanded list, click Filter Paper Sizes. Then click the Uncheck All button.
11. Select the Custom Paper Sizes node and click the Add button (Figure 1-6).
Figure 1-6: Configuring the plot driver
12. In the Custom Paper Size Wizard, choose Start From Scratch and click Next.
13. On the Media Bounds page, type 3000 for Width and 2000 for Height (Figure 1-7). Leave the Units drop-down set to Pixels. Click Next.
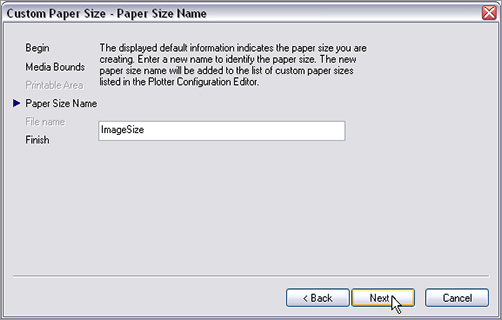
14. On the Paper Size Name page, type ImageSize in the text box (Figure 1-8).
15. Finally, click Finish to close this wizard. ImageSize appears in the Plotter Configuration Editor now.
Figure 1-7: Specifying pixel dimensions for the custom paper size
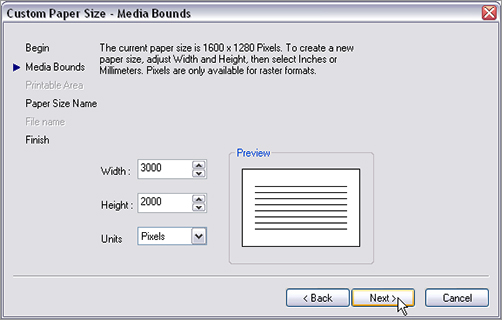
Figure 1-8: Naming the custom paper size
Note: The name ImageSize is referenced in the AutoLISP program used later in this chapter. It is important that you use this name exactly.
It is now time to limit the color depth that your ImagePrinter driver uses so you can create images with black and white pixels only. This will make smaller image files and save hard drive space. Follow these steps:
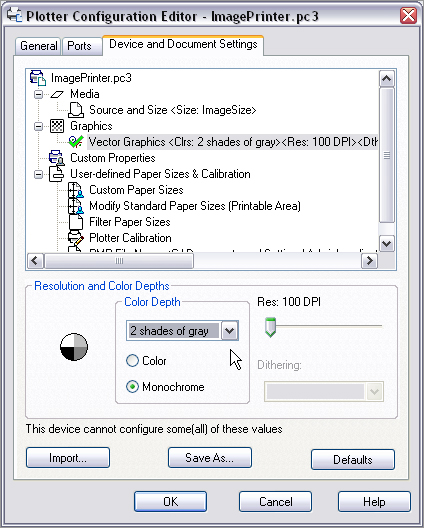
16. Expand the Graphics node in the driver hierarchy and click the Vector Graphics node.
17. In the Color Depth group, click the Monochrome radio button, and then choose 2 Shades Of Gray from the Color Depth drop-down, as shown in Figure 1-9.
18. Click OK to close the Plotter Configuration Editor.
Figure 1-9: Limiting the color depth of the output
19. Finally, click the Finish button in the Add-A-Plotter Wizard to create the ImagePrinter.pc3 file on your hard drive.
Creating a Plot Style Table for Images
In manual drafting, architects used to press harder on the pencil to make important lines thicker. These days, plot styles control line thickness in AutoCAD. When you convert vector line work, ideally you want the lines showing up as single-pixel-width lines in the image. Thin, unbroken lines provide the most flexibility in Photoshop (as you’ll see in Chapter 2). For now, let’s focus on how plot styles control line width in AutoCAD output.
Note: I believe it’s better to add lineweight intentionally in Photoshop by using the stroke effect, rather than exporting thicker lines directly from AutoCAD because stroked lines in Photoshop feature anti-aliasing, which reduces the jagged appearance of angled lines.
There are two kinds of plot styles available: color-dependent and named. I recommend using color-dependent plot styles in preparing drawings for export to images because of their simplicity, even if you use named plot styles in production work.
Note: Use the CONVERTPSTYLES command in AutoCAD to convert an existing drawing from a named plot style to a color-dependent plot style, or vice versa.
Here’s how to create a custom color-dependent plot style to use in creating output with your new ImagePrinter:
1. Type STYLESMANAGER and press Enter.
2. Double-click the Add-A-Plot Style Table Wizard.
3. Read the introductory message and then click Next.
4. Make sure the Start From Scratch radio button is selected on the Begin screen and click Next (Figure 1-10).
Figure 1-10: Creating a color-dependent plot style table
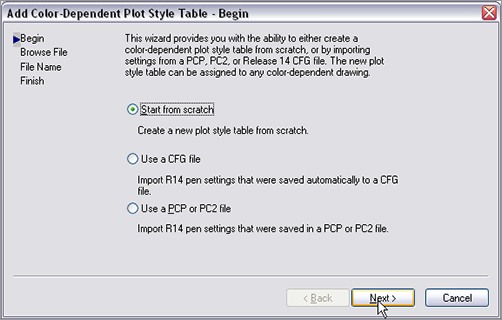
5. Choose Color Dependent Plot Style Table, and click Next to open the File Name screen.
6. Type the name Images in the File Name text box (Figure 1-11).
Figure 1-11: Naming the color-dependent plot style
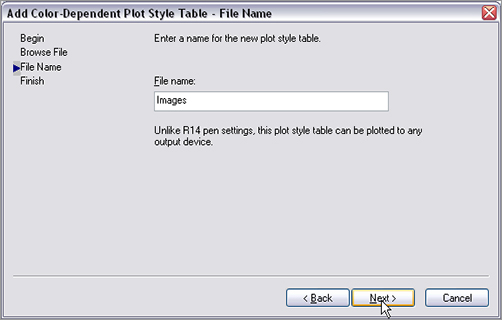
Note: The name Images is referenced in the AutoLISP program used later in this chapter. It is important to use this name exactly.
7. Click Next again and then click the Plot Style Table Editor button.
8. Click the Form View tab if it is not already selected.
9. Drag out a selection window in the Plot Styles list box that shows the color numbers (see Figure 1-12). Keep dragging until the list automatically scrolls and all 255 colors are selected.
10. In the Properties group, click the Color drop-down and select the Black option.
11. Click the Lineweight drop-down and select 0.0000 mm (see Figure 1-13). This is the thinnest possible lineweight.
Figure 1-12: The Plot Style Table Editor dialog box
Figure 1-13: Configuring plot style
12. Click the Save & Close button. A file called Images.ctb is automatically created in the Plot Styles folder on your hard drive.
13. Click Finish to close the Add-A-Plot Style Table Wizard and close the Plot Styles folder.
Now you have configured the ImagePrinter as a raster printer driver that you can use to convert vector line work in AutoCAD to the pixels of an image that you’ll be able to manipulate with Photoshop.
Making a Test Plot to Determine Scale
Before you use the LISP program to automate the conversion of each AutoCAD layer to a separate image file, you must do one test plot in order to work out the scale of the drawing relative to the image size. Every building has a different physical size, so you’ll need to work out the plot scale each time. Let’s give it a try:
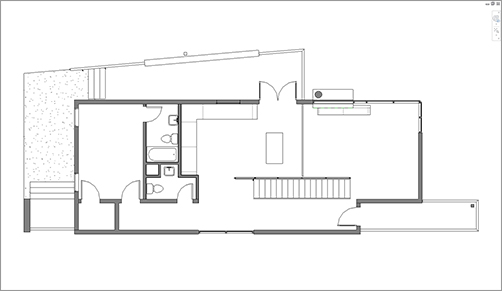
1. In AutoCAD, open Home.dwg, which is the first-floor plan of my home. This file is already “cleaned up” (see the “Cleaning Up Drawings” section earlier in this chapter), so it’s ready to be transferred into Photoshop.
Note: If you don’t have AutoCAD, you can skip ahead to the next section or Chapter 2. Plotted AutoCAD image files are provided so you can jump right into Photoshop.
2. Press Ctrl+P. Click OK if a warning dialog box appears indicating a missing driver; you’ll select the correct driver in a moment.
3. Click the Name drop-down under Printer/Plotter, select ImagePrinter.pc3, and click to select the default paper size when prompted.
4. Click the More Options arrow button in the lower-right corner (see Figure 1-14) if the dialog box is not already expanded.
5. Select ImageSize as the Paper Size.
6. Open the Plot Style Table drop-down and select Images.ctb (Figure 1-15).
7. Under Plot Area, select Extents from the What To Plot drop-down. Under Plot Offset, select the Center The Plot check box. Under Plot Scale, select Fit To Paper.
At this point, we’re ready to plot the entire drawing to an image, but we’re not going to do this yet because we still have to work out the scale. Instead, we’ve simulated the plot with the Fit To Paper option to work out the plot scale. Take a look at the grayed-out numbers in the Plot Scale area, shown in Figure 1-16.
Figure 1-14: Plot dialog box
Figure 1-15: Selecting plotter, paper size, and plot style table
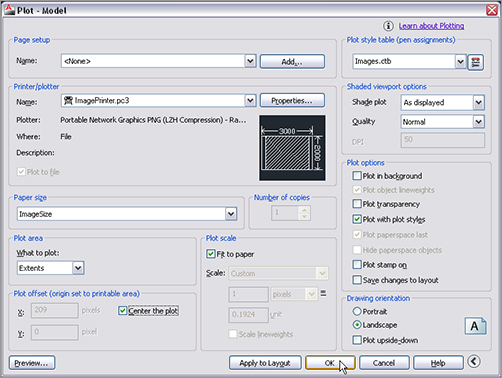
Figure 1-16: Plot Scale area of the Plot dialog box
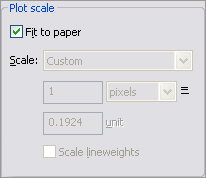
With the drawing stretched to the maximum size relative to the image size, 1 pixel in the plot equals 0.1924 units (which are inches in imperial units). We must rationalize this arbitrary measure to the nearest common fraction in order to maintain graphic scale in Photoshop. In other words, rationalizing in this context means changing 0.1924 units to 0.25 units. Continue with these steps:
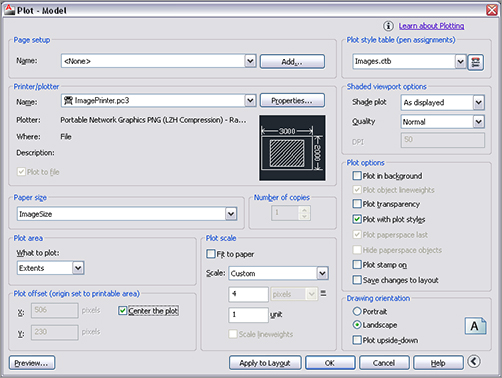
8. Deselect the Fit To Paper check box in the Plot Scale area of the Plot dialog box.
9. Change the unit value from 0.1924 to 0.25. Notice the black-and-white preview in the Printer/Plotter area shows the crosshatched plot area fitting within the image size of 3000×2000 pixels.
Note: If the crosshatched area doesn’t fit within the image size in the preview, you’ve gone the wrong way. For example, if you rationalized 0.1924 to 0.125 (1/8), you would have gone the wrong way, numerically speaking. Adjusting 0.1924 to 0.25 (¼) is the correct rationalization in this particular case because the drawing fits within the image size.
At this point, we have found what we are looking for—the numerical relationship between inches and pixels. The rationalized equation is 1 pixel in the image = 0.25 inches in the drawing. If we multiply both sides of the equation by 4, we’ll end up with whole numbers.
10. Type 4 on the pixel side of the equation and 1 on the unit side. The black-and-white preview remains unchanged, so the final equation is simply 4 pixels = 1 inch (see Figure 1-17). Press Esc to close the Plot dialog box without plotting.
Figure 1-17: Rationalizing plot scale
Make a mental note of the final equation (in this case, 4 pixels = 1 inch) or write it down. We will input this equation into the LISP program next. If you were plotting a drawing depicting something larger than my house, you would likely require a different plot scale to fit the building within the fixed grid of 3000×2000 pixels. Perhaps 8 pixels = 1 inch would rationalize a larger building (1⁄8″ scale). There can never be a hard-and-fast rule, because every building has a different size; you’ll have to work out a rational plot scale every time.
Plotting with the Included LISP Program
Typical CAD drawings contain many layers, and more creative possibilities open up if you can access these as individual image layers in Photoshop. It is possible to transfer the layers from an AutoCAD drawing to Photoshop by plotting each layer one at a time and then integrating the image files in Photoshop. I have written a program (included on the companion DVD) that automates part of this process, saving you many hours of tedium.
The program, called lay2img (Layer to Image), runs in AutoCAD and automates plotting by converting each vector layer into a raster image file. It is written in Autodesk’s subset of the ancient list processing language (developed in the 1950s) called AutoLISP. Programming in AutoLISP is beyond the scope of this book, although you will learn how to edit a few simple parameters in the program to suit your needs.
You’ll use AutoCAD’s built-in Visual LISP integrated development environment to edit the code:
1. Type VLIDE and press Enter. This command stands for Visual LISP integrated development environment.
2. Within the Visual LISP for AutoCAD window that appears, choose File Open and select lay2img.lsp from the DVD. Each line is commented for clarity. Read through the program to get a sense of what it does, even if you’ve never seen LISP code before.
3. Note that the printer driver is specified as ImagePrinter.pc3, the paper size is specified as ImageSize, and the plot style table is Images.ctb. Edit the appropriate lines of text if your drivers, paper sizes, or plot style tables have different names. The program won’t work if there are any typographical errors, extra spaces inside the quotes, or misspellings.
4. Change the Plotted pixels = drawing units line to read "4=1". This is the “final equation” we came up with by doing a test plot.
5. Press Ctrl+S to save the LISP file.
6. Click the button shown under the arrow cursor in Figure 1-18 to load the file into memory.
Figure 1-18: lay2img.lsp open for editing in AutoCAD’s Visual LISP integrated development environment
7. Switch back to AutoCAD, type lay2img, and press Enter to open the Save Image Files Of Each Layer dialog box, which prompts you to choose a path and a prefix name to save the image files of each layer. Make a subfolder called Output on your hard drive, type the prefix name Home, and click Save.
The automated process begins, and an image is plotted for each layer of the drawing. There is one image file for each layer in the CAD drawing. The filenames are preceded by the name you typed in step 7 (Home), but the layer name from AutoCAD completes the filename after the dash. For example, one of the generated files is called Home-Walls.png; Home is the prefix name you typed, and Walls is the layer name. The program concatenates this descriptive text automatically into each filename.
Working with Revit Architecture 2011 Models
You can enhance Revit plans, elevations, and section drawings in Photoshop, just as you can AutoCAD drawings. However, there is no easy way to automate Revit to output every layer as a separate image file. Therefore, our approach will be to export each drawing as a single image for later enhancement in Photoshop.
In the single-layer approach, we lose the ability to control lineweight in Photoshop, but this isn’t the end of the world. You can carry Revit’s default treatment of lineweight into Photoshop or force all lines to be as thin as possible prior to transfer. I’ll show you both methods because each has its strengths and weaknesses.
Note: If you own AutoCAD and Revit Architecture as many architects do, you’ll gain the most flexibility in Photoshop by exporting a DWG file from Revit, cleaning it up in AutoCAD, and proceeding to follow the AutoCAD instructions in the previous section.
Carrying Revit’s Default Treatment of Lineweight into Photoshop
Revit has built-in export functionality that supports raster image creation directly from Revit’s vector database. Perform the following steps to export an image from Revit:
1. Launch Revit Architecture 2011 and open the Basic sample project.
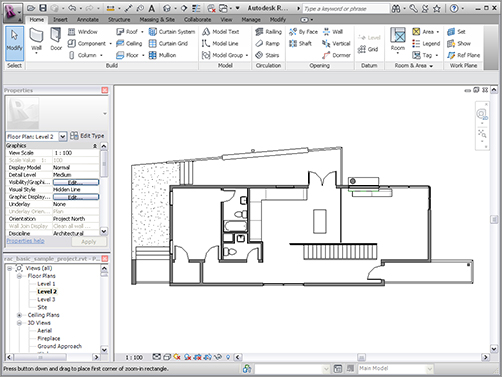
2. Double-click Level 2 in the View hierarchy panel. Revit automatically generates a 2D floor plan from the 3D building information model stored in its relational database (Figure 1-19).
Figure 1-19: Revit sample project Level 2 drawing
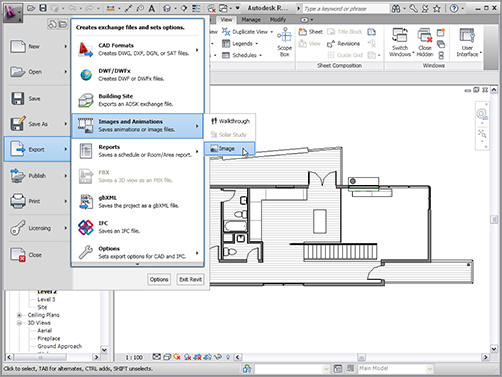
3. Choose Revit menu Export Images And Animations Image (Figure 1-20).
4. Click the Change button in the Export Image dialog box and then select a filename and path.
5. In the Image Size area, select Fit To, type 3000 pixels, and select Horizontal as the direction.
Figure 1-20: Exporting an image from Revit
6. Select Current Window in the Export Range area and set PNG as the format for nonshaded views (Figure 1-21).
Figure 1-21: Export Image settings in Revit

7. Click OK to create the Level2.png image file (Figure 1-22).
Figure 1-22: Image created through Revit’s export feature
Forcing All Lines to Be as Thin as Possible
In Revit Architecture 2011, the export image feature does not respect Revit’s Thin Lines mode. Thin Lines mode is useful if you want to forgo lineweights in Revit entirely. If you have a large monitor with a graphics card that supports a high enough resolution, you can take a screen capture to use as the basis for enhancement in Photoshop.
Exactly which resolution setting is good enough depends on many factors, including the physical size of the building you’re enhancing, its relationship to the graphic scale you’re working in, and the final size you hope to print the enhanced image from Photoshop.
Note: To maximize image quality, set your display resolution to the highest number of pixels before taking a screen capture.
The weakness of the screen-capture transfer method is that it is limited by the number of pixels displayed by your graphics card. However, this is the only way to export single-pixel-width lines from Revit. Here’s how it’s done:
1. In Revit, close the Properties and View hierarchy panels by clicking their Close buttons to maximize the amount of screen real estate occupied by the drawing itself.
2. Activate Thin Lines mode by clicking its button either on the Quick Access toolbar or on the View ribbon.
3. Select Hidden Line from the rendering menu at the bottom of the screen, if it’s not already selected (Figure 1-23).
Figure 1-23: Activating Hidden Line and Thin Lines modes
4. On the Mac, the default keyboard shortcut to save a picture of the screen as a file is Shift+Command+3. The keyboard shortcut for this feature can be changed under the Apple menu System Preferences Keyboard And Mouse Keyboard shortcuts. On Windows, press the Print Screen key to copy everything on the screen to the Clipboard. The Print Screen key is on most extended keyboards having numeric keypads (it might be abbreviated), but you might have to press a key combination to activate this function on a notebook computer.
Note: Screen-capture software is built into most operating systems and is also available from software vendors.
5. Launch Photoshop, and then press Command+N (Mac) or Ctrl+N (Windows). The width and height of the clipboard are automatically entered in the New dialog box.
6. Click OK and then Command+V / Ctrl+V to paste the image from the clipboard into the new document window.
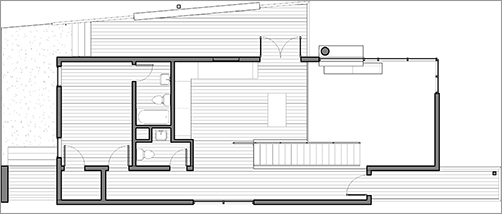
7. Choose Layer Flatten Image And File Save. Save the image as Level2thin.png. The final image is shown in Figure 1-24.
Figure 1-24: Screen-captured image with thin lines
Note: Neither of the methods for exporting images from Revit preserves graphic scale. Use AutoCAD or another CAD program that enables you to map a specific number of pixels to the drawing unit (such as inches or centimeters) if you want your enhanced drawings to print to scale.