Chapter 10. Troubleshooting Enterprise Mobility Suite
Ideally, your implementation will work smoothly and require minimum intervention other than the normal monitoring processes that were explained in the previous chapter. However, when deploying new technologies in your environment, it is common to face challenges that might require additional steps in order to work properly. This is where support comes in to perform proper troubleshooting of the problem. Because Enterprise Mobility Suite (EMS) is composed of three cloud services, there are different techniques that should be leveraged to properly isolate any issue and fix it.
In this chapter, you will learn key aspects of how to properly troubleshoot an issue regardless of the problem and then you will learn more details about the supportability capabilities of each cloud service available via EMS.
Troubleshooting methodology
If your car won’t start, you immediately believe something is wrong. You try again and, based on the sound that it makes, you create a hypothesis about what is causing the problem. You might try one more time and listen to the sound it makes to either be more confident regarding the accuracy of your hypothesis or create more than one hypothesis as to the cause of the problem. You try to implement steps to fix what you thought was the problem, but the car still will not start and continues to make the same sound. At this point, while you still have the problem, you have eliminated one possible cause of the problem.
Observing the behavior, taking notes of what you observe, formulating a hypothesis, and implementing steps that should address the root cause of the issue if the hypothesis is correct: this is what is known as troubleshooting. Several times experienced IT professionals fail to follow the correct troubleshooting sequence and fail to isolate the problem. However, a good troubleshooter understands the logic and how the process should flow. The process is always the same. Even if you don’t have deep product knowledge, you will still be able to identify and isolate the issue. You might not resolve the problem if you don’t have enough expertise, but you can complete the most difficult part of the process.
One of the biggest mistakes you can make during the troubleshooting process is to improperly scope the problem. For example, a user calls the helpdesk and says that his Internet is down. The first-level helpdesk technician needs to ask a broad range of questions to start troubleshooting the problem. When Internet access is lost, there can be several causes. What should the technician ask?
![]() Does the issue happen only when accessing this website or does it happen when accessing all websites?
Does the issue happen only when accessing this website or does it happen when accessing all websites?
![]() Which website are you trying to access?
Which website are you trying to access?
![]() When did this issue first occur?
When did this issue first occur?
![]() Did you make any configuration changes in the system?
Did you make any configuration changes in the system?
![]() Have you tried to access this website from another computer?
Have you tried to access this website from another computer?
![]() Does anyone else use this computer?
Does anyone else use this computer?
These sample questions will help you isolate the problem, eliminate hypotheses, and create new ones. For example, if the answer to the first question is “No,” the response should be “Try to access bing.com.” If it doesn’t work, you don’t even need to ask the second question and will move on to the third question. You might end the initial call with narrower scope, such as “The user, Adina, is having issues trying to access our organization’s website when he is using his computer; however, it works fine from another computer in the same network. No changes were done in the system according to the user and no one else has access to this computer.” This is a much better scope because here you have a specific behavior that you will troubleshoot further without wasting time trying things that are not relevant for this scenario.
Another important aspect of troubleshooting is to start with the basics; do not ignore simple mistakes. Sometimes experienced IT professionals might be caught trying to resolve issues on the application layer while the problem is actually in the network layer. A classic example of this is trying to resolve a connectivity issue using a browser by leveraging advanced debugging browser tools while the problem is that the host didn’t have a route to reach the destination. What about using the tracert tool before you start using advanced tools? This approach will save you time and make your troubleshooting much more effective because you are eliminating phases without jumping into an abstraction mode that will only lead you to create a false hypothesis of what could be the root cause of the problem.
This troubleshooting methodology can be applied in any situation and any product. It will evolve as you gain more experience with the platform and the product itself, which will allow you to think quickly and come up with a more accurate hypothesis that could be tested right away. The following list is a suggested troubleshooting flow that can assist you through this process:
1. Conduct an initial assessment Get a complete explanation of the problem, the symptoms that the user is experiencing, whether the user changed any setting in the system, when the issue started to happen, whether this capability ever worked, and whether the issue always happens or if it is random. If it is random, try to obtain more information regarding patterns; for example, ask questions like:
![]() Does it happen at a particular time of the day (morning, afternoon, or night)?
Does it happen at a particular time of the day (morning, afternoon, or night)?
![]() Are you doing any specific activity when you notice this issue happens (for example, while running a specific program)?
Are you doing any specific activity when you notice this issue happens (for example, while running a specific program)?
2. Create initial documentation Documenting all details that were obtained in the initial assessment is the key to successful troubleshooting. The documentation not only enables you to follow up and see what symptoms were, but it also helps you to create a knowledge base. By saving the documentation for all troubleshooting cases that you deal with, you will build a solid database that can be used for research and quick fixes based on similar issues.
3. Elaborate on one or more hypothesis After reviewing the initial documentation and all the data that was collected, elaborate on the potential hypothesis for the problem. Make sure you prioritize each hypothesis based on the likelihood each issue might be the problem. At this point you want to avoid trying several things at the same time; you want to avoid potential confusion while building your conclusion of what the real issue was.
4. Collect data The next step is to obtain data while the issue is happening. Configuring tools that you use to collect data while reproducing the issue can help to either confirm that you are headed in the right direction (your hypothesis is correct) or that you should look to different issues in the system.
5. Analyze the data Data analysis is a very important part of the troubleshooting process. Make sure you use the right tools to analyze the data. This will help not only to better interpret the output but also to make the process more agile. It is very important to emphasize that sometimes data analysis can take a long time. The amount of time depends on the amount of data that you have to analyze.
6. Create a plan of action Next, create an action plan and try to fix the issue. You should also evaluate how this action plan might affect productivity, asking yourself questions such as “What are the collaterals that might happen if I execute this?” At this point, you might not know the answer because you might not know the variants of the environment. Good communication is crucial. Ask questions about the environment and exchange ideas with your user regarding the potential consequences of the plan. The plan of action should be a step-by-step approach to help you track what you have done and make it possible for you to reverse what you’ve done, if necessary. It also helps other people from your organization to understand what has been done. The plan of action should be documented in the case notes.
7. Implement the plan of action The implementation should be carefully done to avoid disruption of the system (unless the system is already completely down). Make sure you understand the ramifications of the plan. For example, if during the implementation you need to install a hotfix, validate that the hotfix will restart the target machine. It is also very important to have a backup plan in case an implementation step causes other problems in the production environment.
8. Validate the results After implementing the action plan, you must validate whether the issue was resolved. At this point, you need to try to reproduce the same scenario that was occurring when the issue was detected. It is important to recognize that in some cases this is not possible. For example, random issues might not appear in normal circumstances, which means that you must leave the system in a monitoring state and wait to see if the issue happens again.
9. Create closure documentation After the problem is fixed, you need to document the final considerations regarding the implementation, behaviors observed, and the final results. It is important to write a conclusion for the case, stating the technical aspect of the problem and determining the root cause of the issue.
Knowing where to find information
If you are going to support a product, it is important to understand where that particular product stores information for troubleshooting purposes. Most Microsoft products store information in the Event Viewer, which is a good place to start to obtain information about the particular problem you are experiencing. However, in some situations, you might need a more detailed log that can give you more explanation about what’s happening at a particular point in time.
For a mobile workforce, knowing where the logs are located for each device platform can be challenging. Each platform might have its own requirements for increasing the logging information to verbose and also the location where the log is stored. Always refer to the vendor’s documentation for more information about support and operations.
Using troubleshooting tools
Troubleshooting tools can vary according to the platform and the troubleshooting scenario. Some platforms might offer a specific set of tools to collect data and another set of tools to automate the analysis. However, there are some scenarios in which generic tools can be used to obtain more information about the issue. For example, for network-related issues, you can use Network Monitor while reproducing the issue between the client device and the service (or service). If the traffic is encrypted, you can use Fiddler to assist you with obtaining and analyzing the data.
Note
You can download Fiddler at http://msdn.microsoft.com/en-us/library/windows/desktop/ff966510%28v=vs.85%29.aspx.
Ensure that you have a variety of tools available and that each platform that you have to support includes instructions on how to use those tools not only to obtain the data but also to interpret the logs that those tools will generate. Another strategy that can help when validating the results generated by those tools is to have a testing environment that can reproduce problems, obtain data, and analyze that data. You can use emulators for mobile devices and basically reproduce your production environment in a virtual lab.
You can download the Windows Phone 8.1 Emulator at http://www.microsoft.com/en-us/download/details.aspx?id=43719.
Troubleshooting EMS cloud services
When troubleshooting EMS, you should leverage the same methodology that was explained earlier in this chapter. In addition, consider the fact that you will be dealing with three cloud services, which means that the troubleshooting steps can get broader if you don’t have the correct scope of the issue. For example, if the helpdesk receives a call from a user saying that he can’t launch an app that he just installed via the company portal, this can be a very broad scope and more than one cloud service might be involved in this issue. Can it be the authentication? What about the permissions in the app? Can it be a local problem on that particular device? As you learned earlier in this chapter, these are questions that are part of the initial assessment and must be documented as part of determining the right scope for the problem.
In the sections that follow, you will learn more about troubleshooting best practices and techniques for each cloud service that is part of EMS.
Troubleshooting Azure AD Premium
For the most part, Azure AD Premium “just works,” but there are some areas that might be a little more difficult to configure or troubleshoot than others. This section describes a few common problems you might encounter while trying to use Azure AD Premium features and how to quickly resolve them.
As stated earlier in this book, everything begins with identity synchronization; if you cannot get that working seamlessly, it can impact your entire EMS deployment. You don’t need to worry about a maximum number of objects being synchronized into Azure AD with an EMS subscription, but to really get started, you will definitely need to have some user account information synchronized from your on-premises environment to the cloud.
The Azure AD Connect Wizard makes configuring AD FS and Single Sign-On (SSO) a breeze with its simple guided experience, but one thing that it does require when working its magic is Windows Remote Management (WinRM) functionality—the Microsoft implementation of the WS-Management Protocol that is firewall friendly because it operates over http and https. So when running the Azure AD Connect Wizard to implement directory synchronization, the remote server that you choose to install the Web Application Proxy server on must have WinRM enabled. If that server does not have WinRM enabled or configured, you will most likely get an error in the wizard that looks something like what is displayed in Figure 10-1.
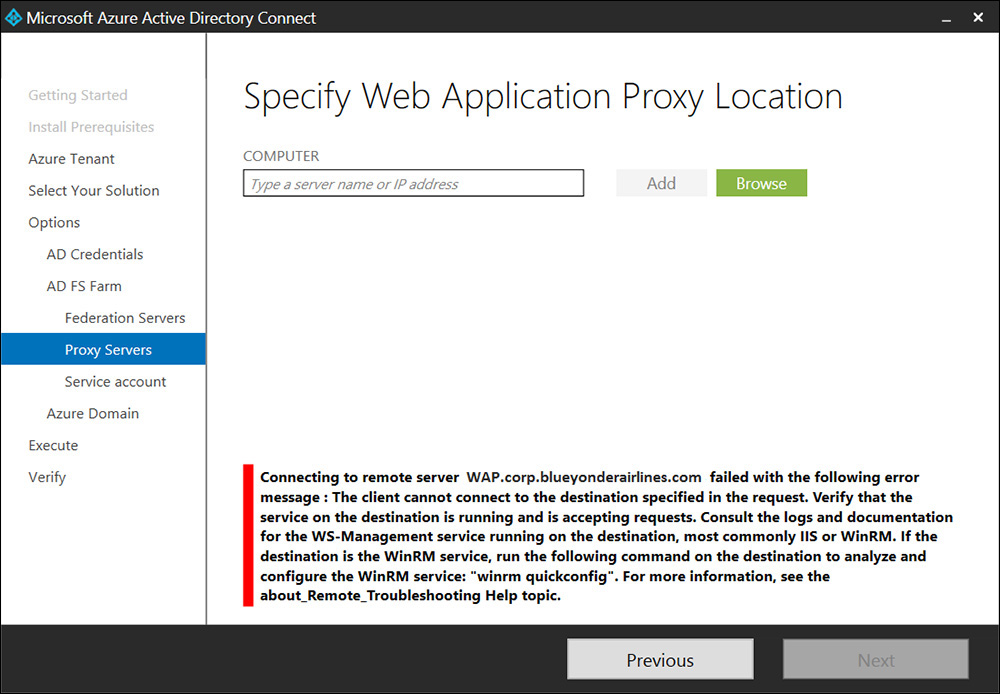
FIGURE 10-1 WinRM connection error while installing the Web Application Proxy using the Azure AD Connect Wizard
Fortunately, this issue is very easy to resolve by simply enabling the WS-Management protocol on the server you want to use as the Web Application Proxy. To accomplish this, you need only to open a command prompt with administrator permissions and use the winrm quickconfig command to set up the default configuration for remote management. If all goes well, you will see something like Figure 10-2 and the wizard should be able to continue.
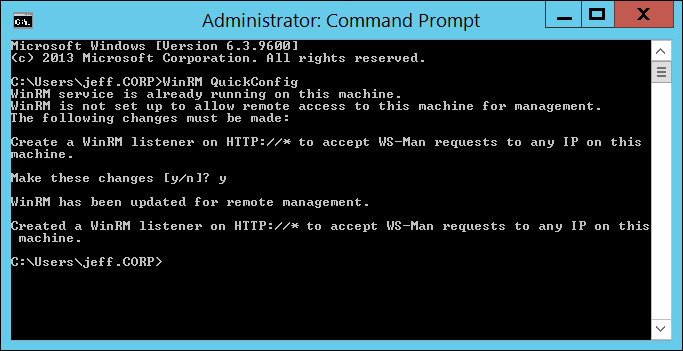
FIGURE 10-2 Using the winrm quickconfig command to set up the default configuration for remote server management
After successfully configuring identity synchronization and Active Directory Federation Services (AD FS), you will, of course, want to check to be sure everything is working properly. In most cases, everything will probably function just fine after using the Azure AD Connect Wizard, but if something is misconfigured or some other issue causes an interruption in identity authentication at a later date, you can quickly troubleshoot the issue using the Microsoft Connectivity Analyzer tool. This tool—which most Microsoft Exchange and Microsoft Office administrators are already familiar with—will help you to identify several problems related to your service—including SSO issues. This web-based tool is available at https://testconnectivity.microsoft.com/. From there, select the Client tab and then install and run the Microsoft Connectivity Analyzer Tool. Once it is installed and running, select the I Can’t Set Up Federation With Office 365, Azure, Or Other Services That Use Azure Active Directory option to begin the testing process and then sign in with a federated user account that you have synchronized with Azure AD. If any issues are discovered, you will see a page similar to that which is shown Figure 10-3.
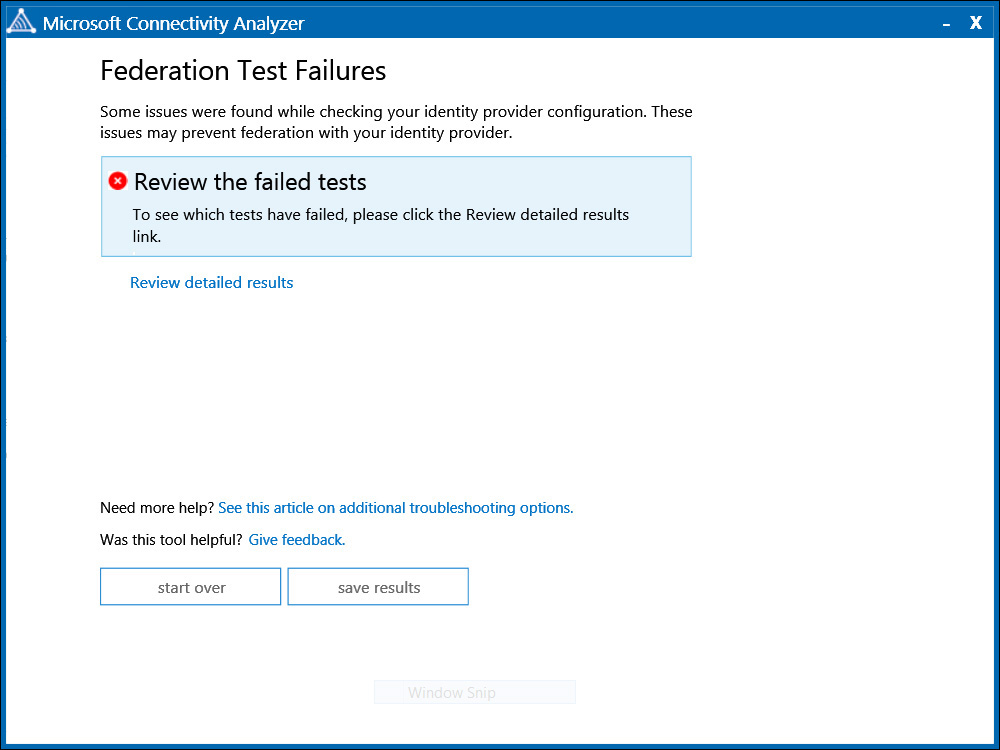
Clicking the Review Detailed Results option provides you with detailed information about any issues that were discovered that might prevent federation and identity authentication actions from being completed successfully.
Another behavior that you should be aware of is the delay in name resolution that can sometimes occur when reviewing Azure AD reports. For example, the first time that a user account is associated with one of the reports, the user name will be displayed as a seemingly random string of numbers, as shown in Figure 10-4.
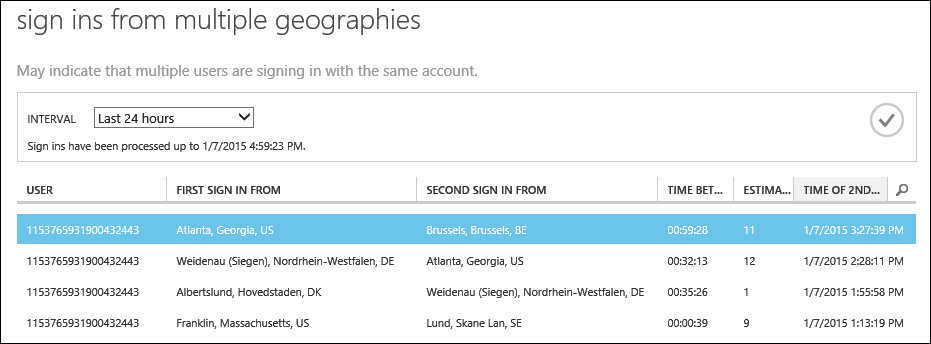
The good news is that this issue is transient and will resolve itself on its own. Most Azure AD reports run on a four-hour update cycle and any name resolution issues that you see like this should resolve themselves within that time period.
Troubleshooting Microsoft Intune
Just like Azure AD, Microsoft Intune will usually function without the need for much troubleshooting of the service itself. Even troubleshooting device enrollment is fairly straightforward if you have configured the back-end infrastructure properly. To check for known issues with your Microsoft Intune service, you can go to http://status.manage.microsoft.com. There, you can see the current service status of all available Microsoft Intune service instances by geography. If you do not know what service instance your specific account is part of, you need only to log into the Microsoft Intune Admin Console and navigate to Admin, Learn About, and then select View Service Status. This opens the service status webpage with the additional information about the service instance your account is a part of. In addition to determining whether there is a known issue affecting you, the information on this page is useful for determining when maintenance is scheduled for your service instance. However, when things go wrong in Microsoft Intune, it is usually related to either a mobile device policy not being applied properly or a problem that you need the device log files to troubleshoot.
One common example of a misconfigured policy setting is when you try to configure company Microsoft Exchange email account settings via policy. If one of your users has already manually configured a Microsoft Exchange account to sync on his device using the default email app, Microsoft Intune policy will be unable to delete the original email profile information in order to install the one you specified in the email policy for the device. When that happens, the device becomes noncompliant with policy and, if you have conditional access configured, might end up with that device being totally blocked from accessing Microsoft Exchange email. Because Microsoft Intune policy cannot uninstall the preconfigured Microsoft Exchange profile your users, they will get a message like the one shown in Figure 10-5.
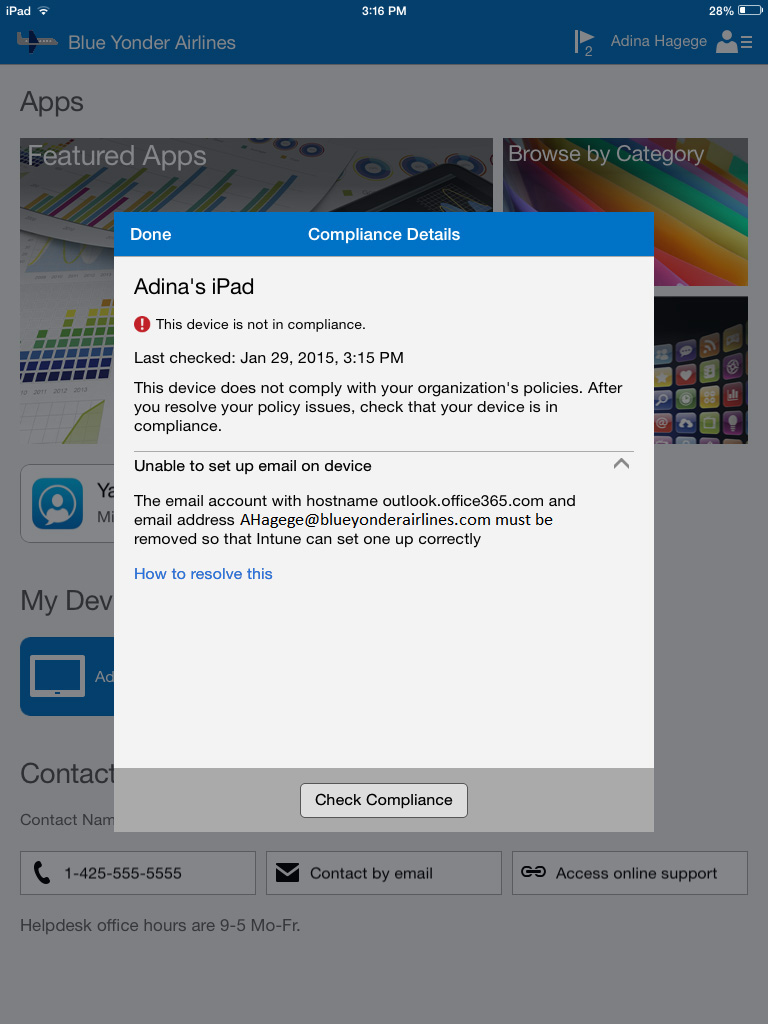
FIGURE 10-5 Compliance failure message when Microsoft Intune attempts to set up a Microsoft Exchange email profile that has already been manually configured
This issue is very easy for your users to resolve by simply going into their email settings, selecting the Exchange account they had previously configured, and then using the Delete Account option to remove the profile information from their devices. They can then go back into the Company Portal app to re-check for policy compliance. That will allow the Microsoft Exchange email policy to be configured in accordance with your corporate email configuration policy. When the email policy is applied, the company email profile will be installed and cannot be manually deleted. In fact, one way to verify that the email profile has been installed by policy is to check the email settings for your company Microsoft Exchange profile to verify that instead of seeing the Delete Account option, you see something similar to “These settings are installed by the profile ‘Eas Profile – [email protected].”
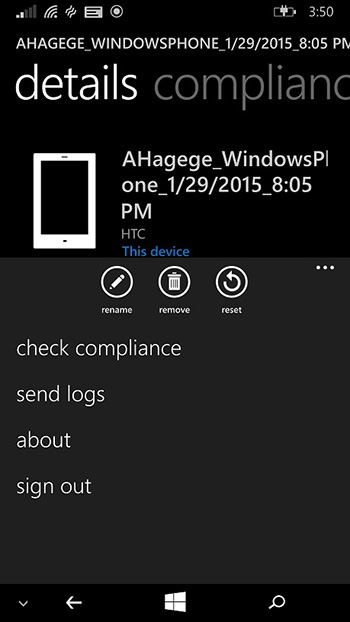
Another policy-related aspect of managing devices with Microsoft Intune is the latency in time from when a new mobile device management policy is deployed and when it is enforced on each type of device at their next normal policy polling interval (or when a new app is installed). To be sure that a user’s device has the latest Microsoft Intune policy applied, you can trigger a manual policy sync by using the company portal app to check for compliance or sync the device with the Microsoft Intune service, as shown on a Windows Phone in Figure 10-6.
Of course, knowing that you have the most current policy applied doesn’t help you much if you already know that a device is not compliant, but you don’t know what to do about it. In cases like this, the best way to troubleshoot the issue is from the device policy settings shown in the Microsoft Intune Admin Console. There you can learn more about what you need to do to resolve an issue by reviewing the information available about the setting and recommended actions to take for each policy issue discovered, as shown in Figure 10-7.
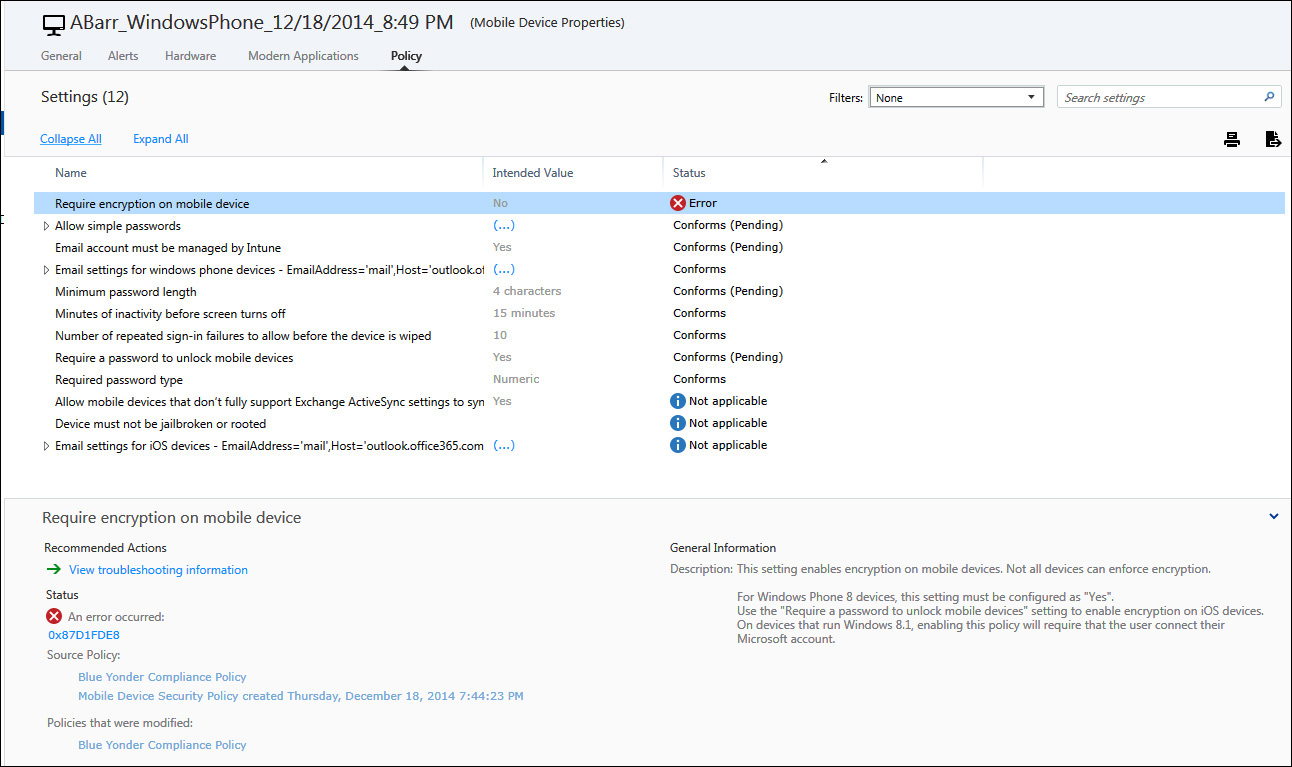
FIGURE 10-7 Information displayed for a device in the Microsoft Intune Admin Console about a policy error
The last line of defense for troubleshooting Microsoft Intune-managed mobile devices are the log files from the devices themselves. These are very simple for end users to access from the Company Portal app on all devices. Once obtained, all of the Company Portal apps already have built-in methods to share the log file results along with a screen shot to the administrator email address that you preconfigure in the Company Portal settings of the Microsoft Intune Admin Console. For Android and Windows devices, the log files can be generated and sent from simple menu options; iOS devices utilize a “shake and send” method of log file collection. With the Company Portal app open, you can just literally shake the iOS device to bring up the diagnostic information dialog on those devices, as shown in Figure 10-8.
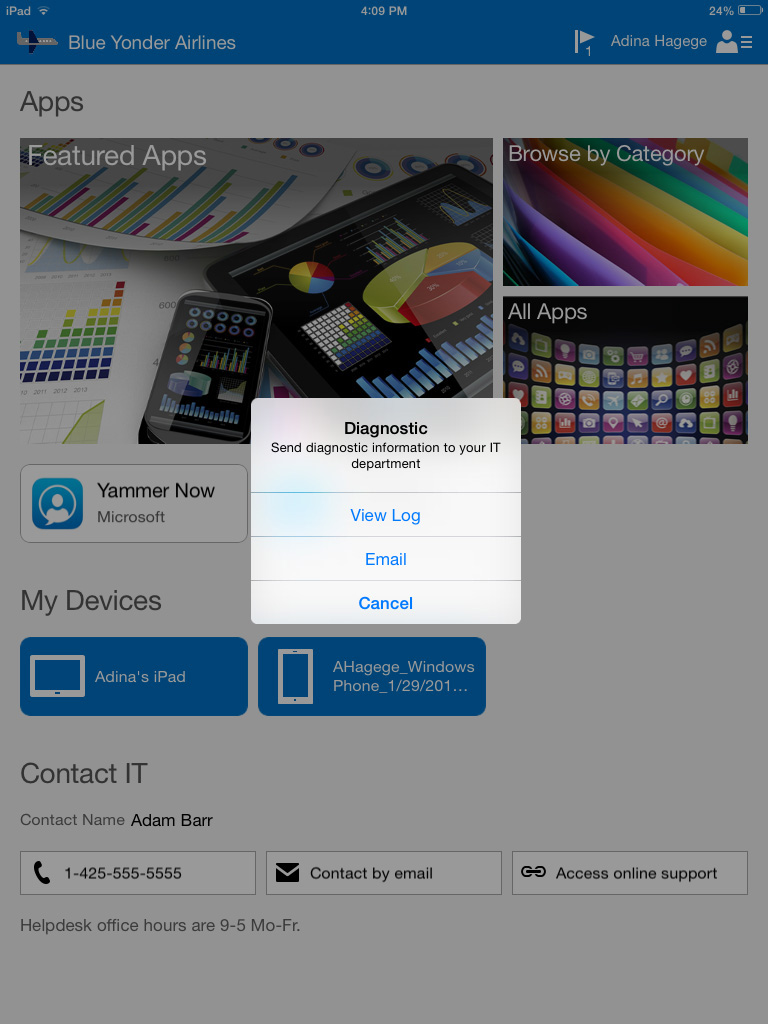
FIGURE 10-8 The diagnostic information dialog box displayed when you use the “shake and send” functionality for iOS devices
When you select the option to email the logs, the administrator email address defined in the Microsoft Intune Admin Console for the Company Portal administrator contact will receive an email describing the issue. The body of the email will contain information about the device such as model and operating system. The email will also inform the administrator about any alerts that were captured describing the issue such as the Company Portal being temporarily unavailable. Attached to the email will be a screen shot of the device’s screen when the logs were sent as well as a text log file named Company Portal-Log that contains detailed diagnostic information useful for further troubleshooting the issue.
Troubleshooting Azure Rights Management Services
As you learned in Chapter 8, setting up Azure Rights Management Services (RMS) is a pretty simple task; all of the configuration steps are done via the Azure Management Portal and once the configuration is completed, it will be up to the client to obtain that information. From that perspective, the cloud service itself usually is not the source of the troubleshooting unless the setup is wrong (for example, when a custom template is created and the permissions that you assigned to it are wrong). The problems that you might face that will require further troubleshooting are more related to the following areas:
![]() Client side issues
Client side issues
![]() Custom templates that are not available to the client
Custom templates that are not available to the client
![]() Authentication-related issues on the client
Authentication-related issues on the client
![]() Client configuration issues
Client configuration issues
![]() Azure RMS connector
Azure RMS connector
Depending on the source of the problem, the troubleshooting approach will be different, and the tools and the source of information will be different, too.
Troubleshooting the client side
One common misunderstanding about Azure RMS templates is that once you create or change them, they will be available to the client right away. There is an update interval for templates, which by default is 7 calendar days. In other words, the client will be retrieving updates from the server every 7 calendar days. Another misconception is that for that template to take effect, it needs to be updated on the client. But that is not necessarily true. For templates that were only modified, such as changes in the properties of the template, there is no need for that template to be refreshed on the user’s device. The change will take effect when the user is consuming the protected content.
Tip
For more information about the default intervals and how to change it in Office 2013, visit http://blogs.technet.com/b/rms/archive/2013/06/06/office-2013-ad-rms-client-2-x-and-template-distribution.aspx.
By knowing the expected behavior, you avoid taking unnecessary troubleshooting steps for something that it is working as it should. However, if the client is unable to receive the template even after the interval expires, you should start the troubleshooting by validating that the client can perform the service discovery (discover.aadrm.com). To do that, ensure that the edge firewall is allowing access to the following URLs for HTTPS (TCP/port 443):
![]() Incoming and outgoing connections to *.aadrm.com
Incoming and outgoing connections to *.aadrm.com
![]() Incoming and outgoing connections to *.cloudapp.net
Incoming and outgoing connections to *.cloudapp.net
To validate that this connection is working properly, use the following Windows PowerShell commands:
1. Open the Windows PowerShell command prompt with elevated privileges and type Import-Module AADRM.
2. Type Connect-AadrmService –verbose and wait for the authentication prompt. Make sure to use an account with global admin rights to perform this test.
3. Now that the connection is established, type Get-AadrmConfiguration. This command retrieves the Azure RMS configuration. Make note of the property LicensingIntranetDistributionPointUrl, because you will be using the value of this property in the next step.
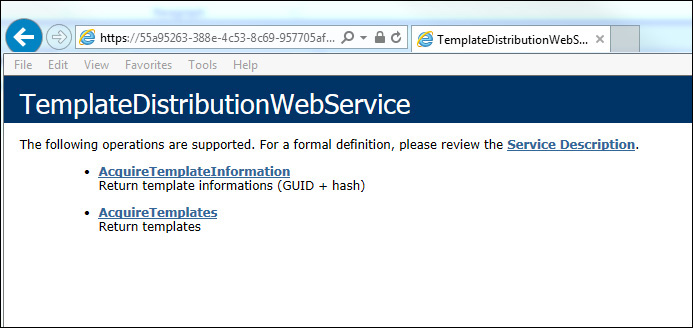
4. Open Internet Explorer and type the value of LicensingIntranetDistributionPointUrl and append the value templatedistribution.asmx. The entire URL should look similar to https://55a95263-388e-4c53-8c69-957705af910b.rms.na.aadrm.com/_wmcs/licensing/templatedistribution.asmx.
5. An authentication prompt might appear if you are not yet authenticated. Type the user’s credential and verify that you can see the Template Distribution Web Service, similar to Figure 10-9.
If your browser cannot reach this URL, the RMS client won’t be able to either, which means that you need to troubleshoot network connectivity issues. Verify whether your client needs to have a proxy or whether your edge firewall is blocking this URL. If your browser is able to open this page, go back to Windows PowerShell and use the following sequence to obtain more information about the template that is failing to load:
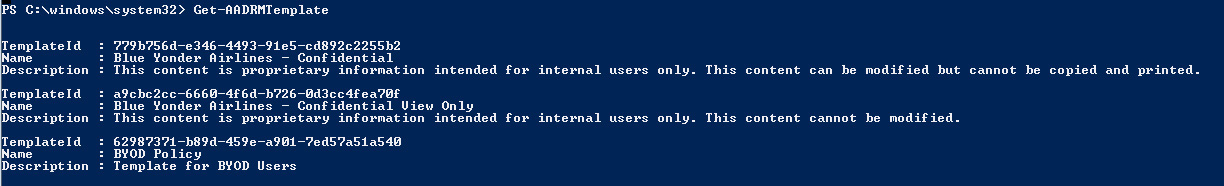
1. List all templates available by using the command Get-AADRMTemplate. Take note of the TemplateId that represents the template that you are not able to see in the RMS client (for example, Microsoft Outlook). The output of this command should look similar to Figure 10-10.
2. Type Get-AADRMTemplateProperty -RightsDefinitions -Templateid (using the TemplateId from the previous step). In the value column of the output, ensure that the permissions are set up correctly.
One common mistake you’ll find is that the user does not belong to the groups that are allowed to see the template. Make sure to confirm that before you proceed.
Tip
If you still experience problems on the client, more advanced troubleshooting will be necessary. For that, you can use the IRM Diagnostic Tool, which can be downloaded at http://www.microsoft.com/en-us/download/details.aspx?id=43737.
Troubleshooting the Azure RMS connector
In Chapter 8, you learned how to implement the Azure RMS connector and the prerequisites for installing this tool. It is recommended to have multiple servers with the Azure RMS connector installed for high-availability purposes.
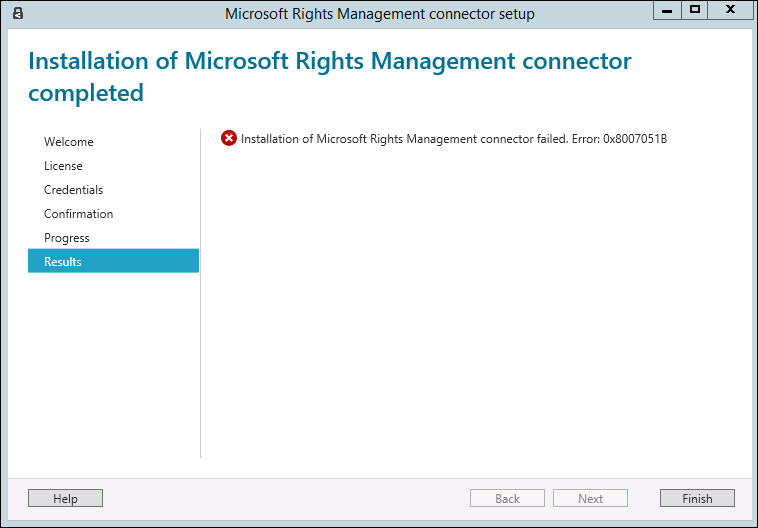
Because the server that will have the Azure RMS connector is a member server, make sure that you have administrative rights on the local machine. Even if you log on as a domain administrator, if this account does not have administrative privileges on the server itself, you might receive the error shown in Figure 10-11 while installing the connector.
This can be a very challenging problem to solve because the error message doesn’t really explain why the problem occurred. In scenarios like this, you need to read the log file created by Azure RMS during the installation. This log is located in the user’s %temp% folder, as shown in Figure 10-12.
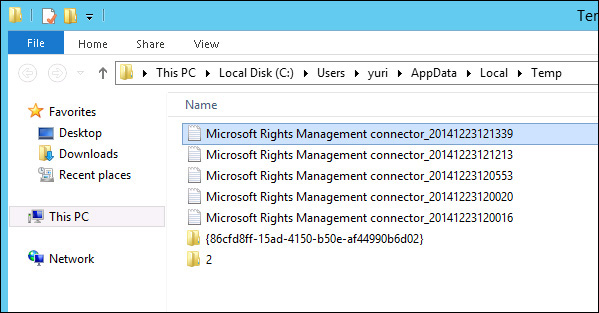
FIGURE 10-12 The location where the log files generated by the Azure RMS connector setup tool are stored
The best way to troubleshoot issues of this nature is to read all the way to the end of the file and trace it back to see where the error occurred. In this case, the error is highlighted in Figure 10-13.
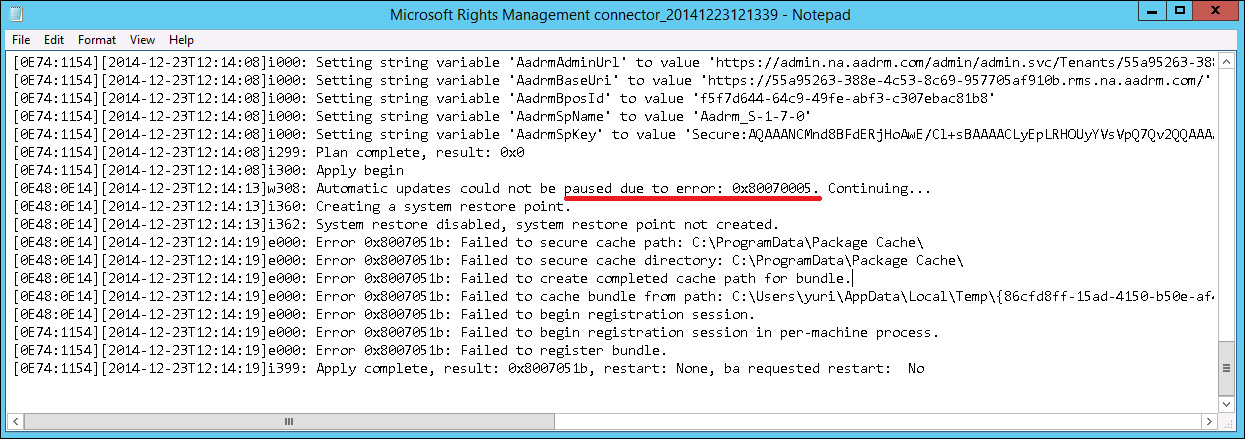
By using the err tool, you will find out that the error 0x80070005 means access was denied, as shown in the output of the command:
err 0x80070005
# for hex 0x80070005 / decimal -2147024891 :
COR_E_UNAUTHORIZEDACCESS corerror.h
# MessageText:
# Access is denied.
DIERR_OTHERAPPHASPRIO dinput.h
DIERR_READONLY dinput.h
DIERR_HANDLEEXISTS dinput.h
DSERR_ACCESSDENIED dsound.h
ecAccessDenied ec.h
ecPropSecurityViolation ec.h
MAPI_E_NO_ACCESS mapicode.h
STIERR_READONLY stierr.h
STIERR_NOTINITIALIZED stierr.h
E_ACCESSDENIED winerror.h
# General access denied error
# 11 matches found for "0x80070005"
You can download this tool from http://www.microsoft.com/en-us/download/details.aspx?id=985. Although the download page says Exchange, you can use it to interpret 0x800 error codes from any Microsoft product.
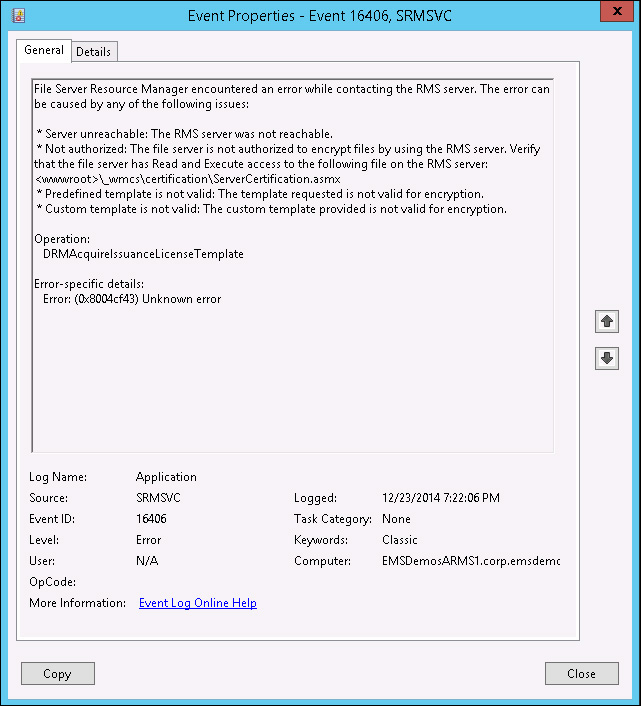
Another common mistake that can happen is to have the RMS connector on the same server as the role that you want to use to leverage Azure RMS (for example, the File Server role). If you want to have Azure RMS templates retrieved by the File Server, the Azure RMS connector should not be installed on the File Server itself. This type of mistake can cause the event shown in Figure 10-14 to happen when the Azure RMS connector tries to retrieve the templates in Windows Event Viewer.