3
Weight Prediction, Optimization, and Energy Efficiency
Over the many decades of commercial airplane development designers have focused on minimizing the maximum take‐off weight. More recently, the progressively increasing fuel prices and environmental constraints have shifted the emphasis to reducing fuel burn‐off. In view of the large fuel weight fraction of a high‐speed airliner, reducing the mission fuel has to get even more emphasis than for a subsonic airliner. However, weight engineering is a highly iterative process, and an accurate weight breakdown is not available until the conceptual design phase is completed. Reference is made to [4] for a discussion on the various types of weight prediction methods and an explanation of a typical methodology that can be used for early prediction of the major weight components. The following text is primarily intended to demonstrate the sensitivity of the airplane's all‐up weight (AUW) to the flight efficiency, thereby emphasizing the importance of the lowest possible drag and high propulsive efficiency in cruising flight.
3.1 The Unity Equation
The separation of basic functions for classical airplane configurations allows us to decompose the AUW of the aircraft when taking off for flying the design range with the design payload, using the following symbols:
 – maximum take‐off weight (MTOW)
 – operating empty weight (OEW)
 – design payload (DPL)
 – block fuel weight (TFW).
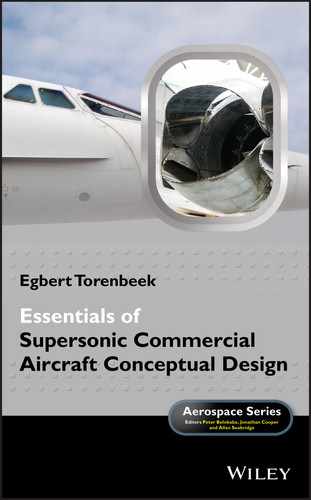
The following expression, stating that the sum of all basic weight fractions contributing to the MTOW equals one, is known as the “unity equation”:
Depending on the availability of design information, the unity equation can be manipulated in various ways by further breaking down the three basic weight components. Using Equation (3.1) offers the advantage that the sensitivity of the weight distribution to the most influential design characteristics is obtainable without resorting to cumbersome iterative design cycles.
The present approach was originally developed for subsonic jetliners but the basic method is applicable to supersonic aircraft as well, on the provision that various weight terms have been calibrated with data of existing or projected aircraft in the same category of supersonic designs. The prediction has class I accuracy and can be used for the early design cycle of supersonic transport as well as a supersonic executive aircraft. For example, application to the Concorde weight distribution was successful mainly due to the availability of data on the aerodynamic and the overall propulsive efficiencies in cruising flight. In order to make a credible assessment of leading technological parameters, these efficiencies can be inserted as independent design variables.
3.2 Early Weight Prediction
The MTOW of a commercial transport is typically determined by the design mission range ![]() that can be traveled with the design payload
that can be traveled with the design payload ![]() . The mission range is usually determined by the number of passenger seats to be installed in a cabin in mixed class seat arrangement. Alternatively, the MTOW may be derived from the distance to be flown with the payload in high‐density seating, the harmonic range
. The mission range is usually determined by the number of passenger seats to be installed in a cabin in mixed class seat arrangement. Alternatively, the MTOW may be derived from the distance to be flown with the payload in high‐density seating, the harmonic range ![]() . Although flying the design mission range requires significantly more fuel than flying the harmonic range, the airplane takes off with the same MTOW for both missions. This process may require two design cycles, resulting in different weight breakdowns.
. Although flying the design mission range requires significantly more fuel than flying the harmonic range, the airplane takes off with the same MTOW for both missions. This process may require two design cycles, resulting in different weight breakdowns.
3.2.1 Empty Weight
The empty weight fraction of subsonic airliners varies roughly between 0.65 for short‐range aircraft and 0.45 for long‐range aircraft. An empty weight prediction based on statistics can be made as soon as the fuel weight fraction is known [4]. However, early empty weight estimations of an SCT generation may suffer from inaccuracies of at least 10%, resulting in considerable problems during the more advanced stages of the development. An extreme example of weight growth during the design development phase is the Concorde, whose MTOW increased from about 60,000 kg in the early design stage to 185,000 kg for the final production version. Remarkably, Concorde's empty weight fraction turned out to be only 0.44, a statistically normal percentage regarding its large total fuel weight of approximately 50% of the MTOW.
The decomposition of the OEW is based on the assumption that the DPL, the MTOW, and the installed take‐off thrust ![]() are the principal components affecting the empty weight as follows:
are the principal components affecting the empty weight as follows:
including the following three components:
- The first bracketed term, denoted as the body group, represents the fuselage weight, which is determined primarily by the fuselage dimensions and the maximum number of seats in the passenger cabin. Other components belonging to this category are the weight of cabin furnishings and equipment, and operator items. Since the vertical tail size is determined primarily by the fuselage geometry and the cabin configuration, its structure weight is also classified as a body group weight component1. The factor
 for subsonic single‐deck airliner fuselages depends primarily on the number of seats abreast in the main cross‐section. Typical (approximate) values for narrow‐ and wide‐body subsonic transport are
  and
and  , respectively.
 - The second term – referred to as the airframe weight – summarizes components that are sized mainly to the MTOW defining the critical loading condition,
 . The wing structure and the landing gear typically belong to this category since their weights are considered functionally and statistically proportional to the MTOW. The wing structure weight fraction of subsonic airliners varies typically between 0.09 and 0.13, and if a horizontal tail or a fore‐plane is present its weight can be assumed to be proportional to the wing structure weight. Concorde's wing structure weight fraction of not more than 0.074 can be ascribed to the low aspect ratio, high inertia relief due to fuel, and the absence of complex high‐lift devices. Similar to subsonic transports, Concorde's twin‐leg main landing gear has a weight fraction of 0.039. However, due to the plane's high thrust/weight ratio, its power plant weight fraction of 0.13 is much higher than the typical 0.08 for subsonic jetliners.
Statistics indicate that for present‐day subsonic jetliners
 is between 0.20 and 0.22. Taking into account that Concorde was designed during the 1960s, its airframe weight fraction
  is considered to be fairly low.
 - The third term represents the installed power plant weight, which amounts to typically 30% of the total installed thrust; hence
 .
. - The factor
 allows for on‐board power systems such as the environmental control system, hydraulic generation and distribution, electrical generation, distribution, and flight controls. The use of this term indicates that the system weight depends on the cabin capacity as well as the MTOW. Design studies from the past suggest that
  may be considered as a realistic guess for a supersonic airliner.
 - The term
 represents a nominal weight of items present in all passenger aircraft, independent of their size and flight speed: flight deck crew and its accommodation and instrumentation. From statistical information it is concluded that this component depends mainly on the cabin cross section. Calibration of the method for subsonic airliners indicated that for single‐deck jetliners
  kg. This weight component forms a small fraction of the OEW for large airliners but a significant component for and executive aircraft, whereas according to [10] the complex variable geometry nose has no given weight problem.
Calibration of the factors of proportionality in Equation (3.2) is hampered by the fact that the available SCT information database is very small. Only the Concorde and the TU‐144 have actually flown, whereas most of the information available on the SST projects developed in the USA during the 1960s has not been validated by prototype product information and flight performance. Indeed, the scarce data available on SCT development during the 1960s has become obsolete and needs to be updated in order to become useful for a future design.
It is worth noting that an expression similar to Equation (3.2) was discussed by Küchemann in [1] where he introduced “structural factors” with similar definitions and numerical values as ![]() and
and ![]() . He used the following values available for Concorde:
. He used the following values available for Concorde: ![]() and
and ![]() . However, the definitions of these terms are not unambiguous and Küchemann commented that the structural factors are rather conservative values based on present technology and we should be able to achieve
. However, the definitions of these terms are not unambiguous and Küchemann commented that the structural factors are rather conservative values based on present technology and we should be able to achieve ![]() and
and ![]() in a decade or two. This information is in accordance with the present text.
in a decade or two. This information is in accordance with the present text.
3.3 Fuel Weight
The total amount of fuel when taking off consists of mission fuel weight ![]() – derived from the design mission range
– derived from the design mission range ![]() – and reserve fuel with weight
– and reserve fuel with weight ![]() . Mission fuel analysis of a synthesized design with known performance characteristics requires computation of the fuel burned during all sectors of the flight: take‐off, climb, and acceleration to cruise altitude, cruising flight, descent, approach, and landing. Such an analysis is not feasible in the early design stage since most of the required information on the aerodynamic properties and the power plant is not yet available. An efficient solution of this problem is obtained by computing the required cruise fuel as accurately as possible and add a quasi‐analytical allowance for additional fuel required for the other flight phases. This approach, published in [1], has been applied in the present case, albeit adapted to an SCV.
. Mission fuel analysis of a synthesized design with known performance characteristics requires computation of the fuel burned during all sectors of the flight: take‐off, climb, and acceleration to cruise altitude, cruising flight, descent, approach, and landing. Such an analysis is not feasible in the early design stage since most of the required information on the aerodynamic properties and the power plant is not yet available. An efficient solution of this problem is obtained by computing the required cruise fuel as accurately as possible and add a quasi‐analytical allowance for additional fuel required for the other flight phases. This approach, published in [1], has been applied in the present case, albeit adapted to an SCV.
3.3.1 Mission Fuel
Since the conditions for quasi‐stationary cruising flight are valid for subsonic as well as supersonic flight, Bréguet's generalized range equation can be used for computing the range in cruising flight (index cr):
Equation (3.3) applies to a flight with constant Mach number and angle of attack. The calorific value of fuel per unit of mass ![]() is incorporated in (Equation 3.3) in the form of a reference range
is incorporated in (Equation 3.3) in the form of a reference range ![]() for kerosene fuel and the aircraft gross weight for the initial and end conditions of the flight are
for kerosene fuel and the aircraft gross weight for the initial and end conditions of the flight are ![]() and
and ![]() , respectively. The range parameter
, respectively. The range parameter ![]() is identical to the flight efficiency
is identical to the flight efficiency ![]() which was introduced in Chapter 2 and prediction of the aerodynamic efficiency
which was introduced in Chapter 2 and prediction of the aerodynamic efficiency ![]() will be treated in Chapter 7. Although Bréguet's equation represents the theoretical condition for the maximum range in quasi‐steady flight, long‐range flights are mostly executed with a stepped cruise/climb schedule.
will be treated in Chapter 7. Although Bréguet's equation represents the theoretical condition for the maximum range in quasi‐steady flight, long‐range flights are mostly executed with a stepped cruise/climb schedule.
According to [4] the fuel fraction required for such a sub‐optimum flight can be approximated as follows:

It is worth noting that the factor 0.5 in the denominator of Equation (3.4) stems from a Fourier series approximation of the natural logarithm, indicating that the average specific range is assumed to be equal to the nominal specific range when 50% of the cruise fuel has been consumed. Since the cruising flight is treated as a quasi‐steady motion, ![]() is considered to be constant and equal to its initial value. For a typical HSCT cruise fuel fraction
is considered to be constant and equal to its initial value. For a typical HSCT cruise fuel fraction ![]() = 0.40, the Bréguet range according to Equation (3.3) is 2% longer than the range obtained from Equation (3.4).
= 0.40, the Bréguet range according to Equation (3.3) is 2% longer than the range obtained from Equation (3.4).
The reduced specific range during non‐cruising flight sectors is accounted for by adding lost fuel, which is primarily determined by the plane's energy height at the top of the climb and by the reduced specific range at low flight speeds and altitudes. The lost fuel and the additional fuel required for maneuvering are taken into account by increasing the range in cruising flight by the lost range ![]() . The fuel required to fly the design mission is thus obtained by replacing the cruise range in Equation (3.4) by the equivalent all‐out range
. The fuel required to fly the design mission is thus obtained by replacing the cruise range in Equation (3.4) by the equivalent all‐out range ![]() , resulting in
, resulting in
The difference between cruising and off‐design flight conditions can have a significant effect on the equivalent all‐out range, in particular for short flights. An approximation for the lost range derived in [9] leads to the suggestion to use ![]() for a long‐range SCT mission.
for a long‐range SCT mission.
3.3.2 Reserve Fuel
Accurate computation of the reserve fuel weight can be as cumbersome as computing the mission fuel weight. Fortunately, the early design stage of a subsonic airliner does not require such an effort since statistics indicate that reserve fuel weight is mostly between 4% and 5% of the MTOW and it is suggested to estimate the reserve fuel from
The subsonic flight conditions of SCT are, however, quite different from those during supersonic cruising and reduced flight efficiency values must be used for reserve fuel prediction. For Concorde this resulted in a reserve fuel weight of 6.5% of the mission fuel, not much different from its maximum payload fraction. This subject is associated with the discrepancy between cruise conditions and off‐design flight conditions of an SCT and it is likely that an optimized supersonic configuration featuring variable geometry will not suffer from Concorde's exceptional reserve fuel fraction.
3.4 Take‐off Weight and the Weight Growth Factor
The MTOW required to comply with the design mission is obtained by adding the maximum payload, the OEW according to Equation (3.2), the mission fuel according to Equation (3.5), and the reserve fuel according to Equation (3.6), resulting in the following closed form expression:

Statistics have shown that, for a given fuel weight fraction, the empty weight fractions of subsonic and supersonic long‐range aircraft are not very different. In the early phase of the design effort the designer's primary concern should therefore be focused on reducing the mission fuel weight required to comply with range requirements which is determined to a large extent by the range factor ![]() . Nevertheless, if during the downstream design process the empty weight of SCT has to be increased by a small amount
. Nevertheless, if during the downstream design process the empty weight of SCT has to be increased by a small amount ![]() , this causes the gross weight to increase by
, this causes the gross weight to increase by ![]() which is considerably larger than the initial
which is considerably larger than the initial ![]() , provided the requirement is incurred that the design payload versus range performance must not deteriorate. This may result in time‐consuming weight iterations, unless Equation (3.7) is used to solve for
, provided the requirement is incurred that the design payload versus range performance must not deteriorate. This may result in time‐consuming weight iterations, unless Equation (3.7) is used to solve for ![]() . The result is expressed in terms of the “weight growth factor” defined as
. The result is expressed in terms of the “weight growth factor” defined as

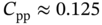
where the mission fuel weight fraction is the most influential term that increases nearly proportional to the equivalent design range. Since for a long‐range SCV the total fuel load may exceed 50% of the MTOW, the growth factor increases rapidly with the range and tends asymptotically to infinity for the ultimate (equivalent) range,

In order to avoid redesign iterations after an empty weight increment from becoming a diverging process, the range according to Equation (3.9) must be (considerably) longer than the required design mission range.
It is worth noting that the present method for predicting the weight breakdown is basically valid for subsonic as well as supersonic cruise vehicles. However, if a subsonic and a supersonic transport designed for the same payload and range are compared with the same weight prediction method, their OWE, MZFW, and MTOW exhibit large differences. The dominating reason for this is found mainly in the difference between the range factors ![]() of the two designs. For example, the range factor for a present day long‐range subsonic airliner in cruising flight amounts to
of the two designs. For example, the range factor for a present day long‐range subsonic airliner in cruising flight amounts to ![]() typically, whereas design studies of a second generation supersonic airliner indicate that according to Figure 2.4
typically, whereas design studies of a second generation supersonic airliner indicate that according to Figure 2.4 ![]() may be achievable. The next section will illustrate how the methodology exposed in this chapter can be applied to make an early assessment of the design weight sensitivity to variations in mission requirements and technological input parameters.
may be achievable. The next section will illustrate how the methodology exposed in this chapter can be applied to make an early assessment of the design weight sensitivity to variations in mission requirements and technological input parameters.
3.5 Example of an Early Weight Prediction
The following example published in [11] is based on design specifications of the CISAP Joint Research and Technology Cooperation agreement between Airbus Industrie and AREA partners DLR, NLR, ONERA, and QinetiQ. The baseline mission is to carry 250 passengers in mixed‐class seating over a distance of 10,000 km at Mach 2.0 cruise speed. However, the CISAP project participants studied alternative designs with cruise Mach numbers 1.30, 1.60, and Mach 2.0. The following example is based on mission requirements for the baseline ESCT configuration described in Section 1.5, summarized as follows:
- Payload: 250 passengers in three class layout.
- Supersonic cruise speed: Mach 2.0. A cruise/climb profile can be assumed with the aircraft flying at the optimum altitude for each weight. Subsonic cruise speed: Mach 0.95.
- Design mission range: 10,000 km, including an outbound subsonic leg of 50 km, flown with the same specific range as the supersonic cruise sector.
- Reserves: 4% block fuel; 463 km diversion at 10,500 m altitude; hold for 30 min. with 463 km
 at 4,500 m altitude.
 - Take‐off distance not exceeding 3000 m.
- Landing approach speed not exceeding 300 km
 .
.
3.5.1 MTOW Sensitivity
The basic weight weight distribution is derived by inserting the following educated guesses into Equation (3.7):
- Fuselage group weight: 150% of the volumetric payload; hence,
 .
. - The wing structure weight is sensitive to the parameters affecting the aerodynamic efficiency, in particular the MTOW and the wing planform geometry. Since wing geometry is the most influential component for optimizing the vehicle's configuration, its structure weight fraction is treated as a selection variable.
- The power plant weight is based on a typical take‐off thrust/weight ratio of 0.35, an engine dry weight/thrust ratio of 0.20 and an additional 30% for engine accessories, intakes and engine mounts, resulting in an installed weight fraction of 0.091.
- The undercarriage weight fraction of 0.044 is assumed for a three‐leg main gear.
- The reserve fuel fraction
 is midway between subsonic airliners and Concorde.
 - The on‐board power systems weight equals 12% of the payload‐dependent as well as the MTOW‐dependent OEW components. Hence,
 .
.

Figure 3.1 MTOW of Mach 2.0 SCT versus the range parameter and the wing weight.
These assumptions yield a structural factor ![]() and, for a lost range
and, for a lost range ![]() , the equivalent all‐out range amounts to 10,870 km. The zero‐fuel weight (ZFW) is obtained from summation of the previous items,
, the equivalent all‐out range amounts to 10,870 km. The zero‐fuel weight (ZFW) is obtained from summation of the previous items,
and the take‐off gross weight required to comply with the above mentioned requirements is found by substitution of the structural factors into Equation (3.7),

As an example of a conservative design we assume a “year 2000 feasible” aerodynamic efficiency ![]() and an overall propulsive efficiency
and an overall propulsive efficiency ![]() which yields a range parameter
which yields a range parameter ![]() . For an assumed wing structure weight fraction of 0.10, the MTOW required to realize the mission equals 365,000 kg. The corresponding payload fraction is about 15% higher than Concorde's payload fraction. This performance must be considered as unsatisfactory for next‐generation SCT and it is necessary to investigate technological advancements required to increase the range parameter and/or design models leading to reduced wing structure weight. Figure 3.1 depicts the MTOW as a function of the wing structure weight fraction and the range parameter in cruising flight
. For an assumed wing structure weight fraction of 0.10, the MTOW required to realize the mission equals 365,000 kg. The corresponding payload fraction is about 15% higher than Concorde's payload fraction. This performance must be considered as unsatisfactory for next‐generation SCT and it is necessary to investigate technological advancements required to increase the range parameter and/or design models leading to reduced wing structure weight. Figure 3.1 depicts the MTOW as a function of the wing structure weight fraction and the range parameter in cruising flight ![]() . It shows that, due to the high fuel weight fraction, the MTOW is more sensitive to the range parameter than to the wing weight fraction – a typical property of long‐range aircraft designed for supersonic cruising. In this initial weight study we therefore focus on improving the range parameter. For instance, a realistic aim for advanced future second generation SCT could be the achievement of
. It shows that, due to the high fuel weight fraction, the MTOW is more sensitive to the range parameter than to the wing weight fraction – a typical property of long‐range aircraft designed for supersonic cruising. In this initial weight study we therefore focus on improving the range parameter. For instance, a realistic aim for advanced future second generation SCT could be the achievement of ![]() according to Figure 2.4; that is, 33% higher than Concorde's range parameter. For a wing structure weight fraction of 0.10 the MTOW predicted according to Equation (3.11) amounts to 304,000 kg, corresponding to an OWE fraction 0.42 and a total fuel weight fraction of 0.49. The resulting payload fraction of 0.09 is one third higher than Concorde's payload fraction, which was achieved with
according to Figure 2.4; that is, 33% higher than Concorde's range parameter. For a wing structure weight fraction of 0.10 the MTOW predicted according to Equation (3.11) amounts to 304,000 kg, corresponding to an OWE fraction 0.42 and a total fuel weight fraction of 0.49. The resulting payload fraction of 0.09 is one third higher than Concorde's payload fraction, which was achieved with ![]() . Achieving
. Achieving ![]() = 4.50 will, however, require a major effort from the aerodynamic designers involved in the development of an advanced second generation CST with similar stringent top level requirements as assumed for this example.
= 4.50 will, however, require a major effort from the aerodynamic designers involved in the development of an advanced second generation CST with similar stringent top level requirements as assumed for this example.
The weight sensitivity of the design cycle is further clarified by assuming that downstream in the more detailed design process the wing structure weight appears to be 10% heavier then initially predicted. In that case the MTOW increases by 5.5% to 385,000 kg, whereas in the case of a 10% reduction of the range parameter the MTOW would increase by 20% to 440,000 kg. If, on the other hand, the aerodynamic and the propulsive efficiencies could both increase by 10%, the MTOW would decrease by a sensational 24% to 277,000 kg. The message is that fairly modest future improvements in the structural, aerodynamic, and propulsion characteristics compared to values which were considered realistic in the year 2000 may lead to a substantial weight reduction for a next‐generation advanced SCT design.
3.6 Productivity and Energy Efficiency
The payload fraction that can be carried for a given range is derived from Equation (3.7),

Equation (3.12) is useful to compute the range for the “conservative design” achievable with the same MTOW and a mixed‐class seating for 250 passengers, which is more representative of the operation of a long‐range SCT. This results in an achievable distance of 11,000 km, an attractive range for this comfortable high‐speed transport over long routes. Maximizing the payload fraction has an impact on the productivity, the environmental quality and the operating costs. Although top level requirements normally specify constraints on the seating capacity as well as on the design range, it is useful to have an insight into the effects of varying both characteristics simultaneously. The following considerations inspired by [5] emphasize the importance of maximizing the productivity and the energy efficiency of a transport aircraft. The payload versus range diagram in Figure 3.2 illustrates the transport capability of the airplane and its profit potential. The upper and right portion of the chart represents the envelope of payload and range capability consisting of three straight sectors. The horizontal sector of the diagram represents the maximum weight – or volume‐limited payload – its length equals the harmonic range when taking off with the maximum MTOW. The oblique sector is the range achievable when the plane takes off with the MTOW and reduced payload. The near‐vertical sector defines the range achievable with fuel tanks filled to their capacity. The area under the payload‐range envelope represents the productivity, an important feature of a transport aircraft for judging its commercial value. The productivity is primarily determined by the product of the maximum payload and the harmonic range.
A high productivity forms an important factor to increase the potential operational profit. On the other hand, the operating costs incurred with achieving a high productivity increase with increasing MTOW. We intend to demonstrate that, for a given MTOW, there exists a stretch of design mission ranges for which the productivity has a (near‐)maximum value. The curved envelope in Figure 3.2 on the lower and left region of the payload‐range chart defines the payload or the number of seats passengers that must be carried to pay for the airplane's operation. The curved envelope on the lower and left region of the payload‐range chart defines the payload and the number of passengers that must be carried to pay for the airplanes operation For very short ranges all seats installed in the cabin must be filled to break even, which is ascribed mainly to the fixed cost per flight and the dominance of the non‐cruising flight sectors with a low average costs, so that the airplane costs per unit of distance flown increases progressively when the trip gets shorter. The maximum payload times range capacity minus the breakeven number of passengers is referred to as the profit potential. The ratio between the profit potential and the productivity can be considered as the airliner's economic efficiency.
3.6.1 Range for Maximum Productivity
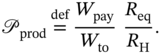
The achievable productivity for a specified MTOW is proportional to the product of the (maximum) payload fraction and the harmonic range ![]() . Referred to as the productivity parameter this figure of economic merit amounts to
. Referred to as the productivity parameter this figure of economic merit amounts to
The dimensionless productivity is computed for various values of the range factor ![]() according to Equation 3.2 for the example second generation SCT treated in Section 3.5. The result depicted on Figure 3.3 is explained by the fact that for short ranges the increasing range is dominating, whereas for long ranges the decreasing payload fraction dominates. Since the curves exhibit a shallow optimum the conclusion can be drawn that, from the point of view of conceiving an airliner with flexible operational capabilities, the preferred design range should be longer rather than shorter than this optimum. The maximum
according to Equation 3.2 for the example second generation SCT treated in Section 3.5. The result depicted on Figure 3.3 is explained by the fact that for short ranges the increasing range is dominating, whereas for long ranges the decreasing payload fraction dominates. Since the curves exhibit a shallow optimum the conclusion can be drawn that, from the point of view of conceiving an airliner with flexible operational capabilities, the preferred design range should be longer rather than shorter than this optimum. The maximum ![]() is achieved for
is achieved for ![]() . The “advanced future design” introduced previously, for which
. The “advanced future design” introduced previously, for which ![]() , is sized for a range of 10,000 km, thereby accurately satisfying this condition for maximum productivity. It is interesting that the Concorde, for which
, is sized for a range of 10,000 km, thereby accurately satisfying this condition for maximum productivity. It is interesting that the Concorde, for which ![]() , the maximum productivity is achieved for a range of 6500 km, which is actually Concorde's maximum range. These results may be compared with present‐day long‐range airliners having a typical range parameter
, the maximum productivity is achieved for a range of 6500 km, which is actually Concorde's maximum range. These results may be compared with present‐day long‐range airliners having a typical range parameter ![]() , for which the condition for maximum productivity leads to a theoretical optimum design range according to Figure 3.3 of 16,000 km.
, for which the condition for maximum productivity leads to a theoretical optimum design range according to Figure 3.3 of 16,000 km.
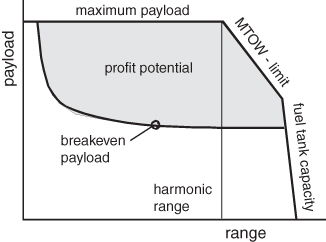
Figure 3.2 Definition of the profit potential [5, 6].
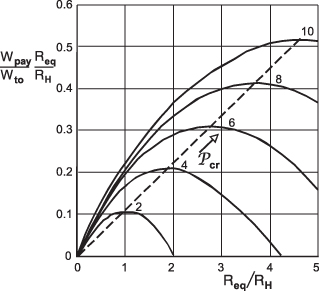
Figure 3.3 Definition of the productivity [5, 6].
3.6.2 Energy Efficiency
The fuel energy efficiency of a passenger transport is traditionally defined as the seat‐kilometer production per unit of fuel volume consumed during a given distance traveled,
A similar characteristic is the payload fuel efficiency, specifying the payload‐range productivity per unit of fuel weight consumed,

Applied to a given period of commercial operations, the total seat‐kilometer or payload‐kilometer produced represents the income potential, whereas the total amount of fuel consumed forms a large proportion of the operational expenses. Interpreted as a basic cruising flight performance, the energy efficiency can be defined alternatively as the ratio of transport work produced and fuel energy required to deliver this work. Applied to the instantaneous cruise performance, the momentary energy efficiency is proportional to the specific range ![]() :
:

where ![]() denotes the specific mass of fuel and
denotes the specific mass of fuel and ![]() is the distance flown per amount of fuel volume consumed. Equation 3.16 defines a dimensionless energy efficiency and, hence, one might be tempted to compare this with the usual definition of a mechanical or thermodynamic efficiency. This would, however, be an erroneous interpretation of the term “transportation work” since the energy level of the payload is not changing during (quasi‐)stationary flight. Combination of Equations 3.16 and 3.17 yields the FEE rewritten in terms of the range parameter and the payload fraction,
is the distance flown per amount of fuel volume consumed. Equation 3.16 defines a dimensionless energy efficiency and, hence, one might be tempted to compare this with the usual definition of a mechanical or thermodynamic efficiency. This would, however, be an erroneous interpretation of the term “transportation work” since the energy level of the payload is not changing during (quasi‐)stationary flight. Combination of Equations 3.16 and 3.17 yields the FEE rewritten in terms of the range parameter and the payload fraction,

where ![]() denotes the aircraft momentary gross weight. For a typical payload weight per seat of 95 kg and a fuel energy density
denotes the aircraft momentary gross weight. For a typical payload weight per seat of 95 kg and a fuel energy density ![]() MJ
MJ ![]() , we find
, we find ![]() seat‐kilometer per liter.
seat‐kilometer per liter.
A more adequate criterion is the fuel energy efficiency referred to the mission fuel burnt per seat in relation to the range ![]() . Applying this criterion to hypothetical “advanced future SCT” with
. Applying this criterion to hypothetical “advanced future SCT” with ![]() and a mid‐cruise payload fraction of 0.115, and combining it with the computed mission fuel of 134,000 kg according to Section 3.3, we find an FEE of 18 seat‐kilometers per liter. Equation (3.17) results in an average 17.6 seat‐kilometers per liter fuel for the complete mission – 3% below the instantaneous FEE in mid‐cruising flight. Although this compares favorably with Concorde's (estimated) FEE of 7.3 seat‐kilometers per liter it is worth noting that a modern subsonic jetliner with the same payload‐range productivity produces a typical 50 seat‐kilometers per liter. This makes it clear that the SCT, in spite of its much higher block speed, will have a substantial problem in being competitive on the commercial market.
and a mid‐cruise payload fraction of 0.115, and combining it with the computed mission fuel of 134,000 kg according to Section 3.3, we find an FEE of 18 seat‐kilometers per liter. Equation (3.17) results in an average 17.6 seat‐kilometers per liter fuel for the complete mission – 3% below the instantaneous FEE in mid‐cruising flight. Although this compares favorably with Concorde's (estimated) FEE of 7.3 seat‐kilometers per liter it is worth noting that a modern subsonic jetliner with the same payload‐range productivity produces a typical 50 seat‐kilometers per liter. This makes it clear that the SCT, in spite of its much higher block speed, will have a substantial problem in being competitive on the commercial market.
3.6.3 Conclusion
The early weight prediction method exposed in this chapter and its application to second generation HSCT suggest that, compared to Concorde's performances, the payload‐range production can be improved considerably, provided the flight efficiency in high‐speed flight can be increased by at least 50%, making future advanced SCT carrying 250 passengers over the 10,000 km range at Mach 2.0 an attractive alternative for flying trans‐Pacific routes. Compared to present‐day subsonic airliners with similar payload‐range production, such an airliner would offer a block time reduction of up to 50%, leading to a productivity increase of 100% with 2.4 times Concorde's FEE. Since this figure of merit is (at least to a considerable extent) under the control of the advanced design team, the FEE may be considered as a prime candidate to be used as a figure of merit for optimizing the design.
Bibliography
- 1 Küchemann, D. The Aerodynamic Design of Aircraft. 1st ed. Oxford: Pergamon Press; 1978.
- 2 Fielding, J.P. Introduction to Aircraft Design. Cambridge Aerospace Series 11, Cambridge: Cambridge University Press; 1999.
- 3 Whitford, R. Evolution of the Airliner. Ramsbury: The Crowood Press; 2007.
- 4 Torenbeek, E. Advanced Aircraft Design – Conceptual Design, Analysis and Optimization of Subsonic Civil Airplanes. Chichester: John Wiley and Sons Ltd; 2013.
- 5 Peyton Autry, C., and Baumgaertner P.J. The Design Importance of Airplane Mile Costs Versus Seat Mile Costs. SAE Paper No. 660277, April 1966.
- 6 Engineering Sciences Data Unit. Lost Range, Fuel and Time to Climb and Descent: Aircraft with Turbojet and Turbofan Engines. ESDU Data Sheet No. 74018, August 1974. Available at: https://www.esdu.com/cgi-bin/ps.pl?sess=unlicensed_1191114135640rsg&t=doc&p=esdu_74018a
- 7 Engineering Sciences Data Unit. Approximate Methods for Estimation of Cruise Range and Endurance: Aeroplanes with Turbojet and Turbofan Engines. ESDU Data Sheet No. 73019, revised May 1982. Available at: https://www.esdu.com/cgi-bin/ps.pl?sess=unlicensed_1191114135746pvj&t=doc&p=esdu_73019c
- 8 Bos, A.H.W. Multidisciplinary Design Optimization of a Second‐Generation Supersonic Transport using a Hybrid Genetic/Gradient‐Guided Algorithm. Doctoral Thesis TU Delft; 1996.
- 9 Torenbeek, E. Cruise Performance and Range Prediction Reconsidered. Progr. Aerospace Sci. 33(5/6):285–321; 1997.
- 10 Collard, D. Concorde Airframe Design and Development. Von Kármán Institute for Fluid Dynamics, J.J. Ginoux Lecture, 17 November 2000. Available at: https://www.jstor.org/stable/pdf/44548119.pdf?seq=1#page_scan_tab_contents
- 11 Torenbeek, E., Jesse E., and Laban M. Conceptual Design and Analysis of a Mach 1.6 European Supersonic Commercial Transport Aircraft. CISAP Deliverable D2‐WP1.2, National Aerospace Laboratory NLR, NLR‐CR‐2003‐384, 2003.
Note
- 1 The Concorde's (large) aluminum fin weight amounts to 28% of the fuselage structure. An all‐composite fin is likely to be much lighter.