Chapter 3
Describe core solutions and management tools in Azure
In Chapter 2, you learned about the core workload solutions in Azure. In this chapter, we’ll dig into a vast array of core solutions in Azure. We’ll cover some exciting new technologies, such as artificial intelligence, the Internet of Things (IoT), big data, and serverless computing.
If you’re really going to learn how to use Azure, you’re also going to need to know about how you can manage your Azure resources. You’ve seen the Azure portal already, but that’s not the only solution for managing and creating resources in Azure. There are several command-line tools that are available, making it easy to script powerful interactions with Azure resources. You can even manage your Azure resources from your phone!
Once you’ve created and configured your Azure services, it’s important to keep up with how they’re performing so that you’ll know if you need to make changes to get the most out of your cloud resources. However, keeping up with the best practices and recommended configurations can be hard, especially when you’re dealing with multiple services. Fortunately, Azure provides Azure Advisor to help you, and by coupling Azure Advisor with Azure Monitor, you can stay on top of all your Azure services.
Tracking the health of your particular cloud applications is only half the story when it comes to making sure your cloud resources are available. While Microsoft Azure is a highly reliable cloud platform, things can still go wrong, and when they do, the Azure Service Health website will keep you informed of what’s going on.
Here are the skills that are covered in this chapter.
Skills covered in this chapter:
Skill 3.1: Describe core solutions available in Azure
Even though cloud computing is a relatively new technology, it’s become a key component of many computing solutions. The scope of cloud computing is growing at a tremendous pace, and Microsoft Azure is growing right along with it. Since the first edition of this book published just a few short months ago, new Azure services have been introduced and changes to existing services have been abundant. The ancient Greek philosopher Heraclitus said, “The only thing that is constant is change.” It’s a certainty that Heraclitus couldn’t have predicted Azure thousands of years ago, but he certainly described the constant state of Azure perfectly!
The sheer number of Azure services can be overwhelming, but this chapter should help you make sense of the landscape.
Azure IoT Hub
Many of us don’t live in high-tech smart homes, so we might not realize just how big the Internet of Things (IoT) is becoming. To put it into context, the popular statistics portal Statista reports that there are more than 25 billion IoT-connected devices today, and that number is expected to grow to a staggering 75 billion by the year 2025. There are approximately 3.2 billion people on the Internet today, and the entire world’s population is only around 8 billion. These IoT devices eclipse the human race in number, and the amount of information they collect and share is mind-boggling.
In order to make more sense out of Azure’s IoT services, let’s revisit our theoretical company named ContosoPharm, which in this example, is a pharmaceutical company with a large, multi-story building where they store drugs under development, along with sensitive components used in research. These items must be under strict climate control. If the temperature or humidity moves outside of a very tight range, it results in the loss of priceless materials.
In order to protect their investment, ContosoPharm uses IoT-connected climate-control systems, along with IoT-connected generators and lighting systems. These systems constantly monitor the environment and send alerts if something goes wrong. There are approximately 5,000 IoT devices in the building, and ContosoPharm must meet the following requirements for all those devices.
They must update firmware on the IoT devices easily and in a staged way so they aren’t all updated at the same time.
They must alter the settings on the devices, such as changing alert levels, but these settings are specific to the physical location of the devices in the building.
They must ensure that any connectivity to the devices is completely secure.
IoT Hub can easily solve all these problems. IoT devices are added to IoT Hub, and you can then manage them, monitor them, and send messages to them, either individually or to groups that you create. You can add up to 1,000,000 IoT devices to a single IoT Hub.
Figure 3-1 shows an IoT device added to the IoT Hub for ContosoPharm.
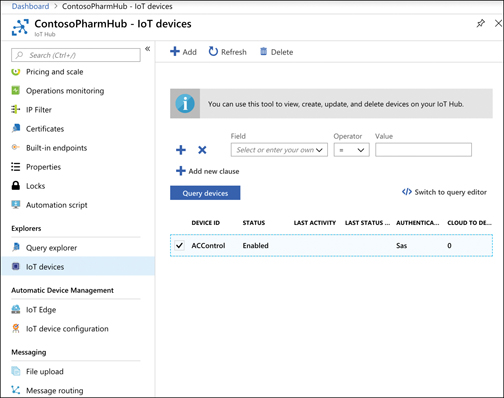
FIGURE 3-1 An IoT device in IoT Hub
From IoT Hub, you can send messages to devices (called cloud-to-device, or C2D messaging) or from your device to IoT Hub (called device-to-cloud, or D2C messaging). You can also intelligently route messages to Event Hub, Azure Storage, and Service Bus based on the content in the message.
When you add a new IoT device, IoT Hub creates a connection string that uses a shared access key for authentication. This key prevents unauthorized access to your IoT Hub. Once connected, messages between your device and IoT Hub are encrypted for additional security.
In addition to messages, you can also use IoT Hub to send files to your devices. This allows you to easily update the firmware on your devices in a secure way. To update the firmware on an IoT device, you simply copy the firmware to the device. The device will detect the firmware and will reboot and flash the new firmware to the device.
One important concept in IoT Hub is the concept of what’s called a device twin. Every IoT device in IoT Hub has a logical equivalent that’s stored in IoT Hub in JSON format. This JSON representation of the device is called a device twin, and it provides important capabilities.
Each device twin can contain metadata that adds additional categorization for the device. This metadata is stored as tags in the JSON for the device twin, and it’s not known to the actual device. Only IoT Hub can see this metadata. One of ContosoPharm’s requirements was to update firmware in a staged way instead of updating all devices at the same time. They can achieve that by adding tags for the device twins from their devices that might look like the following:
"tags": {
     "deploymentLocation": {
            "department": "researchInjectibles",
            "floor": "14"
        }
}
They can then choose to send firmware files only to devices on the 14th floor, for instance, or say, to devices in the researchInjectibles department. Figure 3-2 shows the device twin configuration in IoT Hub with tags set for the location of the device. Notice the building tag with a value of null. This is a tag that was previously set on the device twin, and by setting it to null, the tag will be removed.
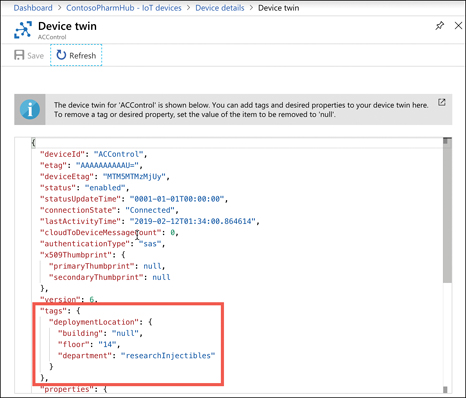
FIGURE 3-2 Device twin showing tags set in the JSON
The device twin also contains the properties for the IoT device. There are two copies of every property. One is the reported property, and the other is the desired property. You can change a device property in IoT Hub by changing the desired property to a new value. The next time the device connects to IoT Hub, that property will be set on the device. Until that happens, the reported property will contain the last value the device reported to IoT Hub. Once the property is updated, the reported and desired properties will be equal.
The reason IoT Hub uses this method for setting properties is that it might not always have a connection to every device. For example, if a device puts itself to sleep to save power, IoT Hub can’t write property changes to that device. By keeping a desired and reported version of every property, IoT Hub always knows if a property needs to be written to a device the next time the device connects to IoT Hub.
To help with users who want to add a large number of IoT devices to IoT Hub, Microsoft offers the IoT Hub Device Provisioning Service, or DPS. The DPS uses enrollment groups to add devices to your IoT Hub. The concept is that once the device wakes up (often, for the first time if it’s a new device), it needs to know that it should connect to your IoT Hub. In order to do that, the DPS needs to uniquely identify the device, and it does that with either a certificate or via a trusted platform module chip.
Once DPS confirms the identity of the device, it can use the enrollment group details to determine which IoT Hub it should be added to. It will then provide the device with the connection information to connect to that IoT Hub. Also, the enrollment group can provide the initial configuration for the device twin. This allows you to specify properties, such as a firmware version, that the device needs to have when it starts.
As your devices send messages to IoT Hub, you can route those messages to Azure Storage, Event Hub, and various other endpoints. You can choose the type of messages you want to route, and you can also write a query to filter which messages are routed. In Figure 3-3, we have configured a route that sends messages to Azure Blob Storage. You can see in the query that we are only going to route those messages that come from a device with a device twin containing the tag for our researchInjectibles department.
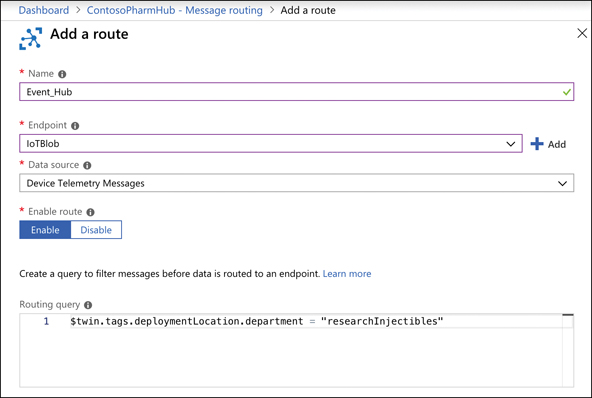
FIGURE 3-3 Adding a message route in IoT Hub
There are two pricing tiers for IoT Hub: Basic and Standard. Each tier offers multiple editions that offer pricing based on the number of messages per day for each IoT Hub unit. When you scale an IoT Hub, you add additional units. This adds the ability to handle more messages at an increased price. Table 3-1 shows the editions and pricing for the Basic tier. Table 3-2 shows editions and pricing for the Standard tier.
TABLE 3-1 IoT Hub Basic tier pricing
Edition |
Monthly Price per IoT Hub Unit |
Messages per day per IoT Hub Unit |
|---|---|---|
B1 |
$10 US |
400,000 |
B2 |
$50 US |
6,000,000 |
B3 |
$500 US |
300,000,000 |
TABLE 3-2 IoT Hub Standard tier pricing
Edition |
Monthly Price per IoT Hub Unit |
Messages per day per IoT Hub Unit |
|---|---|---|
Free |
Free |
8,000 |
S1 |
$25 US |
400,000 |
S2 |
$250 US |
6,000,000 |
S3 |
$2,500 US |
300,000,000 |
It’s also important to note that the following features are only available in the Standard tier:
Device Streams for streaming messages in near real-time
Cloud-to-device messaging
Device management, device twin, and module twin
IoT Edge for handling IoT Devices at the edge of the network where they reside
If you use the Device Provisioning Service, there’s a charge of $0.123 US for every 1,000 operations.
IoT Central
IoT Hub is a great way to manage and provision devices, and it provides a robust means of dealing with messages. You can even use Azure Stream Analytics to route messages to Power BI for a near real-time dashboard of device messages, but doing that requires a bit of complex configuration. If you’re looking for a first-class experience in monitoring IoT devices without having to do complex configuration, IoT Central is a good choice.
IoT Central is a SaaS offering for IoT devices. Unlike IoT Hub, you don’t have to create any Azure resources to use IoT Central. Instead, you browse to https://apps.azureiotcentral.com and create your app within the web browser interface, as shown in Figure 3-4.
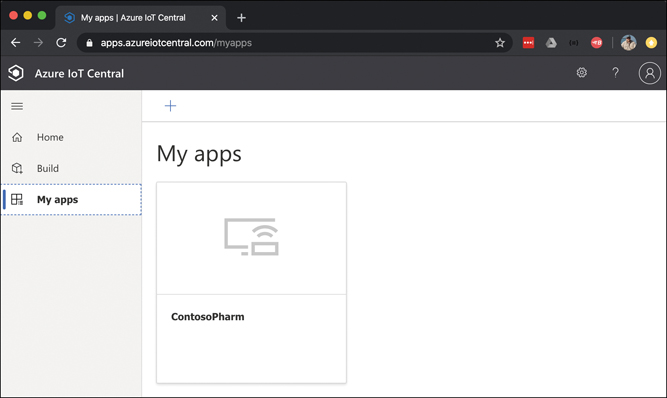
FIGURE 3-4 Azure IoT Central homepage
To create an IoT app, click the plus sign above My Apps. This opens the Create Application screen shown in Figure 3-5.
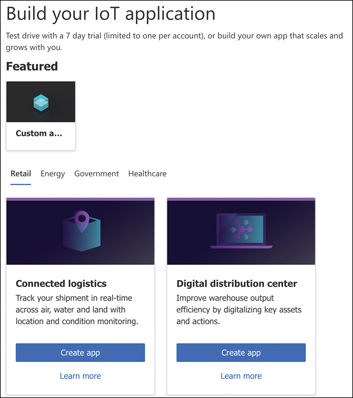
FIGURE 3-5 Creating a new IoT Central app
You have the choice of choosing a template or creating a custom app. For convenience, templates are categorized by Retail, Energy, Government, and Healthcare.
After you select your template, you’ll see the New Application screen shown in Figure 3-6. This is where you’ll specify the name for your app and the URL. You can use the default names or specify your own, but it’s recommended to use your own so you can easily identify your app. Also, once your app has been created, you access it directly by using the URL you specify, so you might want that to be descriptive as well.
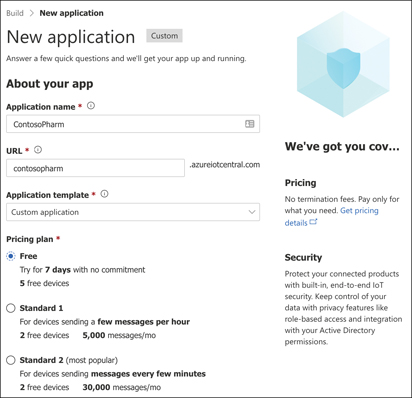
FIGURE 3-6 Specifying an app name, URL, and pricing plan
Next, you choose your pricing plan. If you’re using Pay-As-You-Go, you’ll need to specify details about your Azure subscription. If you choose the Free plan, you’ll just need to enter some contact information. Scroll to the bottom of the screen and click Create to finish the creation of your app.
In Figure 3-4, you can see that we’ve already created an app called ContosoPharm. When you click that app, you see a menu on the left side of the page, and if you click Devices, you can see any devices added, as shown in Figure 3-7.
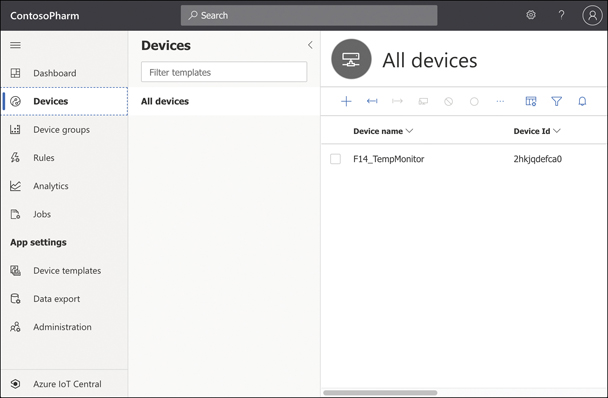
FIGURE 3-7 An IoT device in IoT Central
To add a new device, click the plus sign in the menu bar above your device list to access the Create New Device screen shown in Figure 3-8. You have the option of adding a real device if you have one, but you can also add a simulated device. Adding simulated devices is a good way to get everything set up the way you want them in IoT Central, and then you can add real devices at a later time.
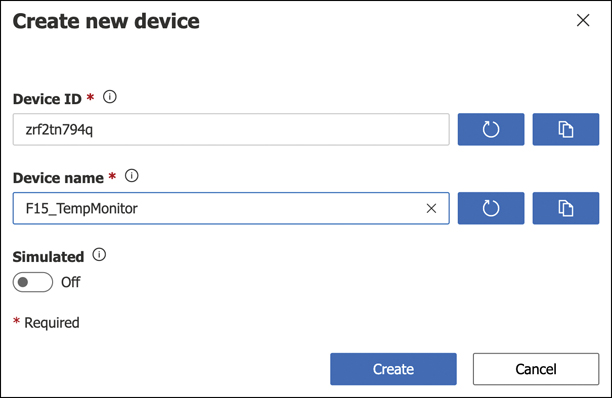
FIGURE 3-8 Adding a device in IoT Central
Every page within your app can be edited directly in the browser. Figure 3-9 shows the home page for the IoT Central app. If you click the Edit button, you can remove tiles, add tiles, and edit information in tiles in a point-and-click interface right within your browser.
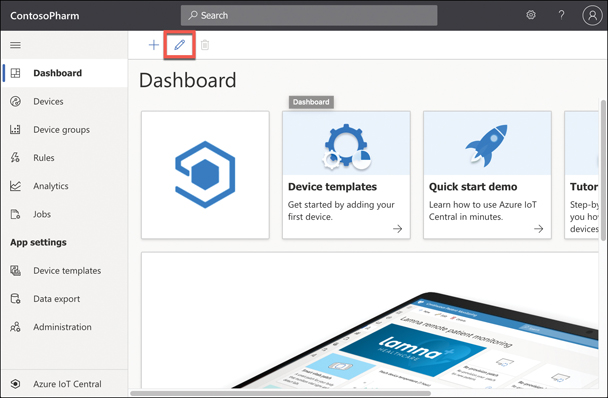
FIGURE 3-9 Editing a page in IoT Central
The reason we see an Edit button is because this user is set as the administrator of this application. IoT Central gives you control over who can do what using roles. There are three built-in roles to which you can assign a user.
Administrator Users in this role have full access to the application and can edit p ages and add new users.
Builder Users in this role can edit pages, but they can’t perform any administrative tasks, such as adding users, changing user roles, changing application settings, and so on.
Operator Users in this role can use the application, but they can’t edit any pages and they can’t perform administrative tasks.
In some situations, these built-in roles might not offer the flexibility you need, so you can also create your own roles with the exact permissions you need.
To administer your application, click Administration on the menu on the left, as shown in Figure 3-10. You can then add and remove users, adjust user roles, change the application name or URL, add a custom image for your application, and so on. You can also copy or delete your application from this screen.
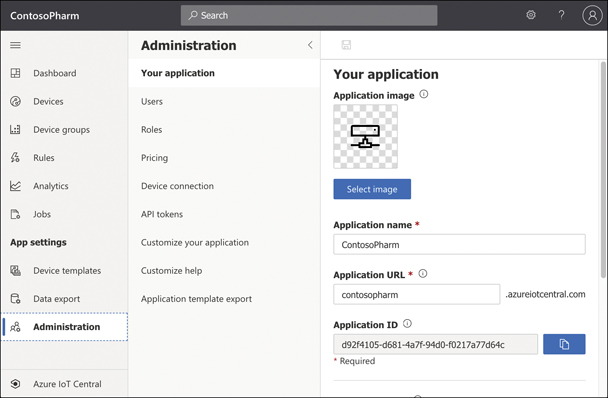
FIGURE 3-10 Administering an application in IoT Central
If you click a device, you can look at information coming from the device’s sensors. In Figure 3-11, you can see the Humidity and Temperature sensors on the F14_TempMonitor device.
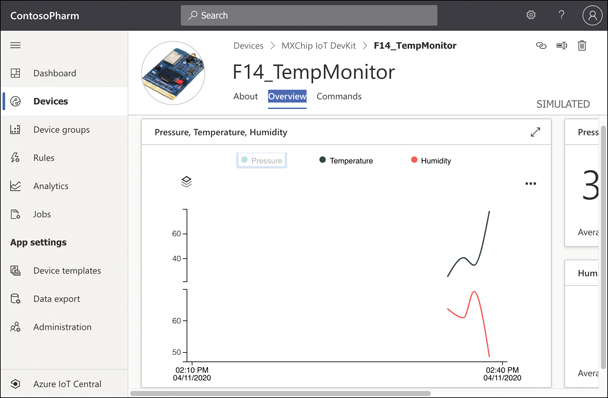
FIGURE 3-11 Reviewing sensor data from a device in IoT Central
IoT Central also allows you to easily configure rules that will monitor your devices and perform an action you choose when your rule is activated. In Figure 3-12, we are configuring a rule that will activate when the Humidity is above 60.
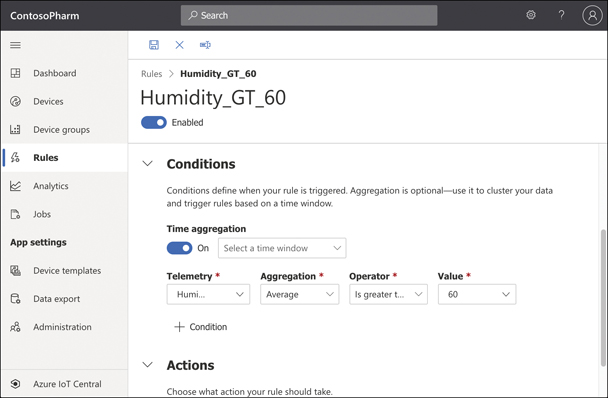
FIGURE 3-12 Creating a rule
When a rule is triggered, IoT Central can send an email to someone with details of what happened. You can also choose to trigger a webhook to call an Azure Function, run a workflow in an Azure Logic App, run a workflow in Microsoft Power Automate, or do something specific in your own app that exposes a webhook.
When you have a large number of devices, it’s convenient to group devices into a device group so you can take action on many devices at a time. To create a device group, specify a condition that should be met for a device to be added to the group. In Figure 3-13, we’re creating a device group for all devices that have F14 in the name. If the name contains F14, the device is automatically added to the device group. Even when adding a new device later, it will be part of this device group if the name contains F14.
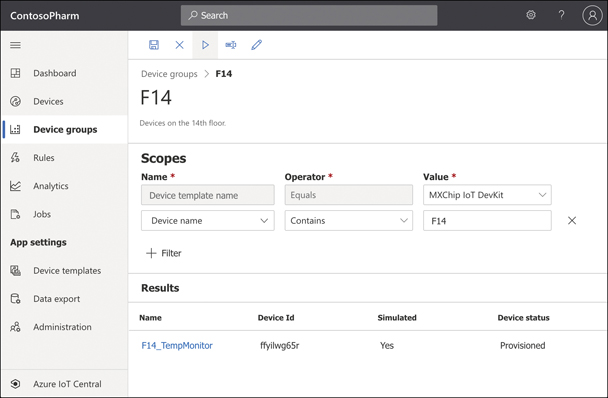
FIGURE 3-13 Creating a device group
Once you’ve created a device group, you can take action on the devices in it by creating a job. Click Jobs in the main menu of your application to configure your job. A job can modify properties, change settings, or send commands to devices. In Figure 3-14, we’re creating a job that will turn on the LEDs for all devices in our device set.
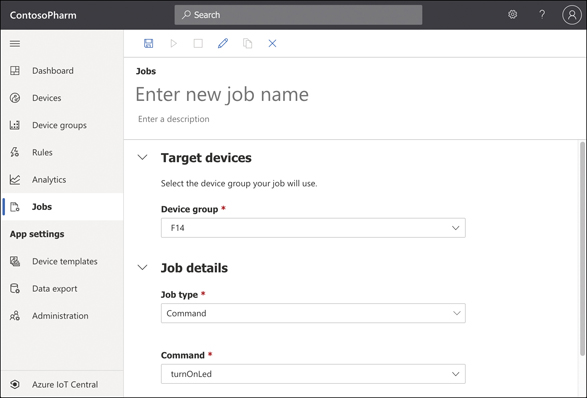
FIGURE 3-14 Creating a job
IoT Central also allows you to perform analytics on metrics from devices in a device set. For example, you can look at all devices that registered temperatures above a certain level. For even richer analytics of data, you can configure IoT Central to continuously export data from your devices to Azure Blob Storage, Azure Event Hubs, or Azure Service Bus.
Azure Sphere
Having your devices connected to the Internet certainly offers a lot of advantages. If you’re at the store and you can’t remember whether you need milk, your smart fridge can let you know. If you’ve just left for a trip and think you might have left the oven on, your smart oven can be turned off from your phone. You get the idea. In general, connectivity is a good thing, but it also comes with disadvantages, not the least of which is security. The last thing you want is a hacker to gain control of your Internet-connected door locks on your house!
IoT devices are like any other computing device in that they run software that’s designed for a specific purpose. Any device that runs software is susceptible to software bugs, and IoT devices are no different. However, IoT device software is embedded on a chip, and that introduces unique challenges to fixing bugs and updating the software. When you add the fact that there’s little to no standardization in the IoT device business, you end up with a possible security nightmare.
To address these security issues, Microsoft developed Azure Sphere. Azure Sphere is based on Microsoft’s decades of experience and in-depth research that Microsoft conducted on securing devices.
Azure Sphere is actually an entire ecosystem, and it starts with the chip, or the microprocessor unit (MCU). Microsoft has developed an Azure Sphere MCU that contains security components embedded in the chip. Third parties can use these MCUs to run code that is specific to their needs, and that code runs on the Azure Sphere operating system, which is a customized version of Linux developed for Azure Sphere.
In Azure, the Azure Sphere Security Service ensures that MCUs are secured, provides for the ability to update the embedded Azure Sphere OS and the applications running on MCUs, and enables reporting on crashes and other analytics. One of the enormous benefits of the Azure Sphere ecosystem is the capability to patch bugs in embedded chips that might create security concerns.
This ecosystem provides a secure environment for running embedded code, but it also enforces secure communication between devices. It’s likely that your smart fridge can communicate with other smart devices in your home, and by ensuring strong authentication between these devices, Azure Sphere can help ensure a secure environment for all your smart devices.
As of this writing, there is only one Azure Sphere certified MCU available, but Microsoft expects that smart device manufacturers will continue to adopt Azure Sphere for their MCUs. To make that process easier, Azure Sphere development kits are available at a low price. The development kit includes hardware that is ready for Azure Sphere and an Azure Sphere software developer’s kit (SDK) for Microsoft Visual Studio.
To take advantage of Azure Sphere, you purchase it from a Microsoft distributor. The distributor sells a package that includes an Azure Sphere certified MCU, a license for the Azure Sphere Security Service, and a license for the Azure Sphere OS. The current price for the MediaTek MT3620 AN (currently the only Azure Sphere certified MCU) is less than $8.65. Pricing varies based on how many MCUs you purchase, but the price will not exceed $8.65 per unit.
Azure Synapse Analytics
Businesses collect tremendous amounts of data from many different sources. For example, Microsoft offers an SLA on Azure services that is about 99.9 percent or higher in terms of its availability. Microsoft doesn’t put that number out there and then just cross their fingers and hope nothing goes wrong. They maintain enormous amounts of data on how the Azure infrastructure is operating, and they use that data to predict problems and react to them before they affect customers.
Because of the sheer enormity of the Azure infrastructure, you can just imagine how much data is being generated for every single system in that infrastructure, and in order to meet SLAs, they must be able to reliably analyze that data in real time. How exactly do they do that? You can’t really throw that amount of data at a VM or a pool of VMs without overloading the system to the point of failure.
The problem of actually doing anything with the vast data we collect is common across all businesses, and this is what we mean by big data. Big data means more data than you can analyze through conventional means within the desired timeframe. Analyzing big data requires a powerful system for storing data, the ability to query the data in multiple ways, enormous power to execute large queries, assurance that the data is secure, and much more. That’s exactly what Azure Synapse analytics provides.
Azure Synapse runs in an Azure Synapse cluster. A cluster is a combination of four different components:
Synapse SQL
Apache Spark integration
Data integration of Spark and Azure Data Lake Storage
A web-based user interface called Azure Synapse Studio
Synapse SQL is the data warehousing portion of Azure Synapse. Using Synapse SQL, you can run powerful queries against your big data. These queries run on compute nodes, and multiple compute nodes run at the same time, which allow multiple queries to run in parallel. Each compute node also runs a component called the Data Movement Service (DMS) that moves data efficiently between compute nodes.
Queries are executed on compute nodes in order to separate the query work from data storage. This makes it possible to scale the number of compute nodes easily when more power is needed for your queries. This also allows you to pause the compute power you’re using so that you only pay for storage when you don’t need to run queries.
Many consumers of big data use a third-party big data processing engine called Apache Spark, and Azure Synapse tightly integrates with the Spark engine. Spark features are automatically incorporated into Azure Synapse when you create a cluster.
Azure Synapse integrates Apache Spark functionality with Azure Data Lake Storage. Azure Data Lake Storage is designed for storing large amounts of data that you’d like to analyze, but Data Lake Storage is designed for a wide array of data instead of relational data. In a data lake, data is stored in containers. Each container typically contains related data.
Azure Synapse makes it easy to analyze data and manage your data with a web-based portal called Azure Synapse Studio. Once you’ve created your Azure Synapse workspace, you simply click a button to launch Synapse Studio, and from there, you can easily manage and analyze your data.
HDInsight
HDInsight makes it possible to easily create and manage clusters of computers on a common framework designed to perform distributed processing of big data. Essentially, HDInsight is Microsoft’s managed service that provides a cloud-based implementation of a popular data analytics platform called Hadoop. However, it also supports many other cluster types, as shown in Table 3-3.
TABLE 3-3 HDInsight supported cluster types
Cluster Type |
Description |
|---|---|
Hadoop |
Large-scale data processing that can incorporate additional Hadoop components, such as Hive (for SQL-like queries), Pig (for using scripting languages), and Oozie (a workflow scheduling system) |
HBase |
Extremely fast and scalable NoSQL database |
Storm |
Fast and reliable processing of unbounded streams of data in real time |
Spark |
Extremely fast analytics using in-memory cache across multiple operations in parallel |
Interactive Query |
In-memory analytics using Hive and LLAP (processes that execute fragments of Hive queries) |
R Server |
Enterprise-level analytics using R, a language that’s specialized for big data analytics |
Kafka |
Extremely fast processing of huge numbers of synchronous data streams, often from IoT devices. |
Building your own cluster is time-consuming and often difficult unless you have previous experience. With HDInsight, Microsoft does all the heavy lifting on its own infrastructure. You benefit from a secure environment—one that is easily scalable to handle huge data processing tasks.
An HDInsight cluster performs analytics by breaking up large data blocks into segments that are then handed off to nodes within the cluster. The nodes then perform analytics on the data and reduce it down to a result set. All this work happens in parallel so that operations are completed dramatically faster than they would be otherwise. By adding additional nodes to a cluster, you can increase the power of your analytics and process more data even faster.
When you create an HDInsight cluster, you specify the type of cluster you want to create and give your cluster a name as shown in Figure 3-15. You will also specify a username and password for accessing the cluster and an SSH user for secure remote access.
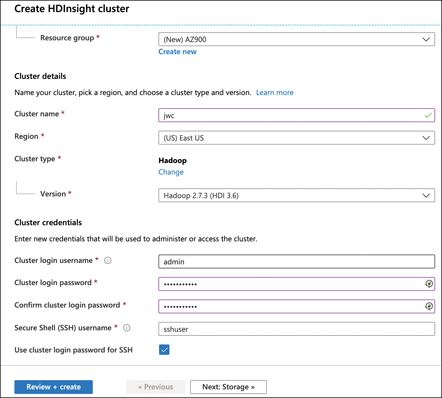
FIGURE 3-15 Creating an HDInsight Hadoop cluster
After you click the Next: Storage button, you configure the storage account and Data Lake Storage access if desired. Notice in Figure 3-16 that you only see Data Lake Storage Gen1. To use Data Lake Storage Gen2, you must first create a Data Lake Storage Gen2 account and make a few configuration changes, as documented at https://docs.microsoft.com/en-us/azure/hdinsight/hdinsight-hadoop-use-data-lake-storage-gen2.
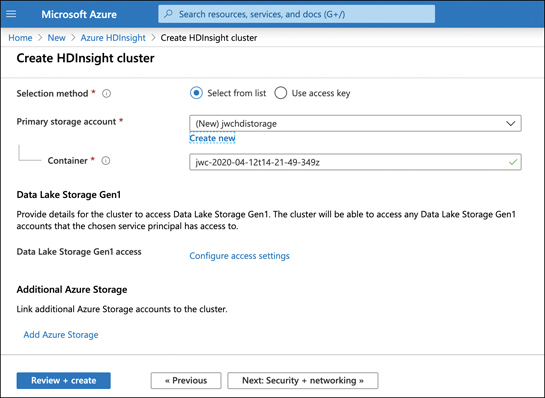
FIGURE 3-16 Configuring an HDInsight cluster’s storage account
Once you start the creation of your Hadoop cluster, it might take up to 20 minutes to complete, depending on your configuration. Once your cluster is ready, you can start the analysis of data by writing queries against it. Even if your queries are analyzing millions of rows, HD Insight can handle it, and if you need more processing power, you can add additional nodes as needed.
HD Insight clusters are billed on a per hour basis, and you pay more per hour based on how powerful the machines are in your cluster. For full pricing details, see: https://azure.microsoft.com/pricing/details/hdinsight/.
Azure Databricks
Data that gets stored in a data warehouse or data lake is typically raw data that is often unstructured and difficult to consume. Also, you might need data that comes from multiple sources, some of which might even be outside of Azure. Azure Databricks is an ideal solution for accumulating data and for forming the data (called data modeling) so that it’s optimal for machine learning models.
Figure 3-17 shows a new instance of an Azure Databricks resource. All your interactivity with Databricks is via the Databricks workspace, which is a web-based portal for interacting with your data. To access the workspace, click the Launch Workspace button shown in Figure 3-17.
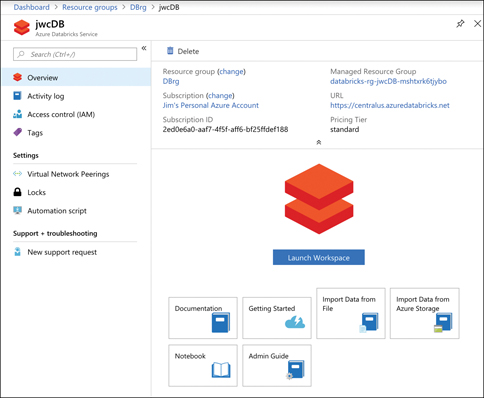
FIGURE 3-17 An instance of Azure Databricks in the Azure portal
When clicking Launch Workspace, you’re taken to the Databricks workspace. Azure will automatically log you in when you do this using your Azure account. In this example, the Databricks instance is completely empty at this point. Along the left side of the page (as shown in Figure 3-18) are links to access all the Databricks entities, such as workspaces, tables, and jobs. There’s also a Common Tasks section, which allows you to access these entities; also, you can create new notebooks, which is detailed later in this chapter.
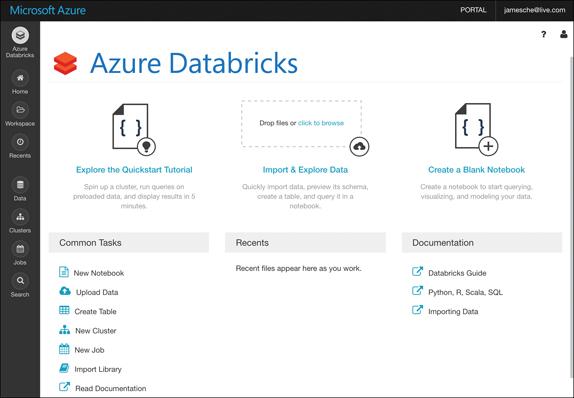
FIGURE 3-18 The Azure Databricks workspace
Now let’s create a cluster. Databricks does all its work using clusters, which are the compute resources. To create a cluster, you can click New Cluster under Common Tasks. You’ll now see the Create Cluster screen shown in Figure 3-19, where the new cluster has been named jcCluster and all other options are set to their defaults.
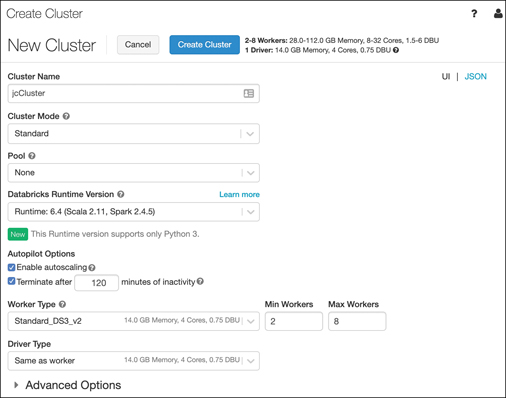
FIGURE 3-19 Creating a Databricks cluster
Next, we’ll create a notebook. Notebooks are a powerful way to present and interact with related data. Each notebook contains data as well as visualizations and documentation to help us understand the data. Once your data is in your notebook, you can run commands against machine learning frameworks in order to build your machine learning model right inside your notebook.
Clicking the Azure Databricks button in the menu on the left (shown in Figure 3-18) allows you to then click New Notebook to create a notebook. In Figure 3-20, we’ve created a new notebook that uses SQL as the primary language. Databricks assume that the code written in this notebook will be SQL code unless specified. You can also choose to specify Python, Scala, or R as the language.
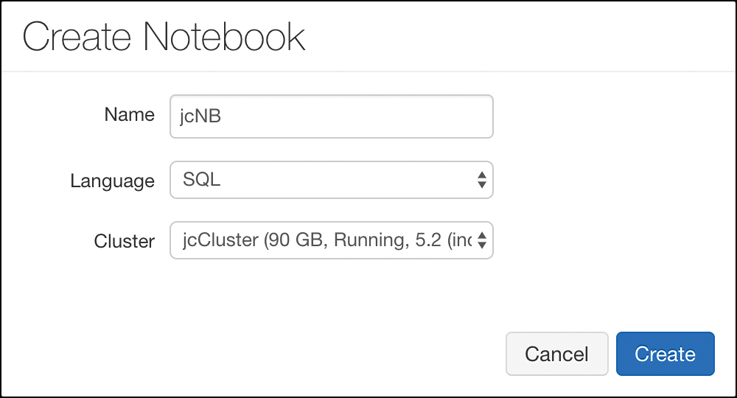
FIGURE 3-20 Creating a notebook
After you create a new notebook, you’ll see an empty notebook with one cell. Inside that cell, you can enter any data that you wish. For example, you might want to have some documentation that defines what this notebook contains. Documentation in notebooks is entered using Markdown, a language that’s well-suited to writing documentation. Figure 3-21 shows the new notebook with some Markdown that documents what’s in the notebook. Notice that the Markdown starts with %md. This tells Databricks how the content that follows is in Markdown and not in the primary language of SQL.

FIGURE 3-21 Documenting a notebook using Markdown
If you click outside this cell, the markdown code will be rendered in HTML format. In order to add some data to this notebook, you need to create a new cell by pressing B on your keyboard or by hovering over the existing cell and clicking the + button to add a new cell.
After pressing B on your keyboard, a new cell is inserted at the end of your notebook. You can enter some SQL code in this cell in order to populate a table with some data, as shown in Figure 3-22. (This code was taken from the Databricks quickstart tutorial at https://docs.azuredatabricks.net/getting-started/index.html.) After entering your code, you can run it by clicking the Run button.
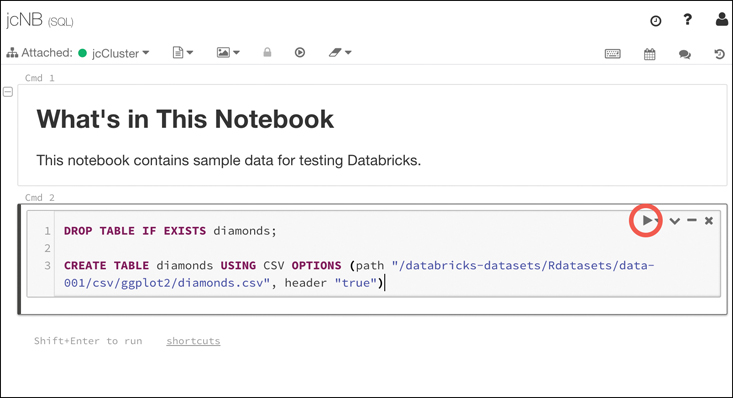
FIGURE 3-22 Adding code and running a command
You can run a query against the data that was added using the command shown in Figure 3-22 by writing a SQL query in a new cell. Figure 3-23 shows the results of a query against the data.
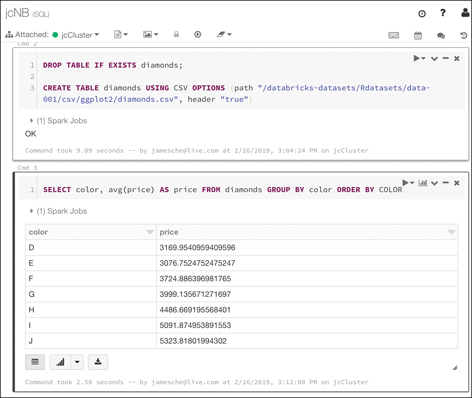
FIGURE 3-23 Querying the data
When you run commands in a cell, Databricks creates a job that runs on the compute resources you allocated to your cluster. Databricks uses a serverless model of computing. That means that when you’re not running any jobs, you don’t have any VMs or compute resources assigned to you. When you run a job, Azure will allocate VMs to your cluster temporarily in order to process that job. Once the job is complete, it releases those resources.
This example is quite simple, but how does all this relate to machine learning? Azure Databricks includes the Databricks Runtime for Machine Learning (Databricks Runtime ML) so that you can use data in Databricks for training machine learning algorithms. The Databricks Runtime ML includes several popular libraries for machine learning, including: Keras, PyTorch, TensorFlow, and XGBoost. It also makes it possible to use Horovod for distributed deep-learning algorithms. You can use these components without using Databricks Runtime ML. They’re open source and freely available, but the Databricks Runtime ML saves you from the hassle of learning how to install and configure them.
To use the Databricks Runtime ML, you’ll need to either specify it when you create your cluster or edit your existing cluster to use it. You do that by choosing one of the ML runtimes, as shown in Figure 3-24.

FIGURE 3-24 Databricks Runtime ML in cluster configuration
You’re not limited to the libraries included with Databricks Runtime ML. You can configure almost any third-party ML tool in Azure Databricks, and Microsoft provides some pointers on doing that in their documentation located at https://bit.ly/az900-thirdpartyml.
Once you’ve built your machine learning model in Databricks, you can export it for use in an external machine learning system. This process is referred to as productionalizing the machine-learning pipeline, and Databricks allows you to productionalize using two different methods: MLeap and Databricks ML Model Export.
MLeap is a system that can execute a machine learning model and make predictions based on that model. Databricks allows you to export your model into what’s called an MLeap bundle. You can then use that bundle in MLeap to run your model against new data.
Databricks ML Model Export is designed to export your machine learning models and pipeline so that they can be used in other machine learning platforms. It’s specifically designed to export Apache Spark-based machine learning models and pipelines.
Azure Machine Learning
Azure Machine Learning is a service that lets you delve into the world of artificial intelligence, or AI. In order to really grasp Azure Machine Learning, you first need to have a knowledge foundation of AI and machine learning.
Artificial intelligence
Before we go too far into AI, let’s first come to an agreement on what we mean by AI. When many people think about computer AI, the image that comes to mind is a human-killing android or some other hostile technology obsessed with ridding the world of humans. You’ll be relieved to know that’s actually not what AI means in this context.
The AI of today is called Artificial Narrow Intelligence (or sometimes weak AI), and it refers to an AI that is capable of performing one specific task much more efficiently than a human can perform that same task. All the AI that we’ve developed so far is weak AI. On the other end of the AI spectrum is Artificial General Intelligence, or strong AI. This is the type of AI you see depicted in movies and science fiction books, and we don’t currently have this kind of capability.
In many ways, it’s a bit misleading to call existing AI technology weak. If you place it in the context of the imaginary strong AI, it certainly has limited capabilities, but weak AI can do extraordinary things, and you almost certainly benefit from its capabilities every day. For example, if you speak to your phone or your smart speaker and it understands what you’ve said, you’ve benefitted from AI.
In the 1973 edition of Profiles of the Future, the famous science fiction writer Arthur C. Clarke said, “Any sufficiently advanced technology is indistinguishable from magic.” While AI was not yet a thing when Clarke made this assertion, the capabilities that AI make possible are certainly applicable, but AI isn’t magic. AI is actually mathematics, and as anyone familiar with computers will tell you, computers are very good at math.
In order to develop AI capabilities, computer engineers set out to give computers the ability to “learn” in the same way that the human brain learns. Our brains are made up of neurons and synapses. Each neuron communicates with all the other neurons in the brain, and together, they form what’s known as a neural network. While each neuron on its own can’t do much, the entire network is capable of extraordinary things.
AI works by creating a digital neural network. Each part of that neural network can communicate and share information with every other part of the network. Just like our brains, a computer neural network takes input, processes it, and provides output. AI can use many methods for processing the input, and each method is a subset of AI. The two most common are natural language understanding and machine learning.
Natural language understanding is AI that is designed to understand human speech. If we were to try to program a computer to understand the spoken word by traditional computing means, it would take an army of programmers decades to come anywhere close to usable recognition. Not only would they have to account for accents and vocabulary differences that occur in different geographic regions, but they’d have to account for the fact that individuals often pronounce words differently even in the same regions. People also have difference speech cadences, and that causes some words to run together. The computer has to know how to distinguish individual words when that might not be easy to do. In addition to all this complexity, the computer must account for the fact that language is an ever-changing thing.
Given this complexity, how did Amazon ever develop the Echo? How does Siri ever understand what you’re saying? How does Cortana know to crack a clever joke when we ask her about Siri? The answer in all these cases is AI. We have millions of hours of audio recordings, and we have millions more hours in videos that include audio. There’s so much data available that no human being could ever process all of it, but a computer processes data much more quickly. Not only does it have more analytical pathways than humans do, but it also processes information much more quickly.
If we feed all those recordings into a natural language understanding engine, it has plenty of examples in order to determine what words we’re speaking when we say something to a smart speaker or smart phone, and determining the meaning of these words is simply pattern recognition. As Apple, Amazon, and Microsoft were working on this technology, they fine-tuned it by getting your feedback. Sometimes, they might actually ask you whether they got it right, and other times, they might assume they got something wrong if you just bowed out of the conversation early. Over time, the system gets better and better as it gets more data.
Machine learning (ML) is similar in that it uses a neural network to accomplish a task, but the task is different from understanding speech. In fact, machine learning can be used in many applications. One of the common uses of machine learning is image recognition. As it turns out, AI neural networks are particularly good at recognizing patterns in images, and just like audio, we have an enormous amount of data to work with.
We’re likely all aware that satellites have been photographing the surface of the earth for quite some time. We have detailed imagery from just about every square inch of our planet, and those images are valuable in many ways. For example, scientists who are working on conservation efforts benefit by knowing how our planet is changing over time. Forest engineers need to know about the health of our forests. Wildlife conservationists need to know where to focus efforts on where animals are most at risk. By applying an ML model to all these images, Microsoft can serve all these needs.
Image-analyzing AI isn’t limited to the planetary scale. It’s also helpful when we want to search through our own pictures. Perhaps you want to find all the pictures you’ve taken of a particular person, or maybe you’re interested in finding all your pictures of flowers. Your phone can likely do this kind of thing, and it does it by using AI and ML. In fact, Google Photos is even able to identify specific people in photos when the time between two photos is decades apart. All this uses ML.
ML uses a learning algorithm that is the basis for the AI. Once the algorithm is developed, you feed test data to it and examine the result. Based upon that result, you might determine that you need to tweak the algorithm. Once the algorithm is suitable to your task, you typically deploy it to an environment where it has a vast array of compute resources that you can allocate to it. You can then feed huge amounts of data to it for processing. As the algorithm deals with more data, it can improve itself by recognizing patterns.
Typically, when you’re testing an ML model, you set up a scenario where only a portion of your complete dataset is sent to your model for training. Once your model is trained, you send the rest of your data through your model in order to score the results. Because you’re dealing with a historical dataset, you already know that which your model is attempting to figure out, so you can accurately determine the accuracy of your model. Once you have achieved the desired accuracy of your model, you can deploy it and begin using it against production data.
Even with careful modeling and scoring, ML algorithms can make mistakes. In a paper on ML published in 2016, Marco Ribeiro, Sameer Singh, and Carlos Guestrin wrote about an ML experiment that was designed to look at pictures and differentiate between dogs and wolves. As it turns out, the algorithm was making plenty of mistakes, but the humans couldn’t figure out why.
When they tested the ML algorithm to determine how it was making these incorrect decisions, they found that the algorithm had come to the conclusion that pictures with wolves in them had a snowy background and pictures with dogs had grass in the background. Therefore, every picture with a dog-like creature that was taken on a snowy background was immediately classified (sometimes incorrectly) as a wolf.
Now that you have some foundational knowledge, you’re in a better position to understand what Azure offers with Azure Machine Learning.
Machine learning in Azure
Azure Machine Learning is designed to make ML approachable to just about anyone. It offers SDKs for both Python and R, and it also offers a drag-and-drop environment and an automated mode for more easily creating and training ML models in a visual way.
Azure Machine Learning is available in two editions; Basic and Enterprise. The Basic edition offers only access to ML SDKs and notebooks. The Enterprise edition offers the features of the Basic edition, but it adds many additional features, including the visual designers.
To get started with Azure Machine Learning, you first create an Azure Machine Learning workspace. Once you’ve created your workspace, you can begin to build models, train models, run experiments, and so on. As you can see in Figure 3-25, you’re directed to the Azure Machine Learning studio for most operations.
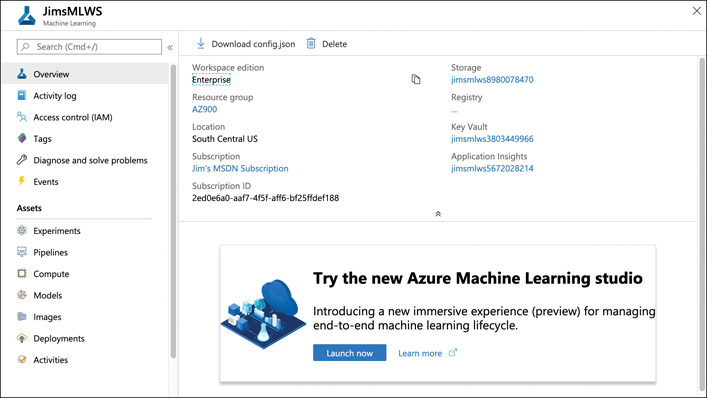
FIGURE 3-25 An Azure Machine Learning workspace
Clicking the Launch Now button shown in Figure 3-25 launches the studio where you can build your ML models. As shown in Figure 3-26, you can also load some samples into the studio so that you can experiment with Azure Machine Learning.
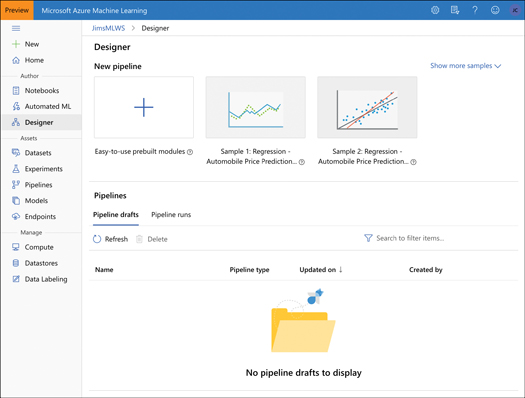
FIGURE 3-26 Azure Machine Learning studio showing the Designer page
Azure Machine Learning is priced based upon your usage. You’re billed for a VM where your Azure Machine Learning assets run. You are also charged a machine learning surcharge and a small amount per hour for usage. If you want to save money, you can choose to reserve your usage for one year at a reduced cost or three years at a higher cost reduction.
Cognitive Services
Microsoft offers numerous application programming interfaces (APIs) that can help you to quickly develop machine learning solutions. These offerings allow you to fast-track your ML capabilities by taking advantage of work Microsoft has done to support its own services like Bing, Microsoft 365, and more. You can think of Cognitive Services as SaaS ML models that you can use directly in your ML solutions without the expense of developing your own.
Cognitive Services includes an API called Computer Vision that makes it easy to build an ML engine that can extract information from images. Computer Vision can do things like recognize objects or recognize a scene, but it can also recognize inappropriate content so you can moderate images. If you want to see Computer Vision in action, you can enter an image URL or upload your own image for analysis at https://bit.ly/az900-computervision.
Along those same lines, the Video Indexer API can analyze video content and extract information from that content. You can easily add closed captioning in multiple languages, recognize people and objects, and search for videos that contain specific words, people, or even emotions.
Numerous speech APIs are also available, from Speech Translation, which offers language translation in real-time to Speaker Recognition, an API that can analyze speech and identify the speaker. Language APIs offer the ability to understand typed commands (useful for creating something like an automated chat agent) or Text Analytics to understand user sentiment in text.
Cognitive Services also provides decision APIs that allow you to do things such as moderate content in images, text, or video. You can also offer users a personalized user experience using the Personalizer API.
Pricing for Azure Cognitive Services is transactional. That means that you pay a small amount for transactions that you process through the service. For a full overview of Cognitive Services pricing, visit https://azure.microsoft.com/en-us/pricing/details/cognitive-services/.
Azure Bot Service
One of the common use cases for Cognitive Services is to build AI conversational experiences. These experiences are common throughout the Internet. In fact, most companies that offer some type of chat interaction almost always start you off with an automated agent. Cognitive Services can help to achieve a quality experience in those situations.
To make it even easier to build powerful AI-driven interaction, Microsoft offers Azure Bot Service. Azure Bot Service is a PaaS offering that runs on Azure App Service. That means that it inherits all the features of App Service such as easy scaling and simple configuration.
You create a Bot Service using the Web App Bot template in the Azure portal. As shown in Figure 3-27, you can choose between C# and Node.js for your SDK language, and you can choose between different bot templates for your specific needs.
Once you’ve created your Bot Service, you have the option of downloading the code so you can customize it, as shown in Figure 3-28. In fact, the Azure portal will walk you through everything you need to do in order to get started with your bot. This includes editing the source code, building the source code, viewing analytics, and so forth. All these tasks are part of the Bot Framework that Microsoft developed to streamline the creation of bots.
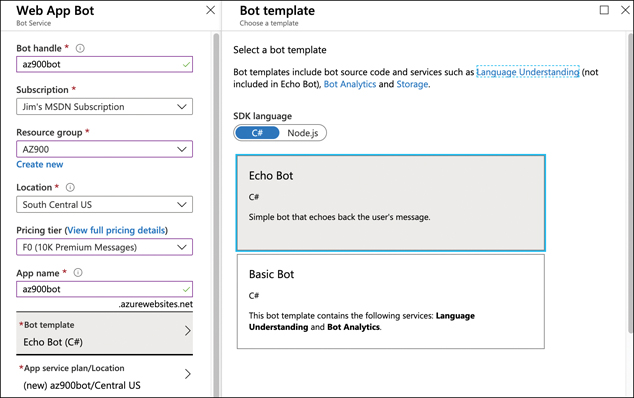
FIGURE 3-27 Creating a bot in Azure Bot Service
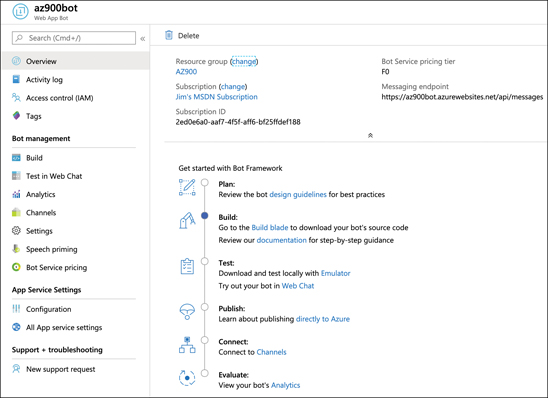
FIGURE 3-28 An Azure Bot Service in the Azure portal
As you’re developing your bot, you can use the Test In Web Chat menu item on the left side in the portal (shown in Figure 3-28) to test how things are going. After clicking that, you’ll be prompted for the type of thing you can say to the bot. In Figure 3-29, you can see the interaction available from the Basic Bot template provided by Microsoft.
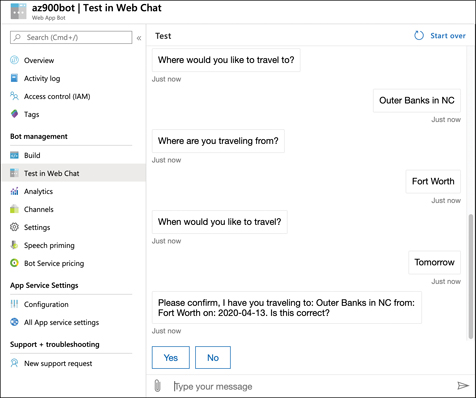
FIGURE 3-29 Interacting with a bot using the testing feature in the Azure portal
Azure Bot Service can be connected to many popular services such as Slack, Facebook Messenger, Microsoft Teams, and more. Each of these is considered a channel within the Bot Service, and the channels that Microsoft provides are called standard channels. However, you can also use what Microsoft calls Direct Line to connect your bot to your own application or website. Direct Line is considered a premium channel, and it will cost a small amount for the messages it uses.
Serverless computing
As you’ve already learned, one of the great advantages of moving to the cloud is that you can take advantage of the large amounts of infrastructure in which cloud providers have invested. You can create VMs in the cloud and pay for them only when they’re running. Sometimes, you just need to “borrow” a computer in order to run a computation or perform a quick task. In those situations, a serverless environment is ideal. In a serverless situation, you pay only when your code is running on a VM. When your code’s not running, you don’t pay anything.
The concept of serverless computing came about because cloud providers had unused VMs in their data centers and they wanted to monetize them. All cloud providers need surplus capacity so they can meet the needs of customers, but when VMs are sitting there waiting for a customer who might want to use them, it means lost revenue for the cloud provider. To solve that problem, cloud providers created consumption-based plans that allow you to run your code on these surplus VMs, and you pay only for your use while your code is running.
Because your serverless code is running on surplus capacity, cloud providers usually offer steep discounts on consumption-based plans. In fact, for small workloads, you might not pay anything at all.
Cognitive Services is an example of a serverless service, but Azure has many other serverless services, many of which don’t fit into the categories we’ve already discussed. They are Azure Functions for serverless compute, Azure Logic Apps for serverless workflows, and Azure Event Grid for serverless event routing.
Azure Functions
Azure Functions is the compute component of Azure’s serverless offerings. That means that you can use Functions to write code without having to worry about deploying that code or creating VMs to run your code. Apps that use Azure Functions are often referred to as Function Apps.
Functions can be created in many different ways. You can create a Function App using:
Microsoft Visual Studio
Microsoft Visual Studio Code
Maven for Java Function Apps
Python command line for Python Function Apps
Azure command line interface (CLI) on Windows or Linux
The Azure portal
Assuming you aren’t creating your Function App using a method specific for a particular language, you can choose between .NET Core, Node.js, Python, Java, or PowerShell Core if you’re using the Code option. You also have the option to create your Function App using a Docker container on a Linux VM.
In Figure 3-30, we’re creating a Function App in the Azure portal, and we’ve selected .NET Core as the Function App runtime so that we can use the C# language to write functions.
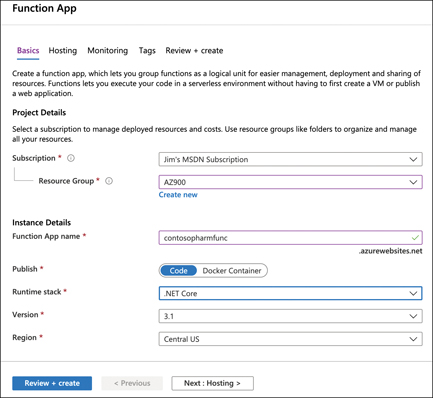
FIGURE 3-30 Creating a new Function App in the Azure portal
After you select your runtime stack and version, you can configure how your Function App is hosted. You can choose between Linux and Windows as your operating system, although some runtime stack selections are valid only for one of the two. You can also choose to run in a serverless plan (which is the default) or run inside of an App Service plan. In Figure 3-31, the Function App is being configured to run on Windows under the Consumption (Serverless) plan type.
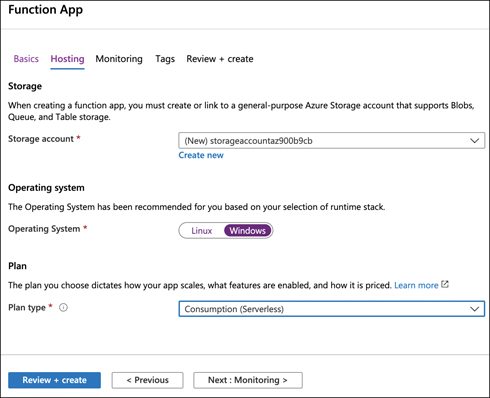
FIGURE 3-31 Configuring hosting options for a Function App
Once your Function App is ready, you can open it in the portal to begin creating functions. Figure 3-32 shows the new Function App in the Azure portal.
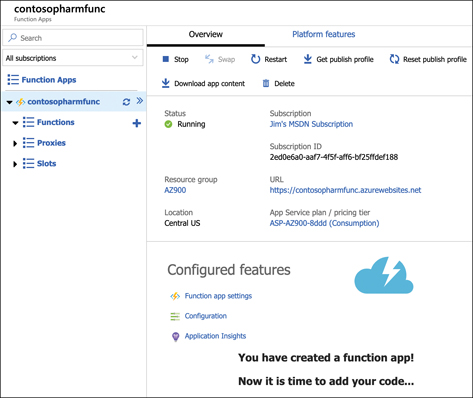
FIGURE 3-32 A new Function App in the Azure portal
From here, you can create a new function, proxy, or slot. A function is code that runs when something triggers it. (We’ll look at triggers soon.) A proxy allows you to configure multiple endpoints for your Function App but expose them all via a single URL. Slots allow you to create a copy of your Function App that isn’t public facing. You can write code and test this copy, and when you are satisfied that it’s ready for production, you can swap it over to production with the click of a button. In App Service, this feature is called Deployment Slots.
If you click Function App Settings under Configured Features (shown in Figure 3-32), we can change some settings for the Function App, as shown in Figure 3-33.
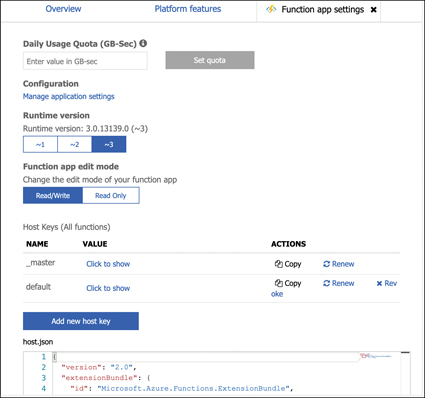
FIGURE 3-33 Function App settings
From this screen, you can configure a daily quota for your Function App. Once you reach the quota, Azure will stop the Function App until the next day. You can also change the Function App runtime version. This is the runtime version of Azure Functions, and while it’s generally advised to use the latest version, if your functions were written in an earlier version, you won’t be able to upgrade them by simply changing the version here. Changing major versions can cause your app to break, so Microsoft will prevent you from changing the version if you have existing functions in your Function App.
You can also change your Function App to read-only mode to prevent any changes to it. This is helpful if you have multiple developers writing code for your app and you don’t want someone changing something without your knowledge. Finally, you can view, renew, revoke, and add new host keys. A host key is used to control access to your functions. When you create a function, you can specify whether anyone can use it or whether a key is required.
If you click Configuration (shown in Figure 3-32), you can configure the settings for the Function App. These are settings specific to App Service. Figure 3-34 shows some of these settings, including whether the app runs in 32-bit or 64-bit, the HTTP version, how you can access your files using FTP, and more.
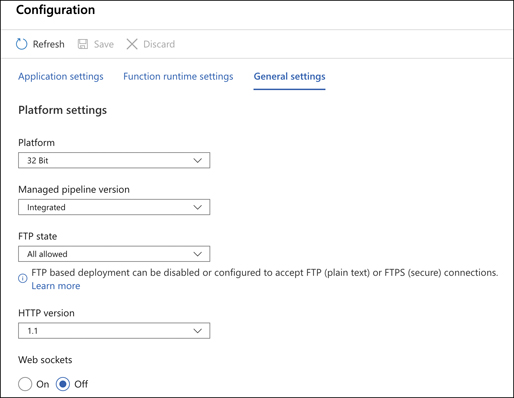
FIGURE 3-34 Some of the Function App settings
Finally, if you click the Platform Features tab shown in Figure 3-32, you can see all the features available to you in the App Service platform, as shown in Figure 3-35. From here, you can configure things such as SSL certificates, custom domain names for your Function App, turn-key authentication, and more.
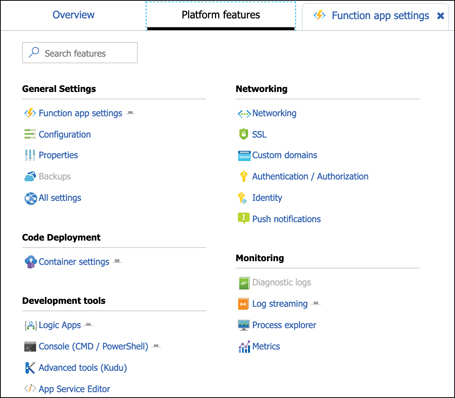
FIGURE 3-35 App Service platform features available to your Function App
To create a new function, click the + sign, as shown in Figure 3-36. You can then choose your development environment. You can choose Visual Studio, Visual Studio Code, or a development environment right inside the Azure portal. Also, you can use a code editor of your choice alongside the Azure Functions Core Tools.
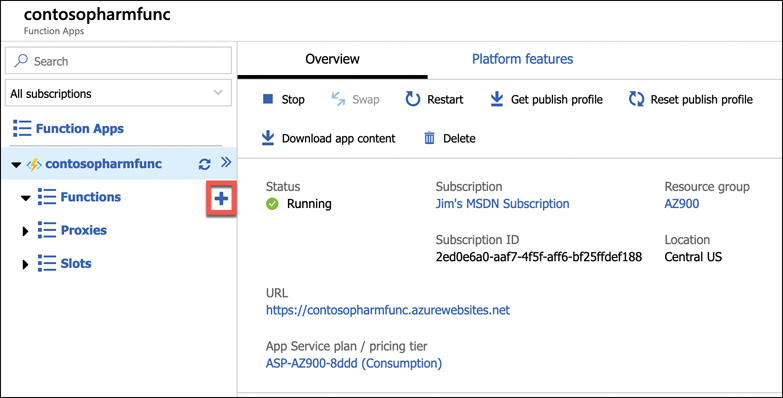
FIGURE 3-36 Creating a function
If you choose any option other than In-Portal, you’ll need to specify how you want to deploy your function to App Service. Your options depend on which development environment you choose, but typically, it will involve either using features of your environment to send the function directly to App Service or using App Service Deployment Center. Either way, deployment is quick and easy.
Depending on which development environment you choose, you will likely need to complete some prerequisite steps in order to develop your function. You’ll see a screen telling you how to make things work correctly. In Figure 3-37, you can see what’s required to use VS Code to develop functions. In most cases, you will be required to install the Azure Functions Core Tools.
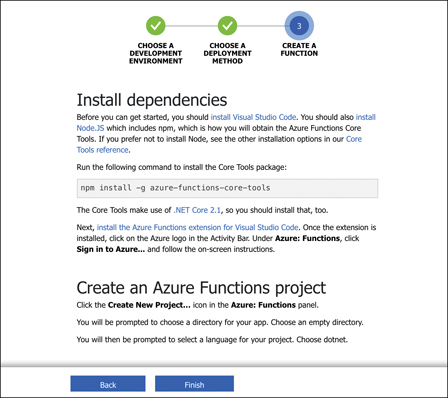
FIGURE 3-37 Creating a function using Visual Studio Code and Azure Functions Core Tools
Functions work using a trigger-based system. When you create your function, you choose a trigger that will kick off your function. When it’s triggered, your function code will run. Typically, you will want your function code to do something simple. If you need a more complex function that performs many things, you can use Function Proxies to create several functions that work together to complete a task. This kind of development is referred to as microservices, and it allows you to quickly swap out functionality by simply changing a single function.
After your function is triggered and the code runs, you can choose what happens using what’s called an output binding. The type of bindings you can use are dependent on the type of function you create. Figure 3-38 shows some of the different output bindings available when using an HttpTrigger for a function. This function will run as soon as a particular URL is requested.
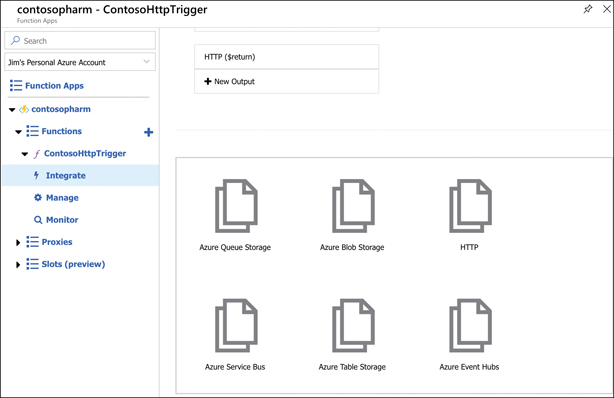
FIGURE 3-38 Output bindings in Azure Functions
You can configure multiple outputs for your function as well. However, for more complex workflows, Logic Apps is often a better choice, and you can integrate Logic Apps directly with Azure Functions.
Logic Apps
Logic Apps are similar to Function Apps in that they are kicked off by a trigger, but what happens after that is completely different. Unlike Function Apps, you don’t have to write code to create some powerful workflows with Logic Apps.
A workflow simply means that a Logic App reacts to something happening and responds by performing a series of tasks, such as sending an email, transferring data to a database, and so on. It can do these things in order, but it can also do two things at once. For example, when a customer orders a product from your e-commerce site, you might want to
Update your inventory count of the product
Generate an invoice for the item
Email the invoice to the customer
Sign the customer up for your newsletter
Generate a shipping label for the item
Logic Apps allows you to create these kinds of complex workflows easily, and because Logic Apps integrates with more than 100 other services (both Azure services and third-party services), you can do just about anything in a Logic Apps workflow.
There are three components in Logic Apps that make workflows possible: connectors, triggers, and actions:
A connector is a component that connects your Logic App to something, such as another Azure service, a third-party service, an FTP server, and so forth. Each connector will have one or more triggers and actions specific to that connector.
A trigger is a specific action that will cause your Logic App workflow to run.
An action is what your Logic App will do as an output.
You can combine multiple actions for a connector, and you can also combine multiple connectors to create complex and powerful workflows.
You create Logic Apps in the Azure portal. Once you create a Logic App, the Logic Apps designer is shown by default. From the designer, you can choose the trigger for your Logic App, as shown in Figure 3-39. The list shown is a brief list of common triggers, but there are many more to choose from. In fact, there’s a trigger for Azure Functions as well, so you can trigger a Logic Apps workflow when your function runs.
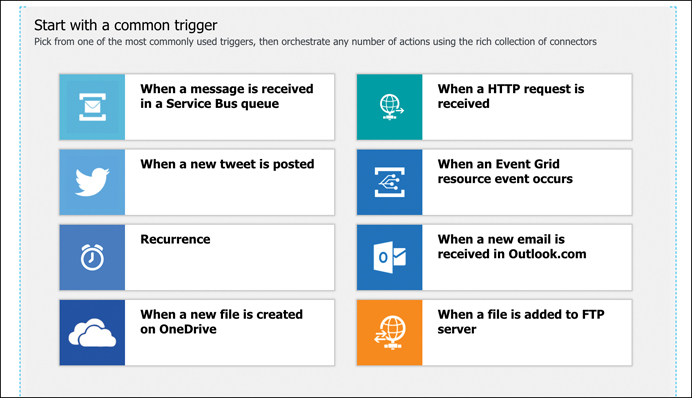
FIGURE 3-39 Common Logic App triggers
If you scroll down, you’ll see many templates you can use to create a Logic App, as shown in Figure 3-40. These templates will automatically configure a Logic App that contains a full workflow that you can modify for your own purposes. This is the fastest way to get started. However, the included templates might not be exactly what you want, so you can also create a blank Logic App and start from scratch.
After you create your blank Logic App, you can choose from several ways to start building your workflow. You can select a trigger from the list, search for a trigger or connector, or you can just select a connector from the list and see what triggers are available. As shown in Figure 3-41, there are many options available to get started.
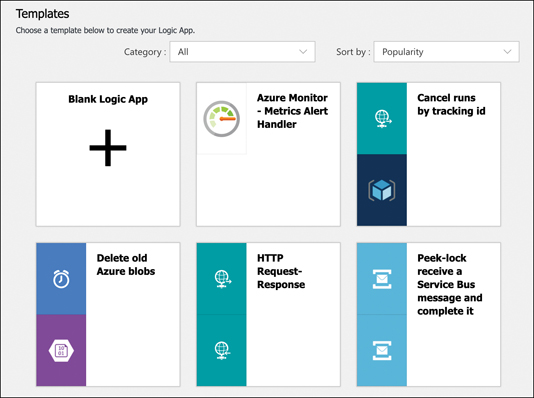
FIGURE 3-40 Logic App templates
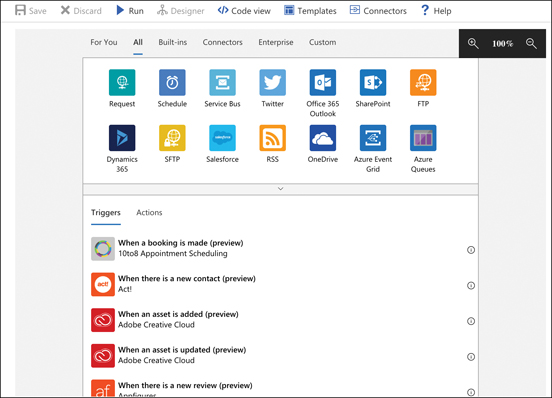
FIGURE 3-41 Adding triggers to your Logic App
Figure 3-41 shows only a small slice of the available connectors in Logic Apps. These connectors span a wide array of complexity, from reacting to file operations in a OneDrive folder to kicking off complex and powerful operations in third-party platforms such as Salesforce. This is the real value of using Logic Apps. Typically, if a development team wanted to integrate an application with a platform like Salesforce, they would have to spend a great deal of time learning Salesforce and learning how to program an application to use it. In fact, many companies would simply hire developers who already have those skills, usually at a high cost. Using Logic Apps, that same company can integrate with platforms like Salesforce and others without even having any developers at all! It’s hard to overstate the value of that kind of easy integration.
Not all integration scenarios are complex and involve complicated platforms. In Figure 3-42, we’ve configured the OneDrive connector to monitor a folder in OneDrive. When a file is modified in that folder, it will start the Logic App workflow. In order to do something when a file is modified, click New Step to add an action.
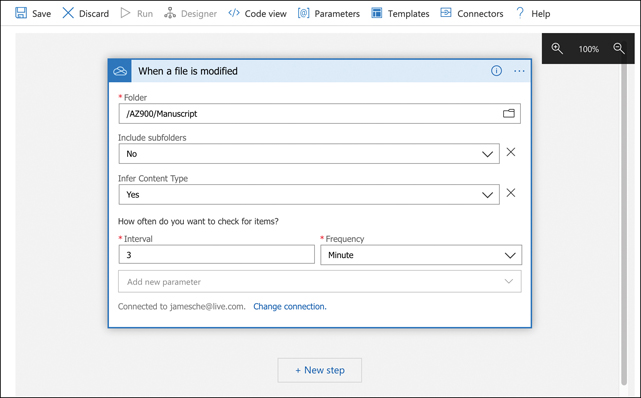
FIGURE 3-42 Using the OneDrive connector
When you click New Step, you’ll see the same kind of screen that shows when the Logic App starts. Because we added a step to a workflow that already has a trigger, Logic Apps shows the actions you can take when the workflow is triggered. There are many actions to choose from, as shown in Figure 3-43.
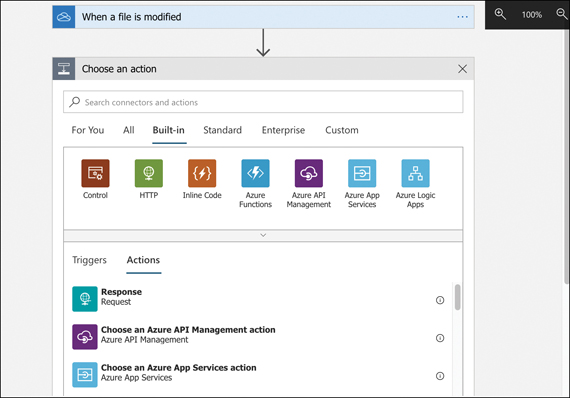
FIGURE 3-43 Adding an action to the Logic App
In Figure 3-44, we configured the Logic App to call a Function App when a file is modified in the OneDrive folder. (Logic Apps uses an HTTP trigger to call a Function App.) You can pass the filename that was modified to the Function App using dynamic content, so that it will know what has changed. Just click File Name from the list. Of course, you can only pass one dynamic content item in your action.
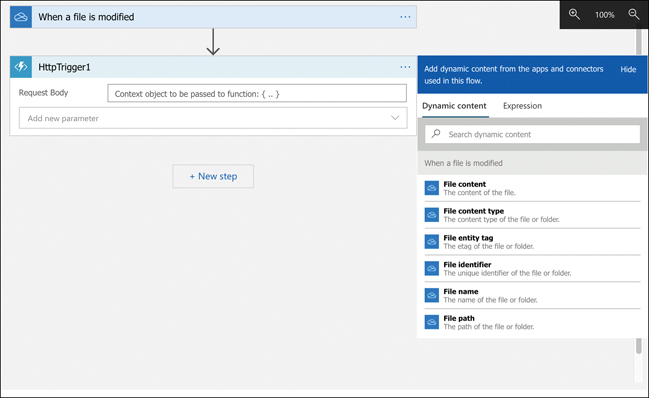
FIGURE 3-44 Configuring a Function App action
You now have a functioning Logic App. You can test the workflow by clicking Save at the top of the designer. The OneDrive connector was configured to check for a modified file every three minutes (see Figure 3-42), so you might need to wait a few minutes before the workflow is triggered. You can also click Run Trigger at the top of the designer to manually run the trigger.
You can monitor your Logic Apps using the Azure portal. Open the app and click Overview to see when your trigger was activated and whether it ran your workflow, as shown in Figure 3-45.
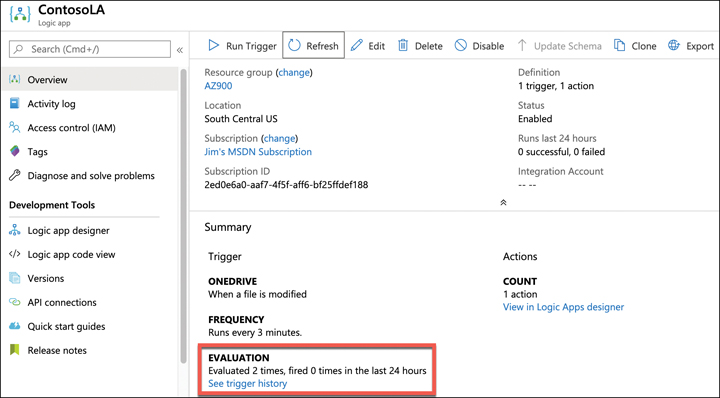
FIGURE 3-45 The Azure portal displaying when the Logic App flow ran
If you click See Trigger History, you can see an entire history of when your trigger was evaluated and when it fired the workflow for your Logic App.
In this case, we’ve used a Logic App to call an Azure Function, but you could have written a log file to Azure Storage or stored some information in an Azure SQL Database. If you want your Logic App to integrate specifically with other Azure services such as this, you can integrate your Logic App with Azure Event Grid for a more optimal experience.
Event Grid
The concept of different Azure services interacting with each other should be pretty familiar to you by now. There are many ways that you can integrate services such as this, and in some cases, you need one Azure resource to know about a change in another Azure resource. You could use a polling method for this, similar to the Logic App checking against OneDrive every three minutes looking for a change. It’s more efficient, however, to enable an Azure service to trigger an event when something specific happens and configure another Azure service to listen for that event so it can react to it. Event Grid provides that functionality.
Both Azure Functions and Azure Logic Apps are integrated with Event Grid. You can configure a function to run when an Event Grid event occurs. In Figure 3-46, you can see the list of Azure resources that can trigger Event Grid events. Not all Azure services are represented in Event Grid, but more services are being added over time.
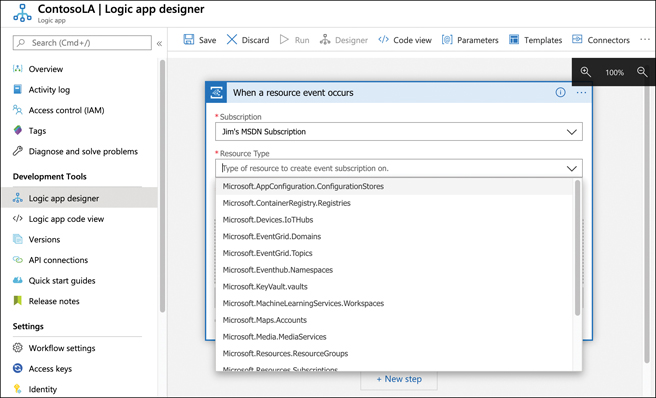
FIGURE 3-46 Resources available in Event Grid
Once you’ve selected the resource type, configure the event you want to listen for. The events that are available might differ depending on the resource you selected. In Figure 3-47, we are creating an event for an Azure subscription.
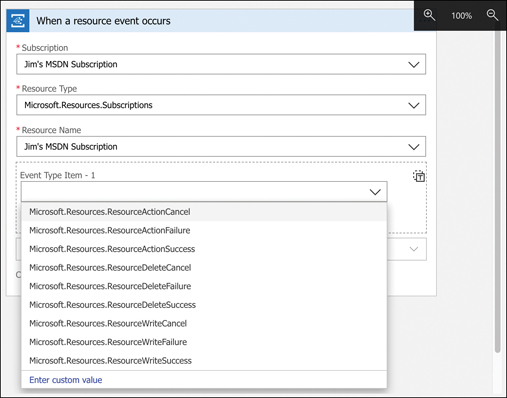
FIGURE 3-47 Events for an Azure subscription
When an event occurs, you can take an action against an Azure resource using the Azure Resource Manager connector in a Logic App. You can also run a script that interacts with the Azure resource to do something like tag a resource or configure it in a way that is specific to your organization.
The primary benefit of using Event Grid in this way is the rapid development of solutions. You also benefit from Event Grid reliably triggering your events. If an Event Grid event fails to trigger for any reason, Event Grid will continue to retry triggering the event for up to 24 hours. Event Grid is also extremely cost effective. The first 100,000 operations per month are free, and after that point, you pay 60 cents for every million operations.
Azure DevOps
Keeping track of work can be a daunting task, especially if that work is delegated to individuals on a large team. Add the complexity involved when that team is developing a complex application (or even a simple application), and the challenges can grow exponentially. Azure DevOps offers a collection of tools that make it much easier to plan, track, and manage such projects.
Azure DevOps is made up of multiple services for helping you with your work. They are:
Azure Boards A visual way to manage and track work for your team using tiles displayed in a drag-and-drop interface
Azure Repos Source and version control using either Team Foundation Version Control or Git
Azure Pipelines Manage software releases through build, test, and release automation
Azure Test Plans Create and track tests to ensure reliable software releases
Azure Artifacts Use popular package feeds from both public and private sources
Azure Boards makes it easy to track and manage not only software releases, but just about any project that involves work. You can easily create new tasks with a mouse click, and you have the flexibility of configuring how each task’s tile looks based on powerful formatting rules. Figure 3-48 shows a simple Azure Boards project I created to track work I was doing while writing this book.
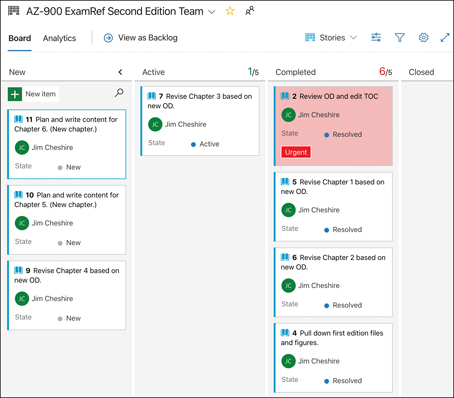
FIGURE 3-48 Azure Boards showing project tracking for a simple project
Each tile in Azure Boards is backed by a DevOps work item that includes quite a bit more detail. Opening a tile displays the underlying work item as shown in Figure 3-49.
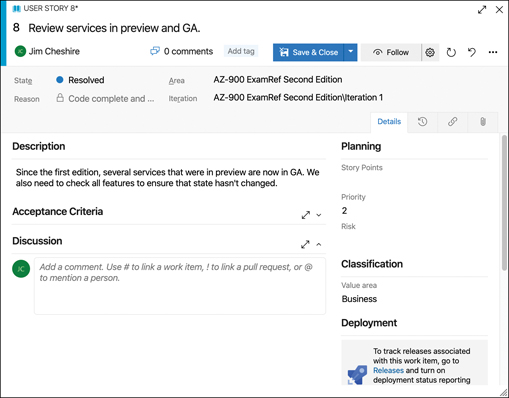
FIGURE 3-49 A work item for a tile in Azure Boards
Azure Repos provides source and version control for a team of developers using either Git (an open source solution for source control) or Team Foundation Version Control (TFVC). Developers who are using Git will have all versions of the repo’s files on their local machines, and they can see the history of every change. Developers using TFVC will only have one version of a file on their machines, and everything else is on the server.
A typical application that a development team might be working on consists of thousands of files containing source code. As the application is developed, many developers are working on modifying those files with new code and changing existing code. A source control system allows the development team to keep track of all changes, and if a change causes a problem, it’s easy for them to roll back changes, even if those changes involve a large number of source files.
There are also times when development teams want to add substantial new features to an existing application, but they want to keep all the code intact for the existing version. Source-control systems allow them to work on the new functionality separate from the existing source, and when they’re confident that everything’s working as designed and they’re ready to incorporate the new feature, they can merge it back into the existing version.
In Figure 3-50, a development project’s files are shown in Azure Repos. A source file is open, so that the source code is visible. Because History has been clicked at the top of the source view, all historical changes can be seen. By clicking Compare, a view is displayed showing the differences between two versions.
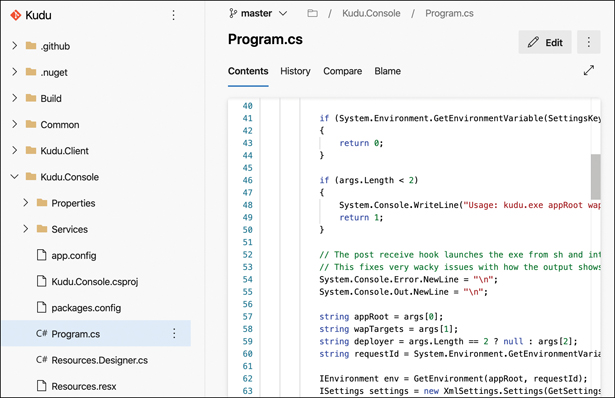
FIGURE 3-50 A repo in Azure Repos showing a source file’s contents
Azure Pipelines provides continuous integration and deployment services for projects. You can configure Azure Pipelines to automatically integrate changes into source code and create a new build of the software for deployment. You can also configure your build process so that tests are run as soon as the build completes, allowing you to find problems before they make it into customers’ hands.
Azure Test Plans provides features that make it easier to test software for problems. Developers can create complex tests. Tests are often based on work items that might contain details on a bug in the software. Once a test has been created, it can be run from within Azure Test Plans from within the web browser, so tests can be run on any device.
Many software applications use packaged components from third parties or from within the developer’s own organization. These packaged components are frequently referred to as artifacts, and Azure Artifacts provides an easy way to keep these artifacts organized. Azure Artifacts also provides the ability to integrate these packages into the build process, including builds that happen within Azure Pipelines.
Azure DevTest Labs
As we were looking at Azure DevOps, we talked a little bit about the concept of testing. A typical test scenario might involve a developer creating an Azure VM in order to run some testing tools and development tools. That developer might also need to configure the VM with various packages that the application they’re testing needs in order to run. In even more complex scenarios, the application might require multiple VMs with multiple configurations.
There are a couple of concerns with developers creating VMs for testing. First, creating a VM manually might take quite a bit of time, especially if the developer needs to install some required packages onto that VM. Second, a developer might end up costing the company a lot of money if they happen to create a VM that’s more powerful than necessary or if they forget to stop or remove the VM after they’ve finished testing.
Azure DevTest Labs solves both problems nicely, and it adds quite a few other features that developers and IT departments will both find to be helpful. VMs can be created in a DevTest Lab that are preconfigured for specific purposes. When developers need to use a VM for testing, they simply look at a list of available VMs and claim the VM they need. That VM is then allocated to them until they unclaim it. Claiming a VM takes only seconds because the VM doesn’t have to be created again when it’s claimed.
As shown in Figure 3-51, creating a DevTest Lab is quick and easy. You simply give your lab a name, select the Resource Group, and specify a couple of settings. The DevTest Lab would usually be created by the IT department, the lead developer, or someone else in charge of a particular project.
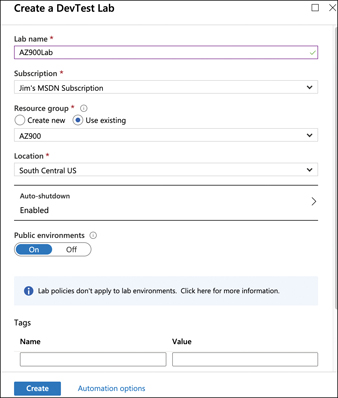
FIGURE 3-51 Creating a DevTest Lab in the Azure portal
Once a DevTest Lab is created, VMs will need to be created inside it so that developers can use them for testing. To create a VM, click the Add button, as shown in Figure 3-52.
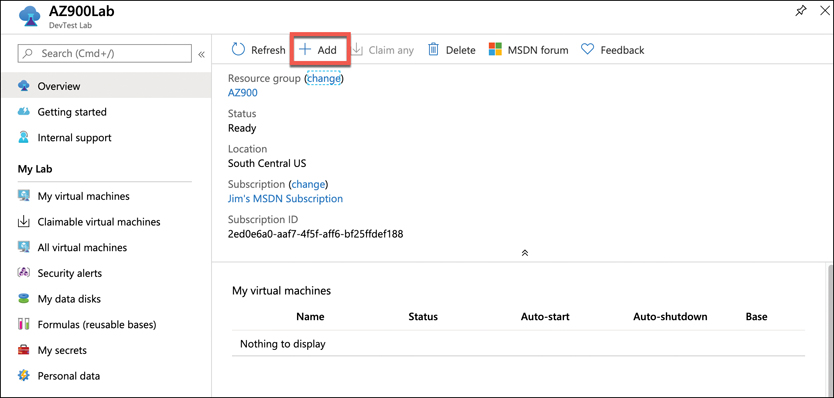
FIGURE 3-52 Click Add to add a new VM to a DevTest Lab
When you add a VM to a DevTest Lab, you first select the base for the VM. The base can be a VM template from the Azure Marketplace or other sources. It can also be a VM that has been specially configured for a particular project and saved out as a formula or a custom image. We’ll talk more about formulas and custom images later in this section.
In Figure 3-53, a VM is being created that uses the Windows Server 2016 Datacenter base image. You can choose to create the VM with just the base image installed, but you can also add additional components to an image by adding an artifact. Just as we discussed earlier related to Azure DevOps, artifacts are packaged components that might be necessary for a particular configuration. You can add artifacts to a VM by clicking Add Or Remove Artifacts at the bottom of the screen, as shown in Figure 3-53.
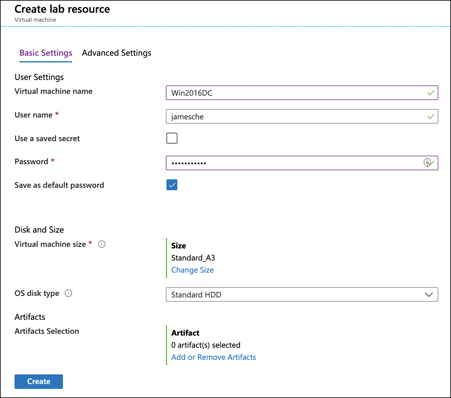
FIGURE 3-53 Adding a new VM to a DevTest Lab
It’s very important to understand that when a VM is created in DevTest Labs, it defaults to being dedicated to a single user and is not claimable. If you are creating a VM that you want others to be able to claim and use, you must click Advanced Settings at the top of the screen shown previously in Figure 3-53 and configure the machine to be claimable, as shown in Figure 3-54.
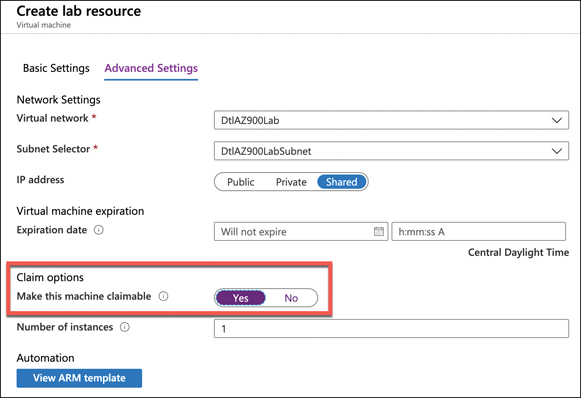
FIGURE 3-54 Configuring a VM to be claimable by others
In some cases, the base images won’t contain the configuration you need, even with artifacts added. For example, you might have a proprietary software package your company uses that you want to be included in your VM image, or you might have a specific OS configuration that you need for your VM. In these cases, you can create a custom image or a formula on which to base your new VMs.
Custom images and formulas are similar, but there is one key difference. A custom image is an image that is based on a VHD from an existing VM. A formula is also based on a VHD, but a formula also contains settings that are specific to DevTest Labs, such as VM size, included artifacts, and so forth. A formula, however, often uses a custom image as a base.
To create a custom image, configure the VM the way you want it and then select it from the list of VMs in the DevTest Lab. Click Create Custom Image and fill out the necessary fields, as shown in Figure 3-55.
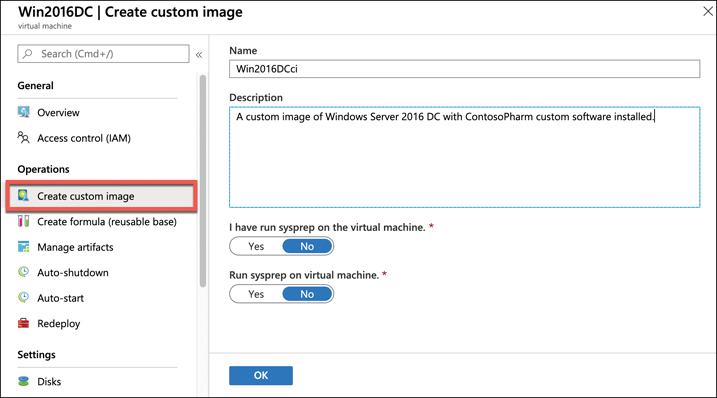
FIGURE 3-55 Creating a custom image in DevTest Labs
After you click OK to create the custom image, it will take a few minutes before the image is available as a base for other VMs.
To create a formula, click Formulas in the menu shown previously in Figure 3-52 and then click Add to create a new formula. Select a base for your formula. In Figure 3-56, the first base image listed is a custom image created earlier from a VM in a DevTest Lab.
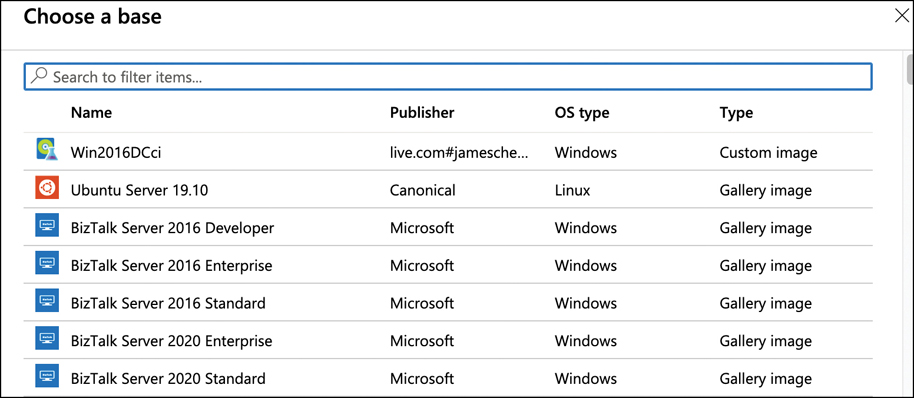
FIGURE 3-56 Choosing a base image for a formula
Once you’ve selected a base for your formula, you can configure the DevTest Lab settings you want for your formula, as shown in Figure 3-57. VMs created with this formula will have these settings preconfigured.
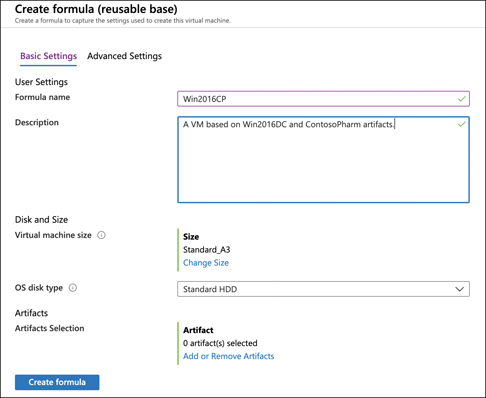
FIGURE 3-57 Specifying settings for a DevTest Lab formula
Another cost-saving feature of DevTest Labs is the auto-shutdown property for VMs. By default, all VMs are created with auto-shutdown enabled, and this means that after a certain period of time, unused VMs will be shut down so that you won’t have to pay for them.
IT administrators or others also can define policies in DevTest Labs. These policies allow you to control VM sizes that can be created, the number of VMs per user and per lab, and so forth. To configure policies, click Configuration And Policies on the menu for your DevTest Lab.
Policies can be configured by clicking the desired policy on the menu and then configuring the policy. In Figure 3-58, a policy is being configured that limits the available VM sizes to Standard_A0, Standard_A1, and Standard_A2. Once this policy has been saved, users will not be able to create VMs unless they are one of these three sizes.
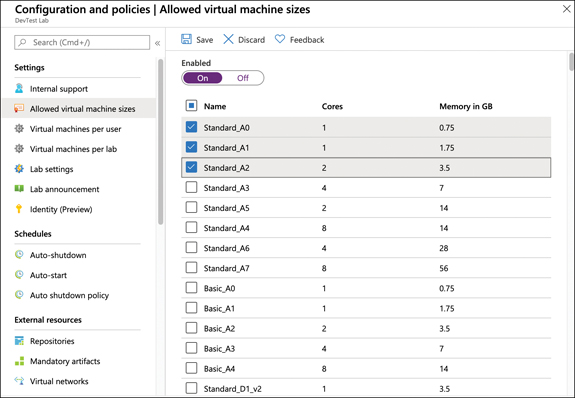
FIGURE 3-58 Configuring a policy for allowed virtual machine sizes
Skill 3.2: Describe Azure management tools
We’ve talked a lot about the Azure portal, and you’ve had the opportunity to use it when interacting with several different Azure services. However, there are many other ways that you can create and manage your Azure services.
Many Azure users want to script interactions with their Azure services, especially when they have a need to interact with a large number of VMs or other Azure resources. For those situations, Azure offers command line tools to help.
Azure users also want to make sure they are getting the most out of their Azure services, and tools such as Azure Advisor and Azure Monitor can help to keep users up-to-date and compliant with Azure best practices and aware of how their Azure resources are performing. When there’s a problem, Azure Service Health can also be helpful in determining if the problem is with your app or with Azure itself.
Azure portal
The Azure portal that is in use today is the third major iteration of the Azure portal, and it came about when Microsoft moved to ARM. Everything that you do in the Azure portal calls ARM on the back end.
The first time you open the Azure portal, you’ll be prompted to take a tour of the portal. If you’re completely unfamiliar with the portal, taking a tour will help you to get a feel for how it works. If you choose not to and change your mind later, you can click the question mark in the top toolbar to access the guided tour at any time.
The default view in the portal is Home, as shown in Figure 3-59. From here, you can see icons for various Azure services, and if you click one of those icons, it will show you any resources of that type that you’ve created. Clicking the Settings button at the upper left displays a menu on the left side that includes these same icons and more.
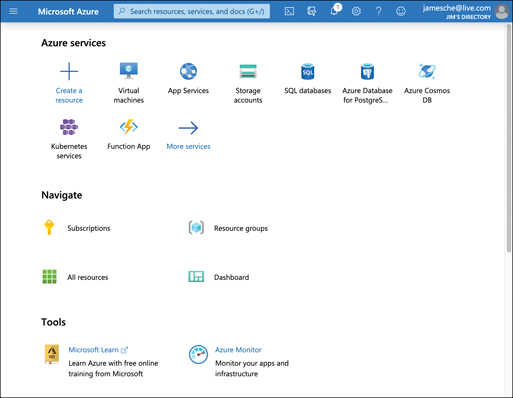
FIGURE 3-59 The Home screen in the Azure portal
If you already have Azure resources you’ve created, you can navigate to them by clicking one of the links in the Navigate section. If you’ve recently viewed one of your resources, you’ll see another section with your recently accessed resources, so you can easily access them again with one click.
Along the top colored bar, you’ll find a search bar where you can search for Azure services, docs, or your Azure resources. To the right of the search box is a button that will launch Azure Cloud Shell. Cloud Shell is a web-based command shell where you can interact with Azure from the command line. You can create Azure resources and more. As you’re reading through Azure documentation, you might see a Try It button, and those buttons use Cloud Shell to help you test out different services and features.
To the right of the Cloud Shell button is a Filter button that allows you to configure the portal to only show resources in a certain Azure subscription or Azure Active Directory. To the right of that is the Notification button. This is where you’ll see notifications from Azure that are related to your services and subscription.
To the right of the notifications button is the Settings button. Clicking Settings brings up a panel where you can alter portal settings, as shown in Figure 3-60.

FIGURE 3-60 Portal settings
From Settings, you can change your default view, choose whether the menu is docked or flies out when you click the menu button, alter the theme of the portal, and disable toast notifications, which are pop-up notifications that Microsoft might display from time to time. Links are also provided that allow you to restore default settings, export your settings, or delete all your settings and dashboards. (We’ll talk about dashboards later in this section.)
If you click your name in the upper-right corner (shown previously in Figure 3-59), you can log out or switch to other Azure accounts. You can also change the Azure Active Directory to access resources in another directory. This is helpful if your company has a corporate directory and you also have a personal directory.
As mentioned earlier, if you click the Settings icon in the upper-left portion of the portal, you’ll see a menu that contains a default list of Azure resources. Clicking one of those will display all resources of that type. If you’d like to add an Azure service to the list, click All Services, as shown in Figure 3-61.
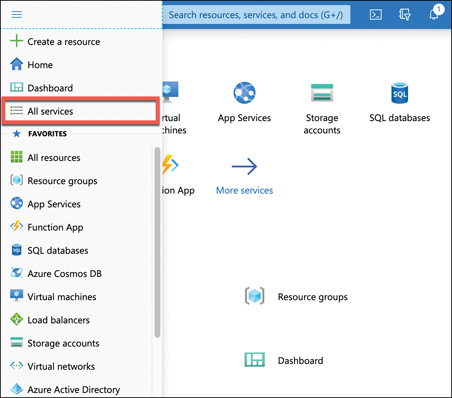
FIGURE 3-61 The Azure portal menu showing the All Services menu item
From the list of all Azure Services, locate the service you want to add to the list and click the star to the right of the service to mark it as a favorite, as shown in Figure 3-62.
In Figure 3-63, we clicked App Service Plans on the menu to see all the App Service plans. From this list, you can click a resource to see that resource. You can also click a column header to sort by that column, assuming you have more than one resource of that type. Click Manage View to edit the columns that are displayed here, save the current view, and more. To create a new resource of this type, click Add.
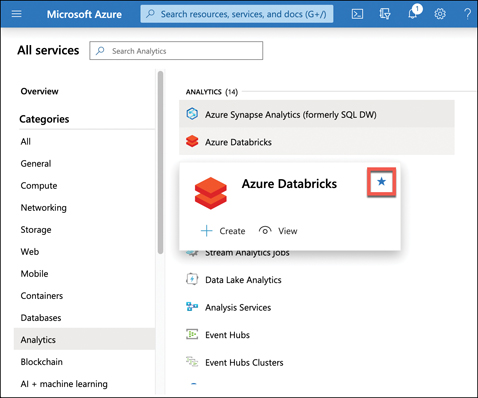
FIGURE 3-62 Making an Azure service a favorite so it will appear on the main menu
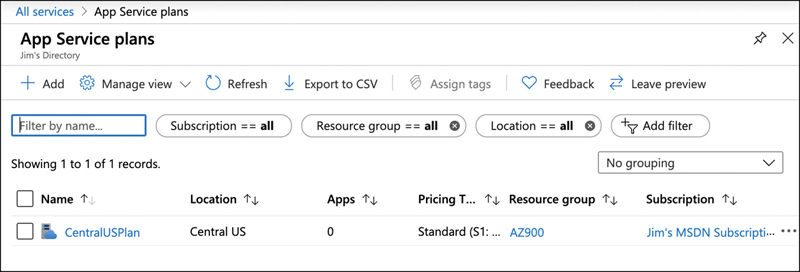
FIGURE 3-63 Viewing an App Service plan in the portal
When you click a particular resource, it will open that resource in the portal. Along the left side will be a menu that’s specific to the type of resource you opened. In the main window, you’ll see different items based on the type of resource you’re viewing. These window areas in the portal are often referred to as blades.
In Figure 3-64, you’ll see an App Service web app in the portal. The Overview blade is a blade that’s common to most Azure resources, but the information that appears there will differ based upon the resource. In a web app, you can see the resource group it’s in, the status, the location, and more. In the upper right is a pin button. If you click that pin, it will add this web app to the portal dashboard.
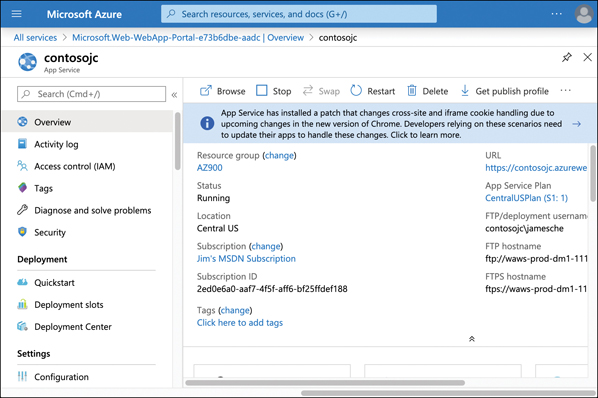
FIGURE 3-64 Viewing a web app in the portal
Along the top of the blade for the web app are several buttons for interacting with the resource. For a web app, you have a Browse button that will open the app in a browser, a Stop button to stop the web app, a Swap button to swap deployment slots, and so on. Each resource type will have different buttons available to you so you can easily interact with the resource from the Overview blade.
If you click an item in the menu at the left, the content from the Overview blade is replaced with the selected new item. In Figure 3-65, we have clicked Diagnose And Solve Problems, which replaces the Overview blade with new content from the Diagnose And Solve Problems blade.
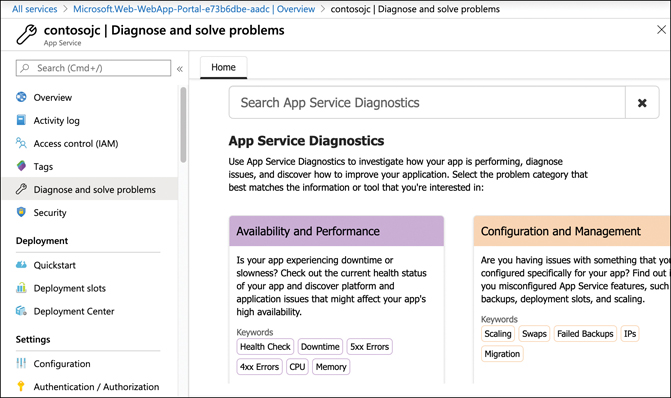
FIGURE 3-65 A new blade
As you use the portal, you’ll find that there is inconsistency between different services. Each team at Microsoft has their own portal development team, and they tend to design portal interfaces that make sense for their own team. For that reason, you might see buttons on the top in some blades and buttons on the bottom in other blades.
You can customize your portal experience using the dashboard. If you click Dashboard from the portal menu, you’ll see your default dashboard. As you’re managing your resources, click the pin icon (as shown in the upper-right portion of Figure 3-64) to pin tiles to your dashboard. You can then move these tiles around and customize them in other ways to create a view that’s unique to your needs.
To customize your dashboard, click Dashboard in the menu to show the dashboard and then click Edit, as shown in Figure 3-66.
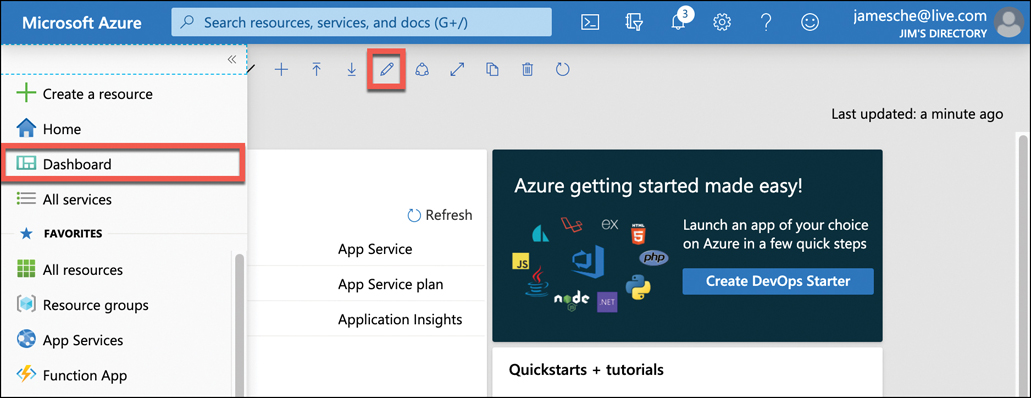
FIGURE 3-66 The Edit button allows for customization of your dashboard
From the customize screen shown in Figure 3-67, you can change the name of your dashboard by clicking inside the current name and changing it to a new name. You can add tiles to the dashboard by choosing from one of the hundreds of tiles available in the Tile Gallery on the left side of the portal, and you can search and filter the list if necessary. If you hover over an existing tile, you’ll see a Delete button and a menu button that is represented by three dots. Click the Delete button to remove the tile from the dashboard. Click the menu button to access a context menu where you can resize the tile.
When you’re satisfied with your dashboard, click Done Customizing to close the customization screen.
You can create new dashboards for specific purposes by clicking the plus sign shown previously in Figure 3-66. This takes you into a customization screen for your new dashboard, just like the one shown in Figure 3-67.
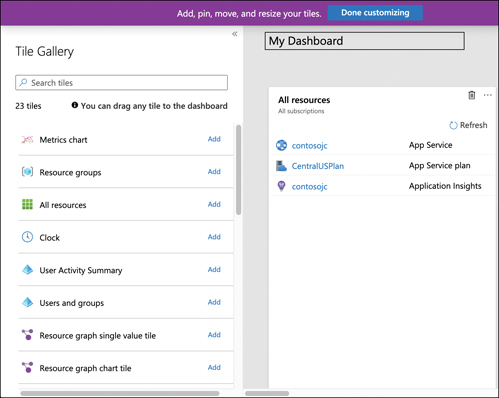
FIGURE 3-67 Customizing a dashboard
In Figure 3-68, we’ve created a dashboard specific to web apps. You can easily switch between this dashboard and the default dashboard by clicking the down arrow next to the dashboard name.
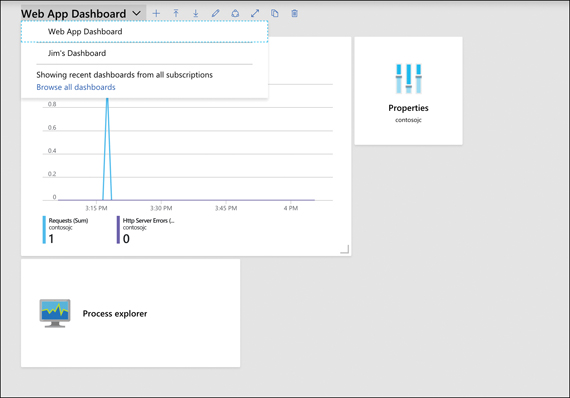
FIGURE 3-68 Switching between dashboards
Azure PowerShell
If you’re a PowerShell user, you can take advantage of that knowledge to manage your Azure resources using the Azure PowerShell Az module. This module offers cross-platform support, so whether you’re using Windows, Linux, or macOS, you can use the PowerShell Az module.
Before you can use the PowerShell Az module, you’ll need to install it. To do that, you first need to run PowerShell elevated. In Windows, that means running it as an Administrator. In Linux and macOS, you’ll need to run it with superuser privileges using Sudo.
To install the module, run the following command.
Install-Module -Name Az -AllowClobber
When you install a new PowerShell module, PowerShell checks all existing modules to see if they have any command names that are the same as a command name in the module you’re installing. If they do, the installation of the new module fails. By specifying -AllowClobber, you are telling PowerShell that it’s okay for the Az module to take precedence for any commands that also exist in another module.
If you are unable to run PowerShell elevated, you can install the module for your user ID only by using the following command:
Install-Module -Name Az -AllowClobber -Scope CurrentUser
Once you’ve installed the module, you need to sign in with your Azure account. To do that, run the following command:
Connect-AzAccount
This command will display a token in the PowerShell window. You’ll need to browse to https://microsoft.com/devicelogin and enter the code in order to authenticate your PowerShell session. If you close PowerShell, you’ll have to run the command again in your next session.
If you have more than one Azure subscription, you’ll want to set the active subscription so that commands you enter will affect the desired subscription. You can do that using the following command:
Set-AzContext -Subscription "subscription_id"
Replace subscription_id with the subscription ID of your Azure subscription you want to use with the Az module.
All Az module commands will have a common syntax that starts with a verb and an object. Verbs are things like New, Get, Move, or Remove. The object is the thing that you want the verb to affect. For example, the following command will create a resource group called MyRG in the South Central US region:
New-AzResourceGroup -Name MyRG -Location "South Central US"
If this succeeds, you’ll see a message letting you know that. If it fails, you’ll see an error. To remove the resource group, run the following command:
Remove-AzResourceGroup -Name MyRG
When this command is entered, you’ll be asked to confirm whether you want to delete the resource group. Type a y and the resource group will be removed, as shown in Figure 3-69.
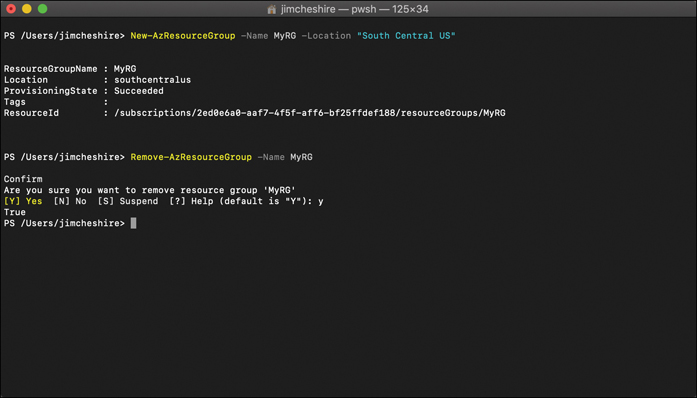
FIGURE 3-69 Creating and deleting a resource group with the Az module
In many situations, you will be including PowerShell commands in a script so that you can perform a number of operations at once. In that case, you won’t be able to confirm a command by typing y, so you can use the -Force parameter to bypass the prompt. For example, you can delete the resource group using the following command and you won’t be prompted.
Remove-AzResourceGroup -Name MyRG -Force
You can find all the commands available with the PowerShell Az module by browsing to https://bit.ly/az900-powershellaz. and clicking Reference in the left menu.
Azure CLI
As I pointed out earlier, one of the main benefits of PowerShell is the ability to script interactions with Azure resources. However, if you want to script with PowerShell, you’ll need someone who knows PowerShell development. If you don’t have anyone who can do that, the Azure command-line interface (Azure CLI) is a great choice. Azure CLI can be scripted using shell scripts in various languages like Python, Ruby, and so on.
Like the PowerShell Az module, the Azure CLI is cross-platform and works on Windows, Linux, and macOS as long as you use the 2.0 version or later. Installation steps are different depending on your platform. You can find steps for all operating systems at https://bit.ly/az900-installcli.
Once you install the Azure CLI, you’ll need to log in to your Azure account. To do that, run the following command:
az login
When you run this command, the CLI will open a browser automatically for you to log in. Once you log in, if you have multiple Azure subscriptions, you can set the default subscription by entering the following command:
az account set --subscription "subscription_id"
Replace subscription_id with the subscription ID you want to use.
To find a list of commands you can run with the CLI, type az, and press Enter. You’ll see a list of all the commands you can run. You can find detailed help on any command by entering the command and adding a --help parameter. Figure 3-70 shows the help for az resource.
You can take this a step further if you aren’t sure what the commands do. You can, for example, run the following command to get help on the syntax for az resource create:
az resource create --help
This provides you with help and example commands to understand the syntax.
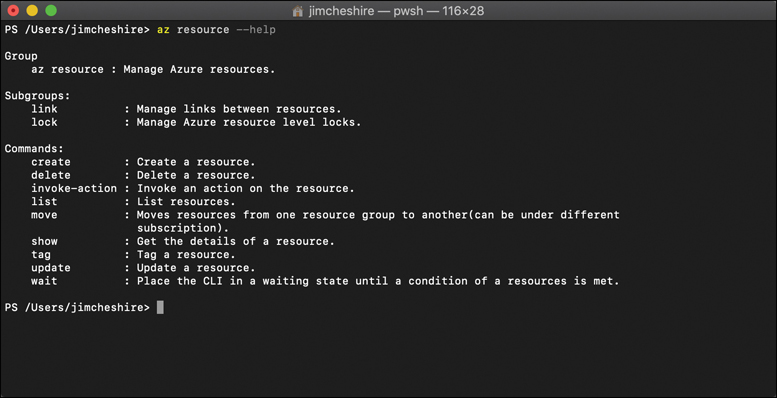
FIGURE 3-70 Azure CLI help
An even easier way to learn the CLI is to switch into interactive mode. This provides you with auto-complete, the scoping of commands, and more. To switch into interactive mode, enter az interactive at the command prompt. The CLI will install an extension to add this functionality. Figure 3-71 shows the Azure CLI with interactive mode active. At the command prompt, we has been typed, and it’s displaying the rest of the command in dimmed text. You can press the right arrow key to enter the dimmed text in one keystroke.
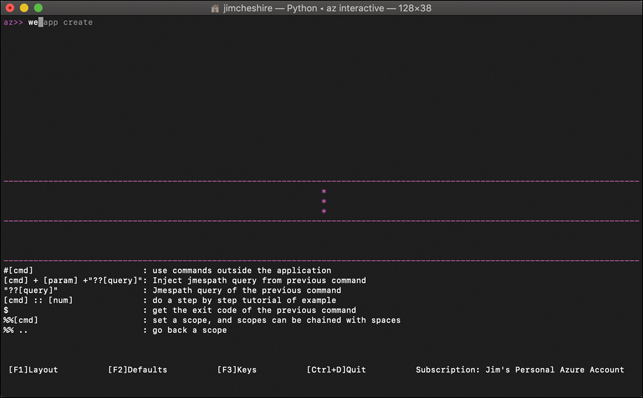
FIGURE 3-71 CLI interactive mode
You can install additional extensions for added functionality. Because the CLI uses an extension architecture, Azure teams can provide support for new functionality without having to wait for a new CLI release. You can find a list of all available extensions that Microsoft provides by running the following command:
az extension list-available --output table
This will not only show you available extensions, but it will show you if you already have the extension installed and whether there’s an update you should install. To install an extension, run the following command:
az extension add --name extension_name
Replace extension_name with the name of the extension you want to install.
Azure Cloud Shell
As we’ve already seen, command line access to your Azure resources with PowerShell and the Azure CLI is powerful and flexible, and we also learned that you can install extensions to add more power to your command line. However, if you use multiple machines, you’ll need to install those extensions on each machine and that might be a hassle. You’re also limited to running these command line tools on your computer. You can’t run them on your phone or your tablet when you’re away from your computer.
The natural solution to these problems is to have your command line tools available to you in the cloud, and that’s exactly what Microsoft did with Azure Cloud Shell.
To access Cloud Shell, click the Cloud Shell button in the Azure portal, as shown in Figure 3-72.
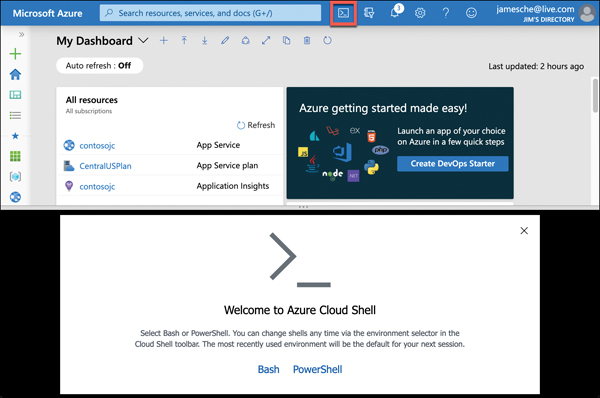
FIGURE 3-72 Cloud Shell in the Azure portal
The first time you launch Cloud Shell, you’ll need to select the environment you want to use. You can choose between Bash and PowerShell, but if you change your mind later, you can change it at any time. Once you select an environment, you’ll also need to create an Azure storage account. Cloud Shell persists anything you install and your settings throughout all your devices, so you need a storage account to persist those. In Figure 3-73, a storage account is being created for Cloud Shell.
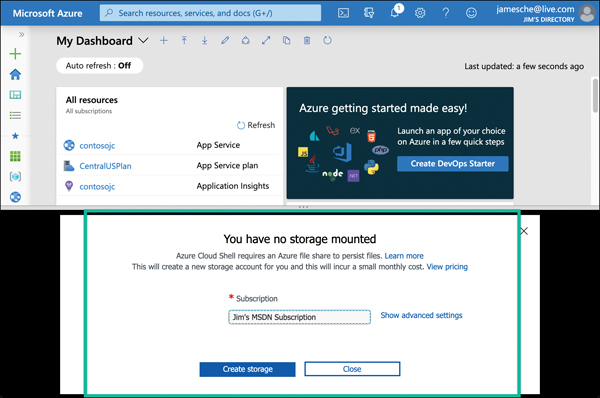
FIGURE 3-73 Creating a storage account for Cloud Shell
Once the storage account is created, Cloud Shell will launch a session as shown in Figure 3-74.

FIGURE 3-74 A Cloud Shell session
From Cloud Shell, you can run any of the commands you can run in the Azure CLI. If you’re in PowerShell, you can also use commands from the Az PowerShell module. At the top of the Cloud Shell window is a toolbar. To change between PowerShell and Bash, select the desired environment from the drop-down menu. Next to that drop-down menu is the “power” button that restarts the Cloud Shell session, followed by a Help button and a Settings button for changing the text size and the font. To the right of the Settings button is a button that allows you to upload or download files into your file share for Cloud Shell, followed by a button that opens a new session of Cloud Shell in a new browser tab.
The Open Editor button on the toolbar will open an instance of the Monaco Editor, a code editor that makes it easy to edit scripts and other files. In Figure 3-75, a JSON file is open in the editor and file browser is shown at the left.
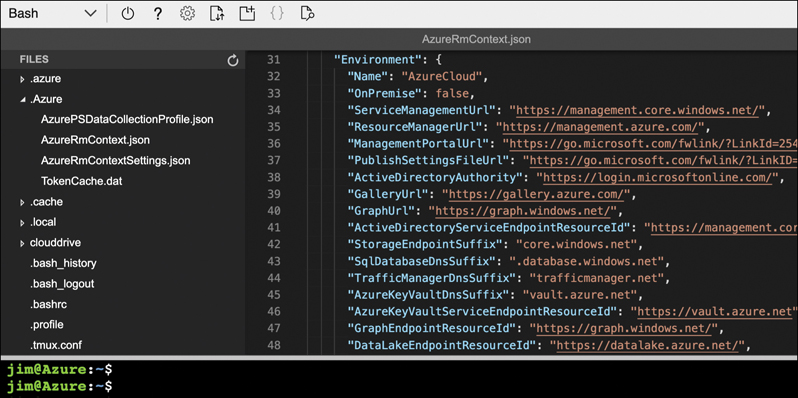
FIGURE 3-75 The file editor in Cloud Shell
The last button on the toolbar is the Web Preview button. This button allows you to run a web application using the files in the current folder inside of your web browser. This is a powerful tool for developers who might be developing web applications using Cloud Shell.
In Figure 3-76, I’m running a .NET Core web app in Cloud Shell using the dotnet run command. (The dotnet application is used to start applications written for .NET Core.) After I do that, I can see that the app is running on the Cloud Shell instance on port 5000.
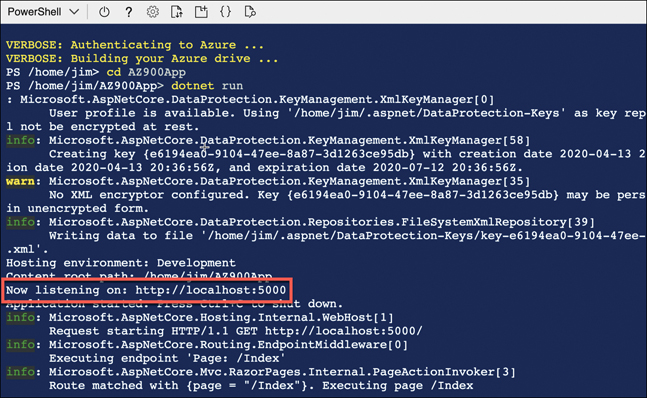
FIGURE 3-76 Running a .NET Core web app from Cloud Shell
If you want to open that in a browser and view it, click Web Preview in Cloud Shell and choose Configure. Enter the port number (5000 in this case), as shown in Figure 3-77.
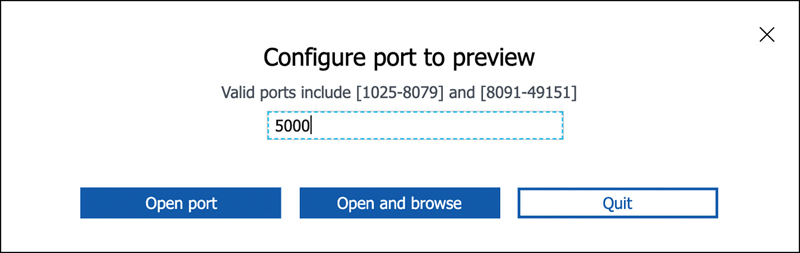
FIGURE 3-77 Configuring a port for Web Preview in Cloud Shell
I can then click Open And Browse and see my web app in my browser, as shown in Figure 3-78. It’s clear from my site that I have some styling issues with a CSS file, and previewing it allows me to troubleshoot that problem and any other problems with my app.
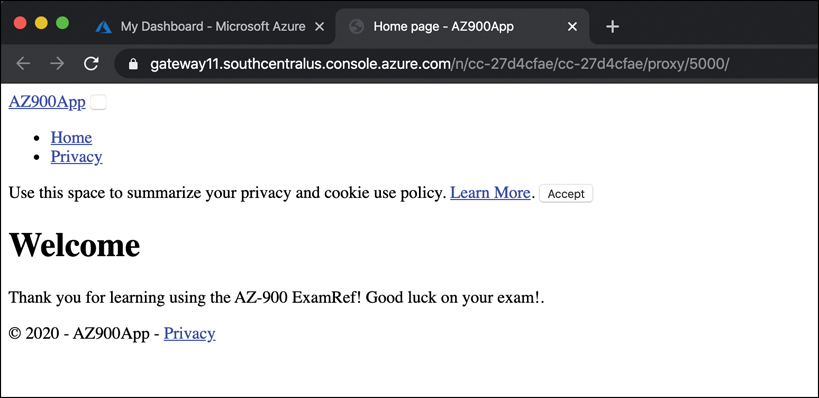
FIGURE 3-78 Browsing a web app using Web Preview
So far, we’ve only looked at using Cloud Shell from the Azure portal, but that’s not the only way to access Cloud Shell. The Azure documentation provides many examples of PowerShell and Azure CLI scripts, and in many cases, there’s a Try It button that you can click to try the script from within your browser. When you click the Try It button, an instance of Cloud Shell will open so that you can easily enter the script and run the commands, as shown in Figure 3-79.
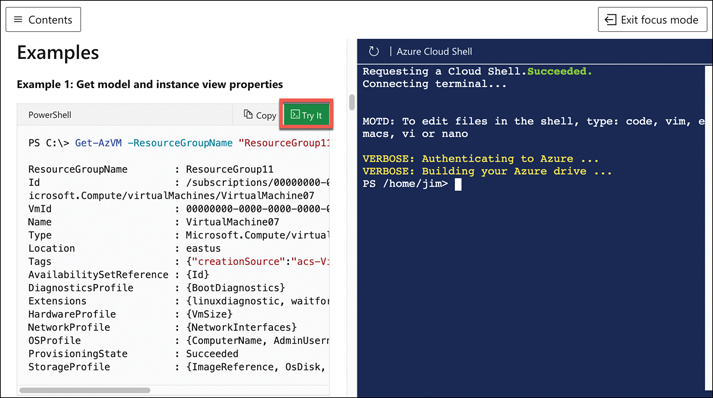
FIGURE 3-79 Cloud Shell’s integration with Microsoft documentation
Azure mobile app
If you own an Android or iOS device, you can download the Azure mobile app to manage your Azure resources from your device. You can always browse to the Azure portal on your device, and you’ll get an experience customized for smaller screens. However, just as with other websites you might use, an app provides a better first-class experience on a mobile device.
When you first launch the Azure mobile app, you’ll be asked to log in to your Azure account. You’ll then see a screen like the one shown in Figure 3-80.
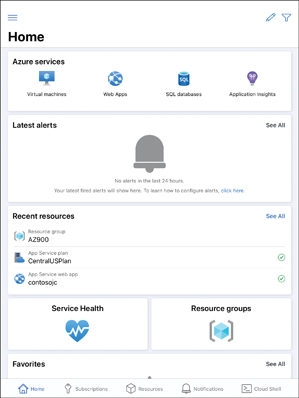
FIGURE 3-80 The Azure mobile app
From the home screen, you can review your Azure services, look at Service Health to determine if there’s an Azure outage, and more. If you tap an Azure service, you’ll see a list of all resources of that service type. Tapping a resource allows you to interact with it. You won’t have the full functionality of the Azure portal, but you will be able to see details of the resource and perform basic functions against it.
In Figure 3-81, an Azure virtual machine is displayed in the Azure mobile app. At the bottom, Stop, Restart, and Connect links are shown.
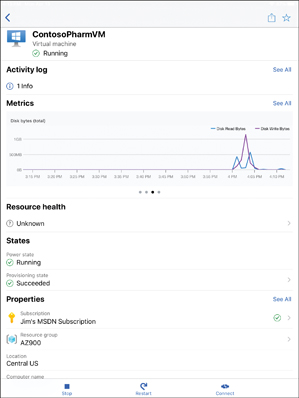
FIGURE 3-81 An Azure VM in the Azure mobile app
Even though you don’t have the full Azure portal experience in the Azure mobile app, there’s still a lot of power under the hood. If you click the Cloud Shell button in the lower right (shown previously in Figure 3-80), an instance of Cloud Shell will launch, as shown in Figure 3-82. From here, you can run the same commands you can run in Cloud Shell on your computer. You can switch from PowerShell to Bash, run Azure CLI and Az PowerShell commands, and so forth.
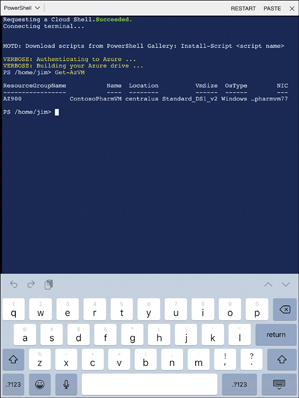
FIGURE 3-82 Cloud Shell running in Azure mobile app
Azure Advisor
Managing your Azure resources doesn’t just include creating and deleting resources. It also means ensuring that your resources are configured correctly for high availability and efficiency. Figuring out exactly how to do that can be a daunting task. Entire books have been written on best practices for cloud deployments. Fortunately, Azure can notify you about problems in your configuration so you can avoid problems. It does this via Azure Advisor.
Azure Advisor can offer advice about high availability, security, performance, and cost. To access Azure Advisor, log in to the Azure portal and click Advisor in the menu on the left. Figure 3-83 shows Azure Advisor with two high impact recommendations for security.
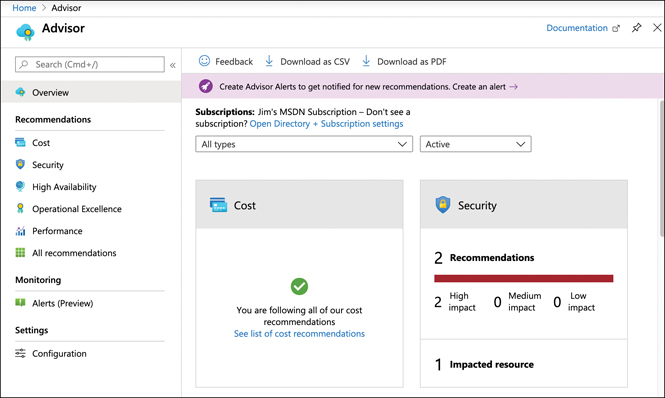
FIGURE 3-83 Azure Advisor
To review details on a recommendation, click the tile. In Figure 3-84, we have clicked the Security tile, and you can see a recommendation to enable MFA (multifactor authentication) and add another owner to my subscription.
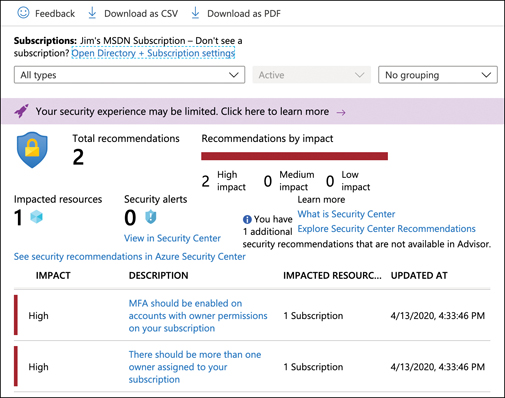
FIGURE 3-84 Advisor recommendations
You don’t have to do what Azure Advisor recommends. If you click the description, you can decide to postpone or dismiss the alert, as shown in the lower-right corner in Figure 3-85. If you choose to postpone the alert, you have the option of being reminded in 1 day, 1 week, 1 month, or 3 months.
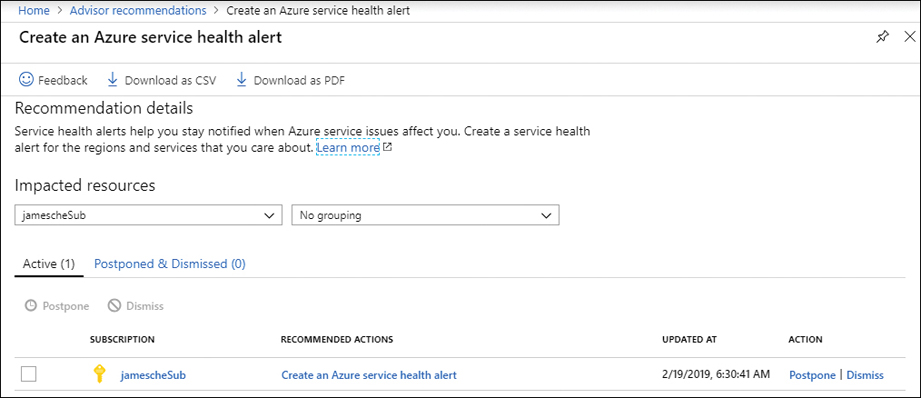
FIGURE 3-85 Acting on a recommendation
If you have a large number of recommendations, or if you’re not the right person to take action on the recommendations, you can download Azure Advisor recommendations as either a comma-separated values file or a PDF. Click Download As CSV or Download As PDF, as shown previously in Figure 3-83. You can also download a file with specific recommendations by clicking the appropriate download button while reviewing details, as shown in both Figure 3-84 and Figure 3-85.
Azure Monitor
Azure Monitor aggregates metrics for Azure services and exposes them in a single interface. You can also create alerts that will notify you or someone else when there are concerns you might want to address.
To access Azure Monitor, click Monitor in the Azure portal to display the Azure Monitor blade, as shown in Figure 3-86. Azure Monitor is customizable, so you can see exactly what interests you the most. For that reason, it doesn’t show any metrics until you configure them. To view metrics, click Metrics and then select a scope.
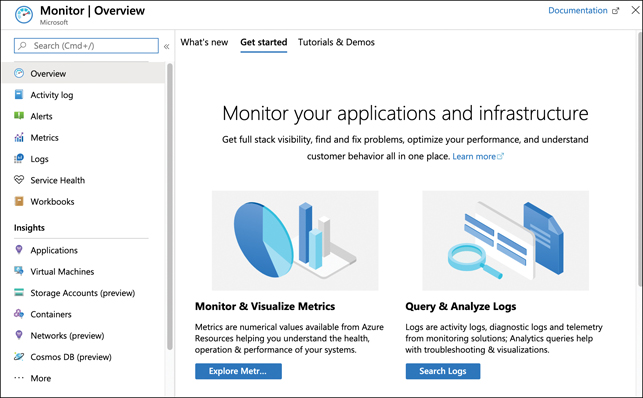
FIGURE 3-86 Azure Monitor
In Figure 3-87, a VM in the AZ900 resource group has been selected for monitoring.

FIGURE 3-87 Selecting a resource to monitor
Once you select a resource, you are presented with a list of metrics related to that resource. Metrics for VMs are shown in Figure 3-88.
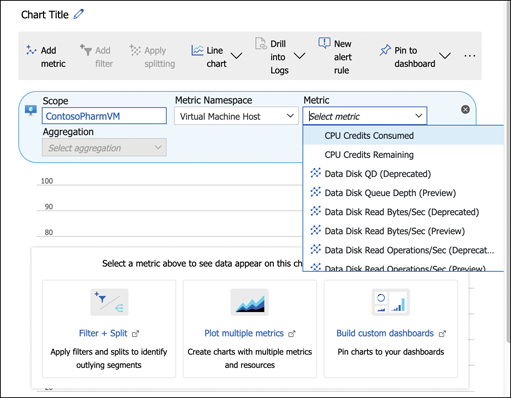
FIGURE 3-88 Metrics for VMs
When you select a metric, the chart updates to show a graph of that metric. You can add additional metrics to your chart by clicking Add Metric, as shown in Figure 3-89.
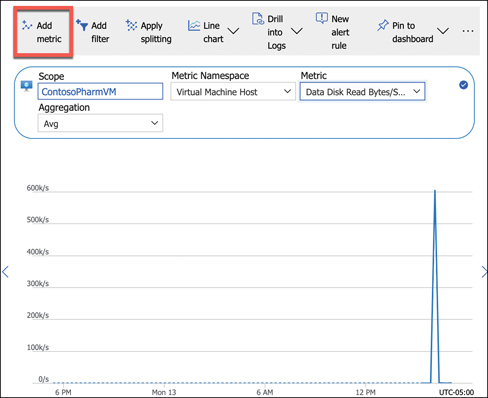
FIGURE 3-89 Monitoring VM disk usage
When adding multiple metrics, you’ll want to include only those metrics that share a common unit of measurement. For example, if you were to add a CPU metric to the chart shown in Figure 3-89, it wouldn’t make a lot of sense because Percentage CPU is measured as a percentage and disk units are measured in bytes.
In Figure 3-90, we’ve added Disk Write Bytes to the chart. Azure Monitor color codes each metric automatically to distinguish between them. We’ve also selected Area Chart as the type of chart to more clearly see the patterns.
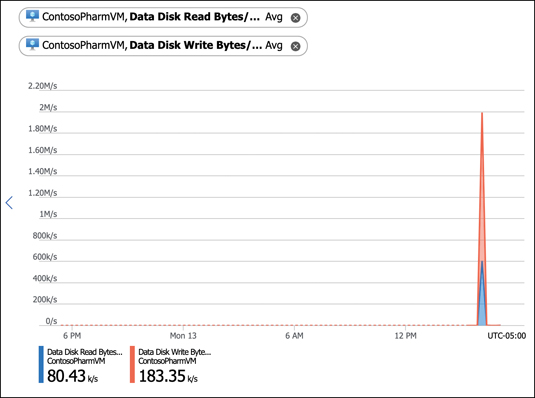
FIGURE 3-90 Chart showing disk usage
By default, charts are shown for the past 24-hour period, and the real-time value is shown at the right edge of the chart. However, you can customize the timeframe that is shown by clicking the timeframe and adjusting it as you like, as shown in Figure 3-91.
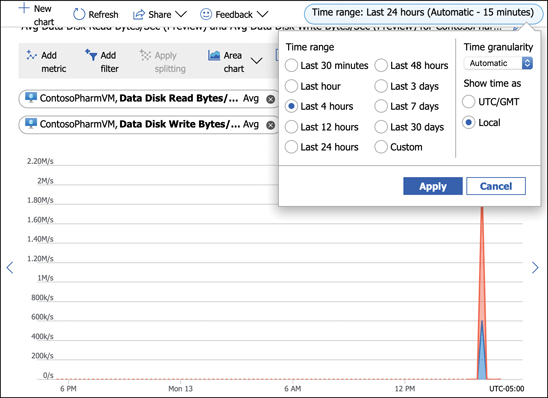
FIGURE 3-91 Changing the chart timeframe
Once you have a chart that you find useful, you can pin that chart to the portal dashboard by clicking Pin To Dashboard. As shown in Figure 3-92, you can choose Pin To Current Dashboard, or you can pin it to a specific dashboard by choosing Select Another Dashboard to create a monitoring dashboard in the portal customized for a specific use.
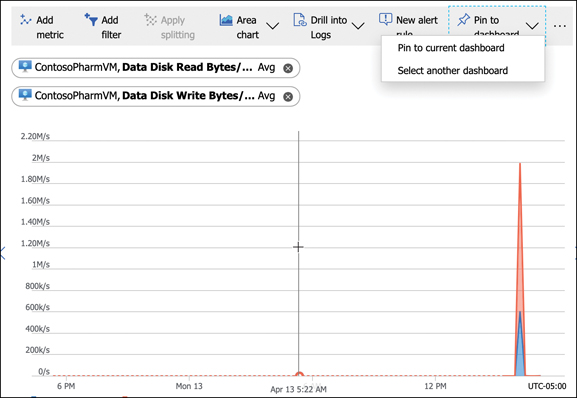
FIGURE 3-92 Pinning a chart
Azure Monitor Alerts can notify you or others with email or SMS text message, run a Logic App flow, call a Function App, make a request to a webhook, and more, when a certain condition is met. Alerts are based on rules that you define, and when a rule’s condition is met, an alert performs the action you specify.
You can create an alert rule that is automatically configured for the metrics you’ve selected in your chart by clicking New Alert Rule at the top of your chart. You can also start from scratch by clicking Alerts in the menu for Azure Monitor, as shown in Figure 3-93, and then clicking New Alert Rule.
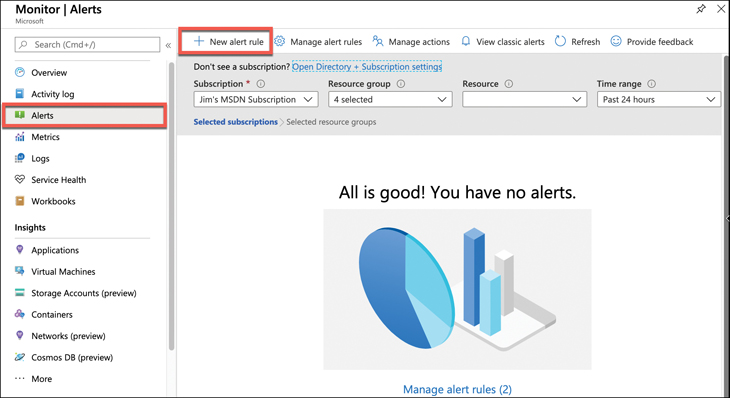
FIGURE 3-93 Creating an alert rule
To start your rule, click Select and select the resource for which you want to configure an alert. In Figure 3-94, a VM is selected for a new alert rule.

FIGURE 3-94 Selecting a resource for an alert
Next, you’ll need to specify the condition for your alert. Click Add Condition, and then select the signal you want to monitor for your alert. In Figure 3-95, an alert has been configured based on the Percentage CPU signal of the VM.
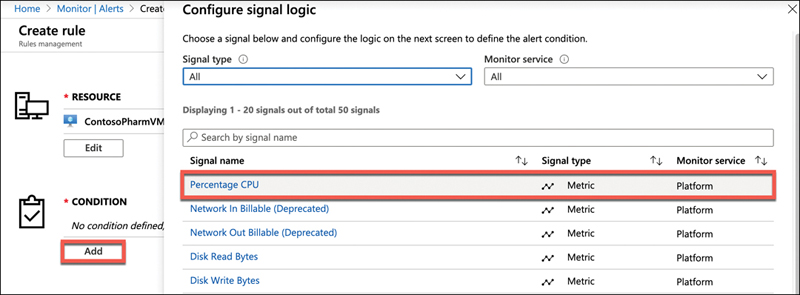
FIGURE 3-95 Configuring a condition
Once you select a signal, the logic for the signal is configured. As shown in Figure 3-96, Monitor displays an interactive graph of the signal you’ve chosen, which helps you get a feel for how your resource has been performing historically. By default, this shows the last six hours, although you can adjust the chart period. You can specify an operator, aggregation type, and threshold, or click Done to create the logic for the alert.
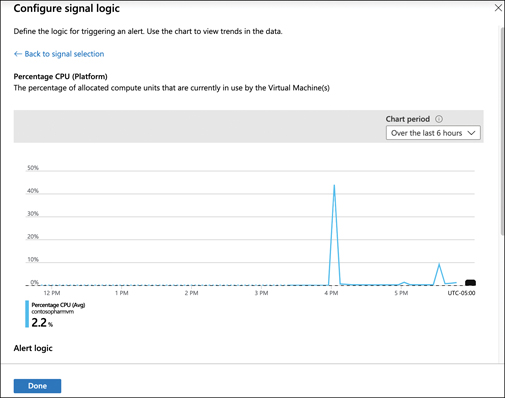
FIGURE 3-96 Alert rule logic
When an alert is triggered, it performs an action that you specify using an action group. An action group contains a list of actions to take when an alert is triggered. To create a new action group, click Create, as shown in Figure 3-97.
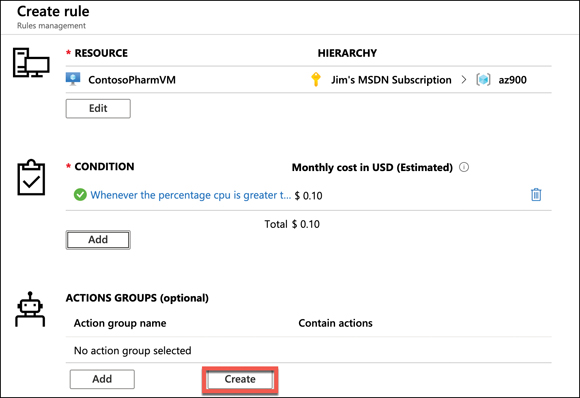
FIGURE 3-97 Creating an action group
In Figure 3-98, we are creating an action to notify the IT director. In this case, the action will send a text message to the IT director, and it will also send a push notification using the Azure mobile app.
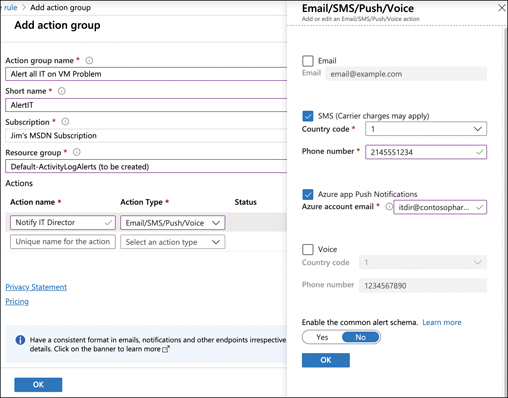
FIGURE 3-98 Creating an action
Action groups are designed to contain several actions that are executed by an alert being triggered. To add a new action, click Manage Actions (shown previously in Figure 3-93) and then select your action group. In Figure 3-99, we’ve added an additional action to the action group. This action calls a Function App that runs some code to reboot the VM.
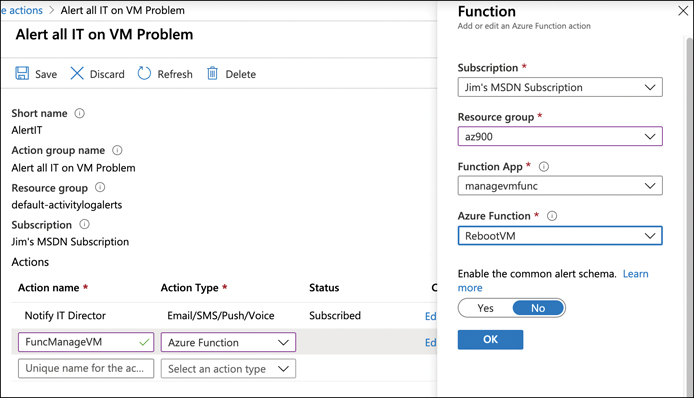
FIGURE 3-99 Adding another action
Azure Service Health
Microsoft operates an Azure Status web page where you can view the current status of Azure services in all regions where Azure operates. While it is a helpful view of overall Azure health, the enormous scope of the web page doesn’t make it the most effective way to get an overview of the health of your specific services. Azure Service Health can provide you with a view specific to your resources.
To access Service Health, click All Services > All > Service Health, as shown in Figure 3-100.
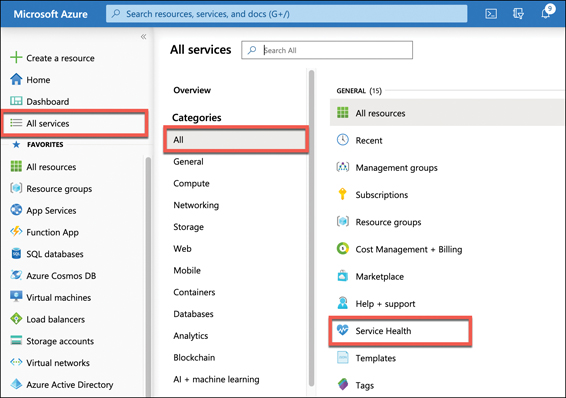
FIGURE 3-100 Azure Service Health
Figure 3-101 shows the Service Health blade showing the health and status of the resources. The map shown has three green dots representing the health of the three Azure regions where resources are deployed. This map is specific, and by clicking the pin icon, you can have a quick reference of Azure health for just the regions where you have resources.
You can also view any upcoming planned maintenance that might affect you by clicking Planned Maintenance in the menu on the left. By clicking Health Advisories, you can see health information that might be related to your own configuration and not a problem somewhere in Azure.
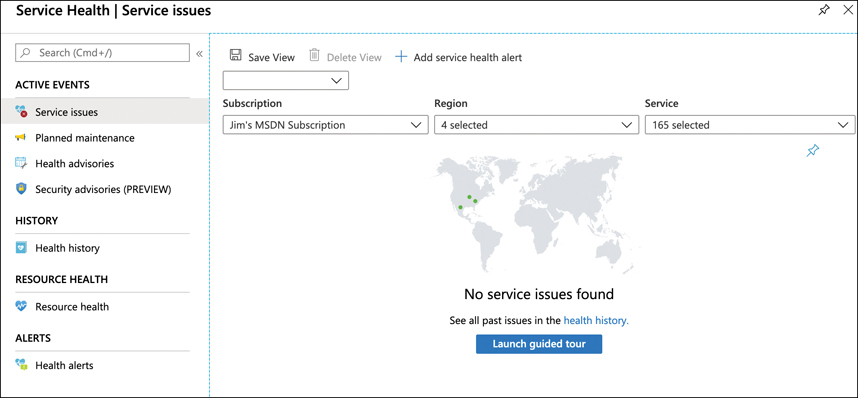
FIGURE 3-101 Service issues in Service Health
When a service issue is affecting you, you’ll see details on the issue, as shown in Figure 3-102. In addition to full details on the incident, you also see a link that refers to details on the incident. You can also download a PDF that contains an official Microsoft notice of the incident.
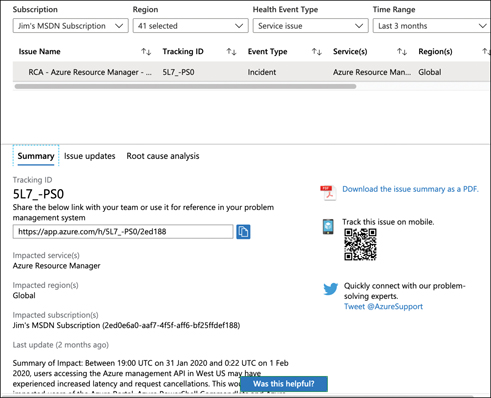
FIGURE 3-102 Azure Service Health incident
Both Azure Monitor and Azure Service Health are critical to the overall view of your Azure resources. Azure Monitor is geared toward monitoring the cost and performance of your resources and alerting you and others when conditions warrant. Azure Service Health, on the other hand, is the single-point-of-truth for information on the health of Azure itself and how Azure incidents are affecting your resources. The combination of these two services provides you with all the tools you need to keep up with your Azure resources and how well they’re performing.
Thought Experiment
You’ve learned about quite a lot in this chapter, so let’s apply some of that knowledge in a thought experiment. Answers to this thought experiment can be found in the section that follows.
ContosoPharm is interested in modernizing their systems, and they’ve turned to you for advice. They want to monitor the environmental conditions in their storage areas, so they’ve installed some Internet-enabled thermostats. One of their requirements is to be able to alert maintenance staff if there’s a defined variance in temperature and humidity. The IT department also wants a way to efficiently upgrade the firmware on these thermostats if necessary, and because there are hundreds of devices, they are concerned about allocating expensive engineer resources to do that work, but they also want to ensure that all thermostats are updated, even when Internet access is temporarily unavailable. Recommend a good solution that fills these needs.
One additional ask they have related to these devices is related to keeping them secure. The IT director is concerned with connecting these systems to the Internet because of the risk that a hacker might be able to gain control of climate-control systems. Make a recommendation for them that can help with securing these devices.
ContosoPharm is also interested in taking advantage of machine learning to make their research more efficient. They’ve got a large amount of data already in Data Lake Storage, and they need an efficient way to analyze that data and build some machine learning models. They have huge amounts of data, so they need a solution that is scalable and able to handle millions of rows of data. If you can also provide a solution for them to bring some unstructured data into the equation, that would be a bonus. During your preliminary discussions with them about this, they mentioned that their data scientists are interested in taking advantage of their knowledge of Jupyter Notebooks. Make a recommendation for the best way they can do this in Azure.
While ContosoPharm has some skilled data scientists and developers who plan on using R to build some machine learning models, they also want to allow a few other folks who don’t know R or Python to develop some models. If there’s a suggestion you can make to enable those people, that would be a great selling point.
The IT director realizes that all these tasks are going to strain IT resources, and he’s worried about the fact that sales managers in the field can keep IT people tied up providing basic computer support. The problems they encounter aren’t complicated, but they do require a lot of time from IT personnel. He’s asked that you recommend a way that they can provide some basic support to the field without having to use precious IT resources.
One thing that causes some support issues is related to an Azure VM that is running a custom application ContosoPharm developed a long time ago. This app leaks memory, and that eventually causes the app to slow to the point where it triggers support calls. They don’t have the resources available right now to troubleshoot and fix the problem, so when they get calls on it, they reboot the VM to temporarily resolve the issue. If you can recommend some way for them to monitor the memory that’s being used and reboot the VM automatically without user interaction, that would help a lot to reduce the number of support calls.
The VM that hosts the app does have to be resized occasionally because of an increase in usage. When that VM gets scaled to a larger size, it means greater expense for ContosoPharm. The CIO is willing to accept this increase in cost, but she wants to be notified via a text message when it happens so she is aware of the change. She suggested that to the IT director, but he’s not able to offer a solution due to a limitation in the number of developers who would be able to build such a solution. If you can unblock them on this in a way that doesn’t require someone who can write code, that would be a tremendous benefit.
Along with the recommendation to build a solution for the CIO, ContosoPharm would like a good way to track that work as it’s being done. They’re concerned that they might not be able to adhere to schedules since the people working on the project likely have a lot of other duties. Provide a recommendation on a way for them to track this work and ensure it gets done.
One of ContosoPharm’s developers believes he might be able to do some work on the app that is leaking memory, but he can’t allocate much time to it. One of the problems in working on that app is that he needs a couple of other VMs with some specific tools installed on them, and he needs debugging symbols installed on them as well. Getting the symbols installed can take a couple of hours after he spins up a new VM. If you can recommend a way that he can save some time on this, it might enable ContosoPharm to get some work done to fix the app and solve that problem long-term.
Another major problem in fixing the problem app is that it relies on three different web apps running in Azure App Service. The developer doesn’t want to troubleshoot the app using the live web apps, so he needs to be able to create new apps for testing easily. Because these web apps are billed to ContosoPharm whether they’re running or not, they’ll have to delete the apps when the developer isn’t actively working on the issue. That means the developer has to take the time to recreate the web apps all over again when he returns to work on the problem app. Recommend a solution for ContosoPharm to easily create these web apps when they’re needed and then delete them when they’re not needed anymore.
The developer who’ll be working on the app has informed you that the app relies on a large collection of Bash scripts that are installed on the VM. These scripts interact with Azure resources, so they have to run within the Azure environment. His feeling is that these scripts might be part of the issue with the app, so he’d like a way to easily edit these scripts in an Azure environment. The problem is that he might not always be at the office where his computer is available. In fact, the developer told you that a lot of the work he does on scripting is done while he’s commuting around town on the train, and the only device he has with him is an iPad. If you can help make the developer productive while he’s on the train, that would be a huge plus for ContosoPharm.
The IT director has been reading up on the cloud, and he’s concerned that part of ContosoPharm’s problems is that they aren’t following Azure best practices. He’s asked you to discuss best practices with them so they can be better prepared to avoid problems. You feel that this might not be the best use of your time, and you’re concerned that best practices might evolve over time. Provide a better recommendation for ensuring that ContosoPharm complies with best practices in Azure. As ContosoPharm makes any changes, they’d also like to know if there’s any way for them to carefully monitor the performance of their VMs and other resources. In order to save wasted time, they also want to ensure that they’re aware of any incidents in Azure that are impacting their resources.
Thought experiment answers
In this section, we’ll go over the answers to the thought experiment.
The best option for managing ContosoPharm’s thermostat devices is to use IoT Hub. They could use IoT Central to do much of what they want to do, but one of their requirements is being able to update firmware for the devices even if the Internet isn’t available temporarily. The device twin feature of IoT Hub is specifically designed for situations like that, so IoT Hub is a better option.
To keep the thermostats secure, you can recommend Azure Sphere. However, they will need to use devices that incorporate MCUs that are designed for Azure Sphere, and if those devices aren’t yet available, it might be something that they can’t implement right away. Even so, Azure Sphere is the best solution for keeping IoT devices secure, and ContosoPharm would be appreciative of knowing about it.
The best way for ContosoPharm to analyze their big data and build models is to use Azure Synapse analytics. This is an end-to-end solution that works well with Data Lake Storage. Since they need a scalable solution that can also handle millions of rows of data, HDInsight is also a good recommendation for them. They also mentioned they want to work with some unstructured data. Azure Databricks is an ideal solution for using unstructured data, and its support of notebooks fits in well with the desire to use knowledge of Jupyter Notebooks.
To enable users who don’t know how to program to build ML models, you can recommend Azure Machine Learning to ContosoPharm. They’ll need to use the Enterprise edition so they have access to visual designers, but this will allow them to build ML models in a drag-and-drop interface.
To relieve the IT support strain on the IT department, you can recommend Azure Cognitive Services and Azure Bot Service in order to build an AI support agent. Using this method, they can easily understand natural language and offer suggestions using a chat bot.
In order to monitor the memory usage of the VM and reboot it when necessary, ContosoPharm can use Azure Monitor and configure alerts to call a Function App to run some code to reboot the VM. Since the CIO wants to be informed when the VM is resized to account for memory pressure, you could also suggest that they use Logic Apps to create a workflow. You can use Event Grid to listen for an event when the VM resizes, and Logic Apps can then run a flow that sends a text message to the CIO.
To track the work that’s being done on their leaking app, you can recommend Azure DevOps and Azure Boards. This would make it easy to track different tasks and their current status.
The developer who needs access to VMs with specific tools installed can use Azure DevTest Labs. By creating a custom image that includes all the tools and debug symbols he needs, he can always access a VM with what he needs very quickly.
To create and delete web apps quickly and easily, you can recommend that the developer use the Az module in PowerShell or the Azure CLI. Using these, the developer can script these operations so he can easily create web apps and configure them the way he needs them and then easily delete them all.
For working on his Bash scripts, the developer should use Azure Cloud Shell. Because Cloud Shell uses a mounted file system, any files he uses will be available in any Cloud Shell session, and the built-in Monaco editor makes it easy to edit and develop his scripts. Cloud Shell also solves the problem of making the developer productive while he’s on the train. By installing the Azure mobile app on his iPad, he can access a Cloud Shell session on that device and get his work done.
To ensure they are keeping up with best practices, ContosoPharm can use Azure Advisor. Advisor will show them where they aren’t following best practices, along with remediation steps to follow. They can keep track of any possible service incidents in Azure using Azure Service Health in the Azure portal.
Chapter summary
We covered a lot of ground in this chapter. You learned about some of the latest technologies in cloud computing, and you learned how you can interact and manage Azure resources in multiple ways.
Here’s a summary of what this chapter covered.
The Internet of Things (IoT) refers to devices with sensors that communicate with each other and with the Internet.
Azure IoT Hub allows you to manage IoT devices and route messages to and from those devices.
Azure IoT Hub Provisioning Service makes it easy to provision a large number of devices into IoT Hub.
Azure IoT Central is a SaaS offering for monitoring IoT devices.
Azure Sphere is a service for securing IoT devices.
Azure Sphere is composed of the Azure Sphere MCU, the Azure Sphere OS, and the Azure Sphere Security Service.
Big data refers to more data that you can analyze through conventional means within a desired timeframe.
Azure Synapse is the replacement for SQL Data Warehouse.
Azure Synapse stores big data and also provides for data analysis in a cluster.
An Azure Synapse cluster consists of Synapse SQL, Apache Spark integration, data integration of Apache Spark and Azure Data Lake Storage, and a web-based user interface called Azure Synapse Studio.
Data Lake Storage is good for any type of data because it stores unstructured data.
HDInsight is Microsoft’s solution for clustered Hadoop processing of big data.
Azure Databricks is a good solution for modeling data from a data warehouse so that it can be effectively used in ML modeling.
Databricks clusters are made up of notebooks that can store all types of information.
The process of AI decision-making at several points along the neural network is referred to as the ML pipeline.
Azure Machine Learning uses cloud-based resources to train ML models much faster.
The Enterprise edition of Azure Machine Learning offers designers that allow you to build, train, and score ML models in a drag-and-drop interface.
Cognitive Services provide numerous APIs that allow you to quickly develop machine learning solutions.
Azure Bot Service runs on Azure App Service and makes it easy to build powerful AI-driven interaction.
Serverless computing refers to using surplus VMs in Azure to run your code on demand. You pay only for when your code runs.
Azure Functions is the compute component of serverless in Azure.
Azure Logic Apps is a workflow serverless solution that uses connectors, triggers, and actions.
Azure Event Grid makes it possible to raise and handle events as you interact with your Azure resources.
Azure DevOps is an easy way to plan, track, and manage projects and work with teams.
Azure DevTest Labs makes it easy to access ready-made VMs that are configured exactly the way you need them to be.
The Azure portal is a web-based interface for interacting with your Azure services. It uses ARM API calls under the hood to talk to Azure Resource Manager.
Azure PowerShell Az is a cross-platform PowerShell module that makes it easy to manage Azure resources in PowerShell.
The Azure CLI is a command line tool that is cross-platform and can be scripted in multiple languages.
Azure Cloud Shell provides command line access to Azure from just about any device.
Cloud Shell persists any files copied to it by using an Azure storage account.
The Azure Mobile app allows you to manage your Azure resources from your iOS or Android device.
Azure Advisor provides best practice recommendations in the area of high availability, security, performance, and cost.
Azure Monitor aggregates metrics for Azure resources. You can create alerts based on those metrics.
Azure Service Health provides information related to incidents in Azure that impact your resources.