
Chapter 8
Debugging and Testing
WHAT'S IN THIS CHAPTER?
- Debugging Android code
- Android Monitor
- Android Device Monitor
- Android Virtual Device extended controls
- Android Lint
- Testing Android code and UI
WROX.COM CODE DOWNLOADS FOR THIS CHAPTER
The wrox.com code download for this chapter is found at www.wrox.com/go/expertandroid on the Download Code tab. The code for this chapter is in the Chapter8.zip file.
This chapter covers debugging and testing Android projects using Android Studio and SDK tools. You will use applications from Google's Android samples because those provide excellent use cases for debugging and testing.
Debugging helps to detect flaws and solve possible problems with your software and design. One tricky part of debugging Android applications is that you need to remotely debug a running virtual machine or Android device, which requires a connection to send and receive data from the remote device to your development device. That connection is handled with Android SDK tools.
Android Studio provides a good visual debug console and tools to monitor running applications on the device. Android Studio tools are not yet robust enough for detailed debugging and testing, so this chapter also investigates some of the core tools of Android SDK so that readers can better understand the available debugging options.
In addition to debugging, you need to ensure the application is solid, doesn't crash, and does all required tasks without any problems, so defining all the possible actions as test packages for code and the user interface is a good practice to make a great application.
DEBUGGING ANDROID CODE
For this section, import the Universal Music Player sample application. We'll use that to look at debugging Android code with Android Studio. When you have loaded the project into Android Studio, you are ready to debug the application both on hardware and on a virtual device.
As mentioned in this chapter's introduction, remote connections to Android devices are needed to debug applications remotely. To communicate with a remote Android device, the Android adb (Android Debug Bridge) tool is used. It is delivered with Android SDK and is integrated with Android Studio.
Before proceeding, let's take a look at the details of adb to understand the underlying technology for remote debugging.
Android Debug Bridge
adb (Android Debug Bridge) is a command-line tool that provides communication between a development machine and an Android device. It is delivered with Android SDK and is installed when you install the Android platform-tools package from Android SDK Manager. The Android platform-tools and executable can be found by following the <sdk-path>/platform-tools/ Android SDK installation path.
There are long-running adb services on both the development host and target Android devices to establish communication.
- adb-server—adb-server runs on your development machine. It provides the communication between adb and adb-daemon running on the target device.
- adb-daemon—adb-daemon runs on target Android devices to respond to incoming debug connections from remote host machines.
adb communications happen through TCP ports. When an adb client starts, it should connect with adb-server. If adb-server is not running, the client initiates adb-server to enable connections with the remote device.
adb is at the heart of Android application development. When you run an application, it is installed using adb. If you want to install an Android APK manually, you can run the following command from the terminal if at least one device is already connected to adb-server.
adb install <path_to_project>/app/build/outputs/apk/app.apkIf more than one device is connected to adb-server, you should modify the command to select a device. The following command lists the connected devices with their unique serial number.
adb devices
List of devices attached
emulator-5554     device
f2f6c6c5     device
The output shows connected devices so now you can select an emulator to install your apk with the following command. -s instructs adb to select the specified device.
adb –s emulator-5554 install <path_to_project>/app/build/outputs/apk/app.apkThere are many other commands and options with adb for connecting to Android devices’ shells, listing files, transferring files between host and target devices, and so on. Basically, adb works with all IDEs to connect with remote Android devices.
The next section discusses how to use adb to wirelessly debug devices.
Wireless Debugging
The preceding section discussed adb and debugging Android code on remote devices, which can be either an Android emulator or a USB-connected Android device. Wireless debugging can be performed if both devices are in the same local network and can directly connect from a TCP/IP port. However, the devices need to be set up to enable wireless debugging. Therefore, before unplugging your device, run the following adb command after you navigate to the <sdk-path>/platform-tools folder.
$ adb tcpip 5555If your emulator is also running, get the device's unique ID from the output of the following command, and enter it in the command on the last line.
$ adb devices -l
List of devices attached
f2f6c6c5               device usb:336592896X product:gm4g
model:General_Mobile_4G_Dual device:gm4g_sprout
emulator-5554          device product:sdk_google_phone_x86
model:Android_SDK_built_for_x86 device:generic_x86
$ ./adb –s <device-id> tcpip 5555
The device will reconnect with the configured port, which is enabled to allow a wireless debug connection.
Now, let's detach the USB cord from the host machine and find your device's IP address from Settings ⇨ About Phone (or About Tablet, TV) Status. In this example it is 192.168.1.37.
Next, connect adb to our phone wirelessly with following adb command.
$ ./adb connect 192.168.1.37
connected to 192.168.1.37:5555
$ ./adb devices –l
List of devices attached
192.168.1.37:5555      device product:gm4g model:General_Mobile_4G_Dual
device:gm4g_sprout
emulator-5554          device product:sdk_google_phone_x86
model:Android_SDK_built_for_x86 device:generic_x86
You made it. The wireless connection is successful and you can see your phone on the list of devices. Now, you are ready to run and debug applications using a WiFi connection. When you select Run or Debug from Android Studio, your device will be listed again.
Start Debugging
Now that you understand how the underlying Android debugging mechanism works, you can start debugging with Android Studio using the Universal Music Player sample application.

Figure 8.1 Android Studio adb integration
Let's insert some break points, starting with the application's entry point, the onCreate function. This will make it easier to explain the steps needed for debugging.
The UniversalMusicPlayer's launcher activity is in the file under the MusicPlayerActivity.javajava/com.example.android.uamp/ui folder (you can locate the activity declaration in the Android Manifest file). We inserted a break point in the onCreate function by double-clicking on the left pane just next to code text as shown in Figure 8.2, but you can simply press Command+F8 on Mac or Ctrl+F8 on Windows.

Figure 8.2 Break point in Android Studio
At this point, connect your device to a development machine. To quickly start debugging, press Control+d on Mac or Shift+F9 on Windows, or select Debug from the Run menu. Then select the device you will use to debug the application from the Select Deployment window that opens.
When debugging starts successfully, the Debug window is enabled and it displays the progress of the apk installation on the device, as shown in Figure 8.3.

Figure 8.3 Debug window console
Let's dig a little more into the available buttons in the Debug window. First, let's investigate the buttons on the left pane of the Debug window, shown in Figure 8.4.

Figure 8.4 Debug window left pane actions
The first three buttons are used, respectively, to Resume, Pause, and Stop actions for the currently running application.
- Resume—This button runs the paused application until it reaches a breakpoint or the Pause button is clicked.
- Pause—This button pauses the running application. The cursor goes to the paused line of the code.
- Stop—This button stops the debugging process and kills the running application process.
The next two buttons are used for breakpoint operations.
-
View Breakpoints—This button shows the list of breakpoints, as shown in Figure 8.5.
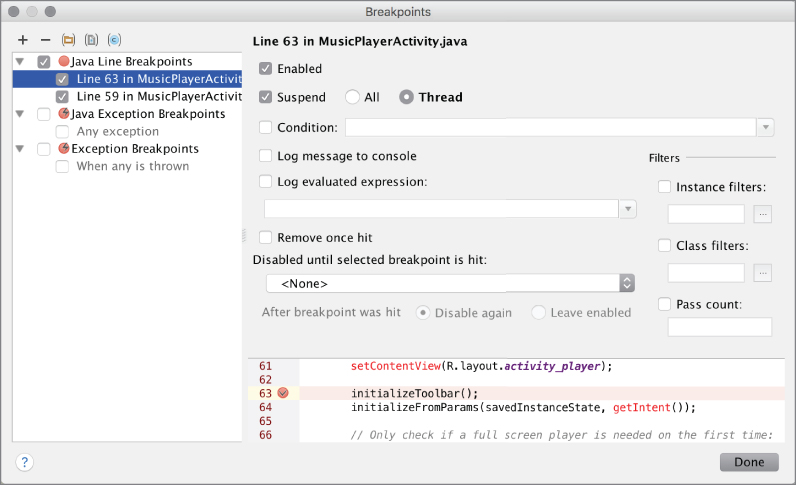
Figure 8.5 Breakpoints window
The Breakpoints window enables you to view and configure the breakpoints for detailed use during the debug.
-
Mute Breakpoints—Click this button to disable (but not remove) all active breakpoints.
The sixth button dumps the threads’ data, as shown in Figure 8.6.

Figure 8.6 Thread dump data
- Get thread dump—A thread dump shows the running threads and stack trace to show the callbacks and current state of the threads for the running application. This view enables you to optimize threads and investigate details of the threads used in your application.
The next two buttons are used to restore the user interface layout to its original state if you have changed some values during debugging.
- Restore Layout—Restores changes back to original state if you have made any changes to layout during debugging.
- Settings—Shows options to show values of variables on code text file, method return values, sort variables in the Frames section alphabetically.
The last three buttons are for settings and window actions to pin, close, and open the help window.
- Pin Tab—Pins debug tool window tab on Android Studio.
- Close—Closes debug window.
- Help—Opens help window.
The action buttons on the top of the debug window (see Figure 8.7) give us the power for step-by-step debugging. For efficiency it is a good idea to make shortcuts of these actions; otherwise, it can be painful to debug applications.

Figure 8.7 Debug window actions toolbar
- Show Execution Point—The first button from the left takes you to the current execution point. The shortcut for this action is Option+F10 on Mac and Alt+F10 on Windows.
-
Step Over—The second button from the left debugs the application step by step starting from the current position of the cursor in the code. The shortcut is F8 on Mac and Windows. Because Step Over is used repetitively, using your keyboard helps to quickly debug the application and skip lines.
In this section, we started to debug with the
onCreatemethod's first line. To continue debugging, click the Step Over button to step one line. Notice that the cursor advances one line and the action on the line is completed. -
Step Into—Use the third button from the left to step into a method while debugging the application. The shortcut for the Step Into action is F7 on Mac and Windows.
Step Into allows you to get into the method on the current line of the Java code. For example, when the cursor is on the line
LogHelper.d(TAG, "Activity onCreate");, pressing the Step Over button completes the action and continues to the next line. But if you click the Step Into button, you call theLogHelper.dfunction and continue debugging in that function. - Force Step Into—The next button disables any stepping filters and puts you in the function you want to get in. The key combination for this action is Option+Shift+F7 on Mac and Shift+Alt+F7 on Windows.
-
Step Out—The Step Out button takes you out of the method you are currently in during the debugging.
To run the Step Out action, you can press Shift+F8 on Mac and Windows.
-
Run to Cursor—This button makes the debugger work from its current execution point to the current location of the cursor. This is useful if you have skipped through a section of code but decide to go back and debug that section. Click on the line you want to go to and press the Run to Cursor button to debug the code from that line through to the current location of the cursor.
You can perform this action using Option+F9 on Mac or Alt+F9 on Windows.
- Drop Frame—This takes you back to the method that made the call for the current method. When this button is used, it drops loaded method frames from the stack.
-
Evaluate Expression—The Evaluate Expression action allows you to immediately perform actions or expressions written in the Java code to evaluate them according to the current context. For example, you can evaluate math expression values used for the user interface, which you may not be able to test during development.
It is also possible to test a code fragment because most objects’ values would be defined in the debug context so you would get a result for the object (see Figure 8.8). In Figure 8.8, a Boolean expression has been evaluated and the result has been inspected.

Figure 8.8 Evaluate Expression window
You can also open the Evaluate Expression window with Option+F8 on Mac or Alt+F8 on Windows.
Expression evaluation is a powerful tool to quickly test a piece of running code to see whether the output returns the expected result. If it is not returning the assumed value, this helps you determine the problem with variables and understand what you need to work on. This is useful for analyzing sensor values or data read from a server and so on.
To see a result after expression evaluation, make sure you are running an expression that has a return value. If you run a void function, you will see an undefined result, as shown in Figure 8.9. However, because a Boolean expression is used, the result is true.

Figure 8.9 Undefined result in the Evaluate Expression window
Using the actions available on the Actions toolbar described previously, you can debug your application by running it step by step to investigate what happens at each step. It is also possible to access some of the actions by right-clicking inside the Java class during debugging.
As shown in Figure 8.10, Evaluate Expression, Run to Cursor, and Force Run to Cursor are enabled during debugging. Because these actions are associated with the line of the code and the written expression in the code, only these items can be accessed by right-clicking in the code.

Figure 8.10 Actions accessible inside Java code
However, if you don't see the details of the threads, navigate to the Debugger tab in the Debug window, as shown in Figure 8.11.

Figure 8.11 Debugger tab in the Debug window
You can see three panes in this window: Frames, Variables, and Watches.
-
Frames—This pane lists the threads of the Android application. It shows the thread's call stack, and if you click the stack element, you see the thread's variables listed in the Variables pane. Seeing a thread's call stack helps you understand the steps, and you can look over the variables and objects in the threads for a better understanding of how the application runs.
You can switch between threads by clicking on the drop-down box on top of the pane.
- Variables—This pane shows the list of variables and their values at the current state of the selected stack element from the Frames pane. In this pane, you can manipulate the variables. You can see a list of the actions that you can perform by right-clicking a variable, as shown in Figure 8.12.

Figure 8.12 Variable actions
- Watches—This pane lists the variables you've manually selected to watch over the debugging process.
Figure 8.13 shows that in the current state, just at the beginning of the onCreate function, only the TAG variable is defined; the rest are null. null is a constant and static variable, so its value is assigned already. For this example, some of the variables defined in the MusicPlayerActivity.java class have been randomly inserted.

Figure 8.13 Watches pane
The Watches property enables you to group a number of variables during debugging to see their values change during execution. That way, there's no need to search through the files to try to catch their values each time. When there has been a change to the variable, you can see it in the Watches window.
You can add variables to watch by right-clicking and selecting Add to Watches or you can select the variable and drag it to the window. Another way is to use the + button on the pane, shown at the bottom of Figure 8.13.
Finally, we should mention that Android Studio tries to help as much as it can to provide all the information about variables and values during debugging. When you step over any line, it highlights the variable and object values instantly, as shown in Figure 8.14.

Figure 8.14 Highlighted variables and values in code
It is helpful to see light green highlights on the debug line instead of needing to hover over the variable, as shown in Figure 8.15. The highlighting saves significant time and practically debugs the application for you.

Figure 8.15 Hovering over a variable to reveal its value
This section covered most of the tools and shortcuts required to efficiently debug an Android application. During the debugging, you always need to watch the stack and threads to see what is changing and whether you're getting the expected behavior or value of the objects. In the next section, you learn to use Android Monitor to trace memory, CPU, and GPU usage, as well as network activity.
ANDROID MONITOR
Android Monitor should be one of your best friends while developing your application in Android Studio because it includes the useful debugging monitoring tools logcat, Memory, CPU, GPU, and Network. The tabs for these monitors are available in the Android Monitor window (see Figure 8.16).
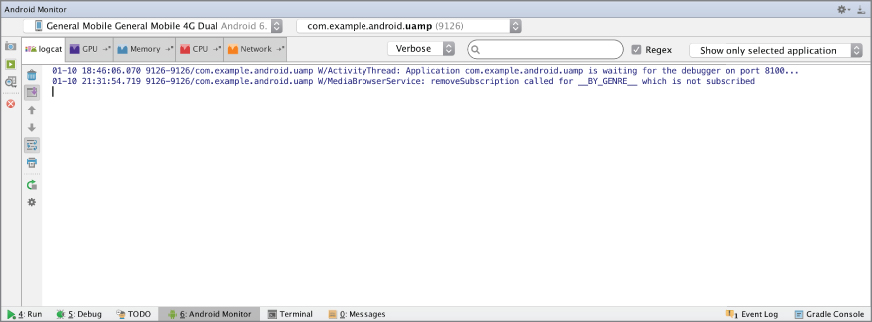
Figure 8.16 Android Monitor tabs
Before we cover the detailed use of these monitoring tools, let's look at the common actions you can perform in Android Monitor.
Figure 8.17 shows the three buttons available near the top left of the Android Monitor window. These are used to capture and dump data from an Android device. You can take screenshots with the first button and record screen activity with the second. With the last button, you can capture to a .txt file the system information listed in Figure 8.17 .

Figure 8.17 List of system information available with Android Monitor
In addition to these information-capturing buttons, there's a red button that is used to terminate selected processes. The following list describes in detail how to use those actions:
- Screenshot—This button is used to capture the current screen from the connected device during debugging. Right after you click the Screenshot button, a dialog box appears that shows the progress of capturing and transferring the image to the host machine. Then the window shown in Figure 8.18 displays a preview of the screenshot. Here you can perform minor editing with the tools provided at the top of the window.
- You can save screenshots to your development machine with the Save button. To recapture a screenshot, click the Recapture button. If you want to view the screenshot as it would appear on a phone, check the Frame Screenshot option before saving.
-
Screen Recording—This button records a video of the attached Android device's screen to your host machine. When you first click the button, a dialog box appears in which you configure the bitrate and resolution (height and width of video) options, as shown in Figure 8.19.
You can share a screen recording with your team, which is useful when you want to investigate and discuss the behavior of the user interface.
- Capture System Information—Click this button to get the system information shown in Figure 8.17. When you click any item from the list, the command is sent to adb and you get the corresponding data as text. After the data is received, it will be opened and saved in the
CapturesSystem Informationfolder under the module's path. The result is that you can see all the captured system information in the Captures window, as shown in Figure 8.20.

Figure 8.18 Screenshot preview window

Figure 8.19 Screen Recorder Options dialog box

Figure 8.20 System information Captures window
All the capturing tools are important if you want to share your application's data with your teams and peers to help them understand any problems there might be. You can also use this information to compare different devices’ system information so that you can understand what can be improved.
For example, the dump (system information after the capture action) shown in Figure 8.20 is a device's memory usage information provided in a text file. With this information, you can investigate memory usage by system processes.
You are also able to select the connected devices and available processes from lists above the Android Monitor window, as shown in Figure 8.21. You can see the two connected devices: a smartphone and a running emulator. Capture outputs will give the selected device's information or screenshot.

Figure 8.21 Device and process selection
The following sections investigate the other tools in Android Monitor.
Using logcat
Logcat is one of the most useful tools for Android application development because Android applications do not run on a shell with stdin/stderr. It is possible to print output to text files during debugging or running but it is expensive to implement. A better solution is the Android Log class and logcat functionality for all applications.
There is an absolute need to follow up with the running code for tracing and getting logs to analyze code and get exception messages and other warnings, errors, and information.
If you select No Filter instead of Show only selected applications from the list at the top right of the logcat window, you will see all the log messages from the system and other running applications and services, as shown in Figure 8.22.

Figure 8.22 No Filters output in logcat
Log messages are classified as Verbose, Debug, Info, Warn, and Error. The Log class allows you to write messages according to these levels using v, d, i, w, and e functions respectively. Those functions take two parameters. The first parameter is used to define a tag and the second is a string with the message you want to print. The message can be an exception message or any other message you want. Listing 8.1 shows the use of the Log functions.
The five types of Log messages help you to filter messages so that you don't get lost in thousands of messages on the logcat screen. You can use the log type selection box in the middle of the screen, as shown in Figure 8.23.

Figure 8.23 Log type selection
You can also use the Search box with or without regex to filter log messages.
Using Memory Monitor
Memory monitor enables you to watch the memory use of your application's threads and collections. This information enables you to analyze memory use. With that information, you can optimize your application's memory use and data collection to increase performance and enhance user experience. Nobody wants an application with heavy memory use or leaks that may impact the system and even cause a crash.
The Memory tab shows a flow chart for the application running on the target device, as shown in Figure 8.24.

Figure 8.24 Memory monitor
When you start using Memory monitor the chart changes to reflect memory usage. In the chart, the vertical (y) axis shows memory in use and the horizontal (x) axis tracks the time. Whenever you perform an action, the memory use changes over the duration of the action. However, it is not enough to analyze memory use just by looking at how it changes over time. You need to go deeper into the details, so you need to dump the Java Heap to track the allocation of memory.
To dump the Java Heap, click the button shown in Figure 8.25.

Figure 8.25 Java Heap dump
The Dump Java Heap button retrieves the threads and the threads’ members’ current memory allocations and writes them to a .hprof file. In order to analyze this information, Android Studio opens the dump file, as shown in Figure 8.26.

Figure 8.26 hprof memory dump
The .hprof file displays a really detailed memory allocation output for your application and system. In the Class Name pane, you can navigate to a Java class's objects and check the Instance pane to see how its members use memory. The Reference Tree pane shows the hierarchical view of objects and their values.
The Java Heap dump shows the instantaneous allocation of the application's Java Heap. However, you may want to observe and investigate how your application allocates memory while it's running. To track memory allocation this way, click the button below the Dump Java Heap button.
When you start allocation tracking, you see an icon on the memory timeline where it starts recording. After you collect enough data for your purposes, click the allocation tracking button again to stop tracking. When tracking finishes Android Studio opens an .alloc file that contains the recorded data, as shown in Figure 8.27.

Figure 8.27 Allocation tracking file
In the top pane, you see threads and their allocations and count during execution. In the bottom pane, you can group allocators, as shown in Figure 8.28.
In addition to tracking and monitoring, you can also use the button above the Dump Java Heap button to force the Java Garbage Collector to work. Use the top button to pause memory allocation tracking.

Figure 8.28 Allocation tracking with allocator grouping
Using CPU Monitor
CPU monitor shows you how much computational power you use during the execution of your application. With this data, you can analyze the running application for further performance enhancements and optimized coding.
Figure 8.29 shows a typical display when you monitor an application. The vertical axis shows the application's CPU usage by percentage.

Figure 8.29 CPU monitor
There aren't as many actions in CPU monitor as there are in Memory monitor. CPU monitor has only a tracker to get CPU usage by threads into a trace file so you can investigate the performance of the application's functions and threads. This is a very detailed file so you should zoom in after it's opened and then navigate to the methods you are looking for to see their CPU usage and execution details as shown in Figure 8.30.

Figure 8.30 CPU track dump
CPU monitor helps you find and resolve computational bottlenecks and optimize execution time.
Using GPU Monitor
GPU monitor shows an Android application's GPU use with a list of operations and their instant performance, as shown in Figure 8.31.

Figure 8.31 GPU monitor
The color-coded list at the right of the screen specifies the GPU operations monitored, and the graph is a timeline showing the color-coded operation details. Using this monitoring tool, you can get only basic data about what is happening.
To get detailed GPU tracing, you have to modify your application to activate tracer and dump tracing data, and your device needs to be rooted (that is, given root permissions by unlocking the bootloader and modifying your device). Some other profiling options can also be found on the Android devices’ developer options menu at http://developer.android.com/tools/performance/profile-gpu-rendering/index.html.
GPU debugging and tracing is too large a subject to cover in one section; if you are a game developer and use Open GL heavily, the following resources are the best guides to learn more about GPU performance analysis:
http://developer.android.com/tools/help/gltracer.html
http://tools.android.com/tech-docs/gpu-profiler
Using Network Monitor
Network monitor is there for you to work on your application's network optimization. This is another crucial point to think about while designing the application; you should consider that any Android application with an Internet connection would eventually be used on 3G/4G network, which is more costly than your home/office network. Even worse, network usage can greatly affect the power consumption of your application. Efficient use of mobile networks will encourage users to run the application without a second thought about consuming a lot of network data and losing battery life.
Network monitor is a basic monitoring tool compared to other monitors because you can observe only the incoming (Rx) and outgoing (Tx) bytes in a timeline. The vertical (y) axis shows the amount of data received or uploaded and changes as the horizontal (x) axis advances. There is no dump tool, only the timeline shown in Figure 8.32.

Figure 8.32 Network monitor
ANDROID DEVICE MONITOR
In addition to the Android Monitor tools, you have access to a legacy tool from Android SDK, the Android Device Monitor. This tool runs as a separate application and can be started from Android Studio by clicking the Android icon next to the SDK Manager icon on the toolbar. You can also select it from the Tools menu, under the Android section. Right after you click on the icon, Android Device Monitor will run, as shown in Figure 8.33.

Figure 8.33 Android Device Monitor
If you were an Eclipse user, you may recognize Android Device Monitor's user interface. It is similar to Eclipse's DDMS perspective view, which was the debug context UI in the Eclipse IDE when debugging Android applications.
Android Device Monitor provides some extra debugging outputs for developers in addition to the tools provided within Android Studio. Following is the list of common monitoring tools in Android Device Monitor with Android Monitor.
- Logcat—Logcat appears at the bottom of the window in Figure 8.33. Logcat in Android Device Monitor prints the same output as in Android Monitor, but the output format is column-based texts here. The rest of the functions (filtering and searching messages) are the same.
- Devices—In this tab, you can manage devices, take screenshots, and stop running processes, as you did in Android Monitor. You can also initiate heap and memory dump, and you can see the dumps in tabs at the right of the window. Threads, Heap, Allocation Tracker, and Network Statistics are available as well. Similar to Android Monitor, it is also possible to trace GPU usage.
-
Threads—This tab of Android Device Monitor is similar to CPU Monitor in Android Monitor. You activate thread tracing by clicking Update Threads or Start Method Profiling to get execution data for an Android application's threads. When you click Update Threads, you will see refreshed data about Android threads on the Threads tab, as shown in Figure 8.34.

Figure 8.34 Threads in Android Device Monitor
If you start tracing an application's threads and functions by clicking Start Method Profiling and then stop tracing after a while, you can get a trace file, as in Android Monitor, to analyze functions and the threads’ performance. The
.tracefile opens automatically, right after you stop tracing, as shown in Figure 8.35.
Figure 8.35 Thread trace
This tool can be used together with Android Monitor's CPU Monitor, for a little more detailed analysis.
-
Heap—This feature is similar to the Memory Monitor tool in Android Monitor. It is used to analyze an Android application's threads’ memory allocations from the Android heap. You can activate Heap tracing by clicking the Update Heap button on the Devices menu; then you can navigate to the Heap tab and get the threads’ current allocations, as shown in Figure 8.36.

Figure 8.36 Heap tracing in Android Device Monitor
You can also dump the hprof file for further analysis of memory allocations using the Dump HPROF File button, and can navigate to the Allocation Tracker tab to instantly monitor the memory allocation of the Android application.
- Network Statistics—This tool is the same as Network Monitor; you just need to activate network tracking to see RX and TX bytes.
- Emulator Control—This tab includes options to help with the debugging process within an Android virtual device by mocking SMS, phone calls, and sensors. This feature is not active in Android Studio; instead, it is activated when you launch a virtual device. The next section, “Android Virtual Device Extended Controls,” discusses this in more detail.
The following list describes the extensions in Android Device Monitor, which may ease some debugging processes on Android devices.
-
UI XML Dump—This function allows you to dump the XML layout and hierarchy of the currently running application's user interface on the Android device. You can start dumping the XML of the view by clicking the XML dump icon in Device view, as shown in Figure 8.37.

Figure 8.37 XML dump icon
As shown in Figure 8.38, when the dump finishes, a new tab opens in the Android Device Monitor. You can click any view to see all the detailed features of the views.
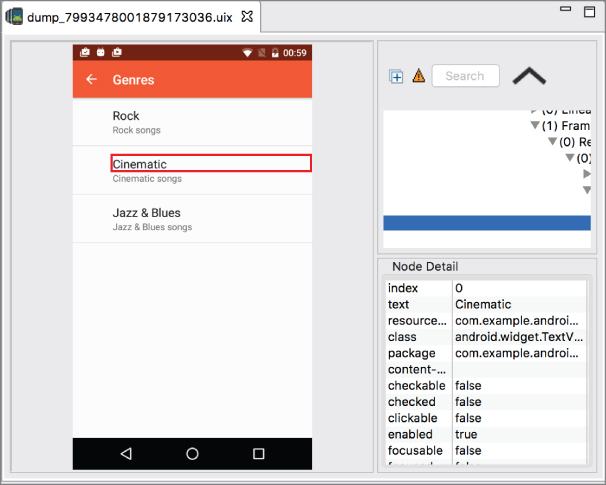
Figure 8.38 XML dump view
- File Explorer—This tool, shown in Figure 8.39, enables you to see files and folders in a tree view. In this view you can transfer files between the Android device and the host machine as well as delete files and create folders using the buttons at the top of view.

Figure 8.39 Android Device Monitor File Explorer
- System Information—This view uses a pie chart to provide quick information about the device CPU load, Memory usage, and Frame Render Time (see Figure 8.40).

Figure 8.40 System Information view in Android Device Monitor
-
Hierarchy View—The tools mentioned previously in this list are part of Android Device Monitor's DDMS (Dalvik Debug Monitor Server). Android Device Monitor has another useful tool to help you analyze your application's user interface layouts and see their render time to optimize the user interface. To display the view hierarchy, click a process from the list and the corresponding hierarchy view will be generated to the right, as shown in Figure 8.41.

Figure 8.41 Hierarchy view generation
The Hierarchy view contains red, green, and yellow circles that indicate how long it takes to render that particular view. Double-click an object to zoom in, as shown in Figure 8.42.

Figure 8.42 Hierarchy view details
By using Hierarchy view, you can investigate the bottlenecks on your user interface and improve performance for a better user experience.
ANDROID VIRTUAL DEVICE EXTENDED CONTROLS
Some features of Android smart phones and tablets, such as phone calls, handling SMS, GPS data, and fingerprint sensors, might be difficult to virtually emulate on regular personal computers. To make tests easier on virtual devices, Emulator Controller was used by developers in Eclipse. Now, we have extended features embedded into virtual devices that can be accessed from a running virtual device's toolbar by clicking the ellipsis (…) button shown at the bottom of Figure 8.43.

Figure 8.43 Virtual device toolbar
When you click the ellipsis button, the Extended controls window, shown in Figure 8.44, opens.
The extended controls of AVD are as follows:
-
Location—Location helps mock location data on a running Android emulator to check that your application is getting data correctly and your algorithms do the location-related calculations correctly. Trying location simulation is pretty easy. If your AVD is generated by using a Google API image, you can open Google Maps in AVD, set the latitude and longitude, press Send, and press the Locate button in Google Maps, and you are at the location.
In the sample, we pointed to the River Thames in London and Google Maps took us there, as shown in Figure 8.45.
However, one static location is not always enough. It is also possible to load a GPX/KML data file to simulate a changing location on an emulator by setting the speed. These buttons and actions can be seen at the bottom of Figure 8.45.
- Cellular—Cellular allows you to emulate the network status of a phone. You can select EDGE, GPRS, or None as the network type, and voice and data status as either Roaming or Home to simulate different types of network statuses. That enables you to see the behavior of your application. In this way, you can debug and catch unexpected errors.
- Battery—Battery simulates the battery status on the emulator. The aim is to test how your application works under low and high power conditions.
- Phone—This feature allows you to call and send SMS to your emulator. If your application works with calls or SMS, you can use this feature for better testing. It is pretty straightforward to call or send SMS. Just type a phone number and press Call or Send Message, and your emulator will show that it's receiving a call from the number, as shown in Figure 8.46.
- Directional Pad—This feature emulates an Android TV remote controller with directions and playback buttons.
- Fingerprint—Fingerprint allows you to define a fingerprint template on an emulator and test how it works in your application.
-
Help—This tab, shown in Figure 8.47, includes the keyboard shortcuts to directly access any feature mentioned in this list.
Now, you should be aware of the power of AVD and be able to take advantage of all provided features.

Figure 8.44 Extended controls window

Figure 8.45 GPS location setting

Figure 8.46 Emulator call

Figure 8.47 Android virtual device keyboard shortcuts
USING LINT
Previous sections of this chapter discussed the tools that help with debugging and performance analysis of your Android application. This section visits another tool, Android Lint, which helps you to detect any kind of error, warning, or suggestions for written code.
To run Android Lint, select the Analyze menu and click Inspect Code. Android Lint gives you the opportunity to improve your code, detect possible bugs, correct typos, resolve accessibility of objects, investigate assignment problems, and so on.
It is good practice to run Android Lint before committing code to a version control server when new patches are added to an application.
Figure 8.48 shows example output of Android Lint analysis. The Inspection window shows all findings of Android Lint.

Figure 8.48 Android Lint output
Together with Android Studio and Gradle, you can also run Lint during the build and inspect code. In order to set Lint configurations in the Gradle script inside Android, you should add lintOptions. In the sample UniversalMusicPlayer's Gradle script, the following section is provided:
Android {
…
lintOptions{
       abortOnError true
}
…
}
To see other Lint options for Gradle, visit http://google.github.io/android-gradle-dsl/current/com.android.build.gradle.internal.dsl.LintOptions.html#com.android.build.gradle.internal.dsl.LintOptions.
TESTING ANDROID CODE AND APPLICATION UIS
Testing might be the most underestimated topic in the whole software development lifecycle. Every developer and all projects claim to conduct tests, but few conduct the right tests with proper coverage. Tests can help detect bugs and defects before they appear. They greatly help distributed teams to work in harmony without breaking each other's code.
Most test-related APIs in Android have been available since the first “real” release, version 1.5 (Cupcake), and some were available even with the initial release of Android SDK. Yet this didn't make tests appealing to many Android developers. Android Studio, with Gradle, aims to make writing tests and following test-driven development easier. To create tests for the following sections, you will use a pre-written simple example. Download the example code for this chapter, named “beginning,” and import the project.
The example is a binary calculator that converts decimal to binary and vice versa via a simple UI. The project has an interface and four class files, consisting of an activity, two fragments, and a class to encapsulate logic. Later, we introduce a few more classes and refactor the current classes. You can run and experiment with the application. Listings 8-2 through 8-6 contain the code for the application. If you are going to create the classes manually instead of downloading them, pay attention to the package names.
Unit Tests
Unit tests are great for testing the functionality of a method. Good unit tests make bugs visible as they appear. The idea behind a unit test is to test a method with possible inputs and inspect the output. They are useful not only for typical cases. Unit tests for edge cases and error cases should also be written to provide good test coverage.
The Calculator class has two logic methods that are great candidates for unit testing. The project currently has two test folders: tests and androidTests. Right-click tests and create a new class as shown in Figure 8.49.
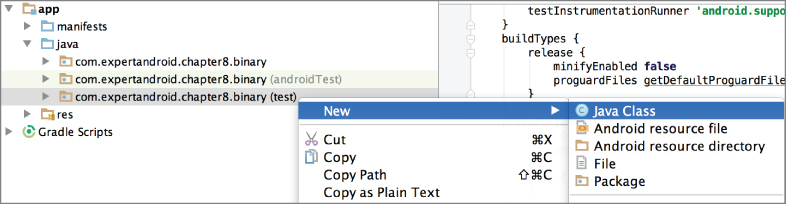
Figure 8.49 Creating a new class in the tests folder
Name the class CalculatorTest. Because you have two methods—one to convert binary to decimal and another to convert decimal to binary—you will write success and fail cases for both. For the sake of simplicity, you will write two tests for each method shown in Listing 8.7. (In real life, you may need to implement more test cases to cover edge cases, null input, extra large or small data sets, and other error conditions.)
Now you can run your test and see whether it succeeds. Right-click on the CalculatorTest class and select Run. Android Studio will run all tests in the class and display a summary of the status. Whether you are confident about your code or not, seeing the green bar shown in Figure 8.50 always feels great.

Figure 8.50 CalculatorTest results
This example used assertThat with is to test the output with expected values. There are several other methods that work for the same purpose:
assertassertEqualsassertNotEqualsassertTrueassertSameassertNotSameassertNullassertNotNull
The use of these methods is beyond the scope of this chapter, but most assert methods expect two inputs: the output of the method under test and the expected value.
Any code that does not have UI interaction can be easily tested with basic unit tests. A good separation of UI and logic code will enhance testability, and several approaches such as MVC or MVP help you achieve this goal. Once the UI code is separated, the remaining code can be tested with simple unit tests.
Integration Tests
The method under test might be using an Android-specific API that needs a full-blown OS for running, for example, database operations on Android's SQLite. Starting with version 1.1 of the Android Gradle plugin, a mockable version of android.jar has been introduced in order to simplify testing. This approach can be used with popular mocking frameworks such as mockito. Our example will not be making use of powerful mockito features; however, in real life mockito greatly helps with mocking.
Integration tests do not need to open activities or fragments but can still test platform-specific APIs and features with the help of android.jar. They can also mock other integration points such as backend, database, or any other external resource. To run tests on a mockable version of android.jar, you would need to introduce product flavors, which we covered in Chapter 4.
Let's change our calculator to implement a sophisticated user history on a remote server based on social login. For the sake of simplicity, let's leave the implementation empty, as presented in Listing 8.8.
Because our fancy user cache is ready, let's integrate it with the Calculator, as shown in Listing 8.9.
Now, let's assume you don't want to go to the backend and make network calls simply to test the Calculator class. To achieve this goal, you need to mock the History class. Open the build.gradle file of the app module and add a product flavor for the purpose of mocking, as shown in Listing 8.10.
Now it is time to create your folder structure for the mock flavor. Navigate to the src folder and create a mock/java folder. Next, create a package with the same name as the package in which your History class resides: com.expertandroid.chapter8.binary.logic. Create a class named History and add the code shown in Listing 8.11.
Unlike the original History class, the mock History class uses an internal stack to keep values in memory instead of making network calls. Finally, in order to replace the original History class with the new mock History class, you need to move it to its own flavor. You already added prod behavior but you need to move the History class into a flavor-related directory structure. Navigate to the src folder and create a prod/java folder. Next, create a package with the name com.expertandroid.chapter8.binary.logic and move the original History class from the main/java folder to your newly created package. Now you can select either the prod or mock build variant to change the History class implementation in use, as shown in Figure 8.51.
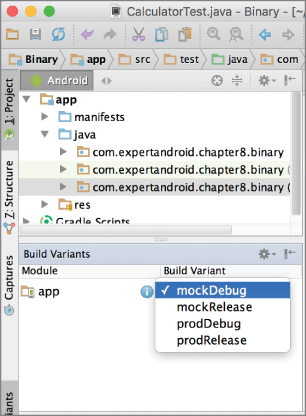
Figure 8.51 Debugging a mock class
UI Tests
Testing the UI is another important step in the software development lifecycle. Even projects with pretty good unit test coverage fail to implement automated UI tests most of the time. UI tests provide complete end-to-end testing and help you figure out if your app is behaving as expected. Good UI test coverage would greatly help expose broken code or functionality. If you are coming from a web background or build HTML5-based apps for Android, you might already be familiar with automated web UI testing frameworks such WebDriver and Selenium.
Android also has a powerful UI testing framework called “Espresso.” The Espresso UI runs on an emulator or a device. Espresso can automate user interaction, fill fields, submit actions, and even analyze outputs and changes to make sure they are as expected. The final example of this chapter will test your UI by using your binary calculator, checking the output, and then switching to the decimal calculator and again running a calculation and testing the output.
Let's start by adding the dependencies needed for Espresso. Open your build.gradle file and add the dependencies shown in Listing 8.12.
The parts highlighted in bold are newly added configurations and dependencies needed for the UI tests you are about to write.
Because you finished adding your dependencies, it is time to code. Let's start by listing the steps in the expected scenario and later turn them into code.
When the user launches your application, the first fragment in focus is the Binary calculator. The first step will be moving focus to the text field and writing a valid binary number. Next, you need to access the button and trigger an onClick event. Finally, you need to check that the displayed value is your expected result.
Now that you've decided on your testing scenario, go to the androidTest/java folder and create the com.expertandroid.chapter8.binary package if it does not already exist. Next, create a new class named ApplicationTest. Now you are ready to code. Listing 8.13 shows the first test, which tests the initial fragment.
The first part of the class file is the ActivityTestRule declaration. A rule provides functional testing of a single activity by launching the activity for each method annotated with @Test.
Next you have your test method calculateBinary, which is annotated with @Test. This method consists of four lines. The first line looks for the field binaryNumberEditText with the field ID on a view. However, because your fragments are in a view pager, you would need to look for the one you want by using isDisplayed matcher. Although you field ID is unique, it is in a adapter so there are no guarantees that there are no other similar instances. Once you find the binaryNumberEditText field, you perform a type text action to enter the value to test. Now you need to click the button, but as in real life, the software keyboard is currently covering the button. The Espresso.closeSoftKeyboard method closes the keyboard. Next, you can click the button by using its ID and finally search for the expected value in the displayed field.
You have finished your first UI test. Now either launch the emulator or connect a device and run the test by right-clicking and selecting the Run ApplicationTest option as shown in Figure 8.52.

Figure 8.52 Running an Espresso test
Now that you have finished testing the binary fragment, you can move on to testing the decimal fragment. DecimalFragment is almost an identical copy of BinaryFragment. So you will use similar code but change UI field names and values to test the DecimalFragment. However, you also need to swipe left and display the DecimalFragment first, as in Listing 8.14.
The first line in the test performs the swipe action by creating a new GeneralSwipeAction object. GeneralSwipeAction has the following parameters in order: swipe type, start location, end location, and input device that triggered the swipe.
Now you have all the pieces you need so you just need to tie them together in order to run them as a whole large test. JUnit 4 has great utilities to accomplish your goal. Check that you have the annotations in the following code snippet, above your class declaration.
@RunWith(AndroidJUnit4.class)
@LargeTest
Run the application test and watch how the application ran and what interaction occurred on the device or emulator. Finally, both tests should pass and display something similar to Figure 8.53.

Figure 8.53 Test output
That's it—you wrote unit and UI tests and integrated them with your existing code. The next section focuses on testing your app's performance and collecting valuable information and statistics.
Performance Testing
So far, you tested the functionality of your methods and user interaction with the UI, but there is another important aspect of testing. Performance tests can reveal memory leaks and unnecessary computation or object initialization, which result in performance problems in applications. Such problems do not appear in unit, integration, or UI tests.
The first tool you are going to use for testing performance is Systrace, which captures and displays the application code execution time. To start Systrace, click on the terminal tab in Android Studio and type the following command, depending on your OS. Listing 8.15 shows the command for Windows, and Listing 8.16 is for Linux and Unix.
Replace XXtrace.html document produced by the Systrace (see Figure 8.54).

Figure 8.54 Systrace output
The Systrace report is interactive and enables users to focus on items to examine details, zoom in or out, or highlight the timeline. Click on the alerts line to display alerts raised by the app. Most of the time, alerts can provide very useful clues about performance bottlenecks.
Performance Tests Task
Running Systrace to examine your app performance is an essential method to understand performance problems. Watching the performance changes by automating Systrace is crucial. You have already covered automated UI testing in previous sections; now you will add Systrace to accompany them.
Google has revealed a set of new test rules with an android-perf-testing codelab. These rules might become part of a new test support library or dependency in the near future. Until then, it is okay to check out and copy the classes from https://github.com/googlecodelabs/android-perf-testing/tree/master/app/src/androidTest/java/com/google/android/perftesting/testrules to your project. These rules can easily be added to your test projects, as shown in Listing 8.17.
Add the rules in Listing 8.17 to ApplicationTest. You should also add the @PerfTest annotation to the class to enable it for performance tests. Finally, open the build.gradle file and add the following line to apply performance tasks:
apply plugin: PerfTestTaskGeneratorPluginYour final code should look like Listing 8.18.
When executed, your test will collect and log more information to help you fix performance problems.
SUMMARY
This chapter gave you a solid, basic understanding of the full power of Android Studio's testing capabilities and debugging tools so you can debug and test your Android code efficiently.
We started by discussing debugging and the underlying technology, adb, which allows you to remotely debug Android devices. We followed up with Android Monitor in Android Studio, which is used for better monitoring and system information capturing.
Next, we looked at the Android Device Monitor for further Android device and application monitoring, and at legacy tools.
We finished the chapter working on test methods and tools for Android applications using Android Studio and SDK tools. You learned how to use automated tests of your application's functionality and UI as well as how to use performance tests to collect and record valuable runtime information.