
Chapter 13
Third-Party Tools
WHAT'S IN THIS CHAPTER?
- Android Studio plugins
- Intel System Studio
- Intel Integrated Native Developer Experience (INDE)
- Qualcomm Android software tools
- NVIDIA Android Software Tools
Throughout this book, we showcased all the fundamental features you would expect to use for Android application development and to expand the capabilities of Android Studio. In this chapter, we present some popular Android Studio plugins and chip vendor tools you can use to expand your development skills and capabilities.
We start by exploring Android Studio plugins and their use cases, and then we follow up with tools developed by Intel to enhance Android application development together with Android Studio. Finally, we look into Qualcomm and NVIDIA software tools for Android.
ANDROID STUDIO PLUGINS
Android Studio is extensible with plugins that can improve its capabilities and functionality with custom actions. It is possible to install plugins from plugin repositories online or via a local jar or zip file, as you did in Chapter 12.
You can navigate between plugins from the Android Studio start or Preferences windows. Open the Preferences window from Android Studio and navigate to the Plugins section to see the installed plugins, as shown in Figure 13.1.

Figure 13.1 Installed plugins in Android Studio
This initial window shows just the installed plugins. By default, there are many plugins installed related to core Android application development and some other supporting tools to improve the development cycle, such as GitHub integration and Google Cloud Tools.
You can look at the available plugins by clicking the Browse repositories button. The window that opens, shown in Figure 13.2, shows the plugins from the default JetBrains repository.
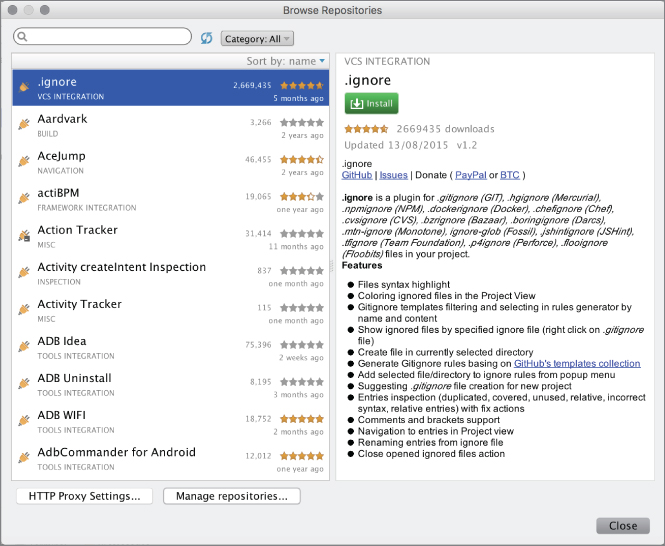
Figure 13.2 Installable Android Studio plugins
You can also look at the JetBrains plugin website at https://plugins.jetbrains.com/?androidstudio to see the popular plugins, as shown in Figure 13.3.
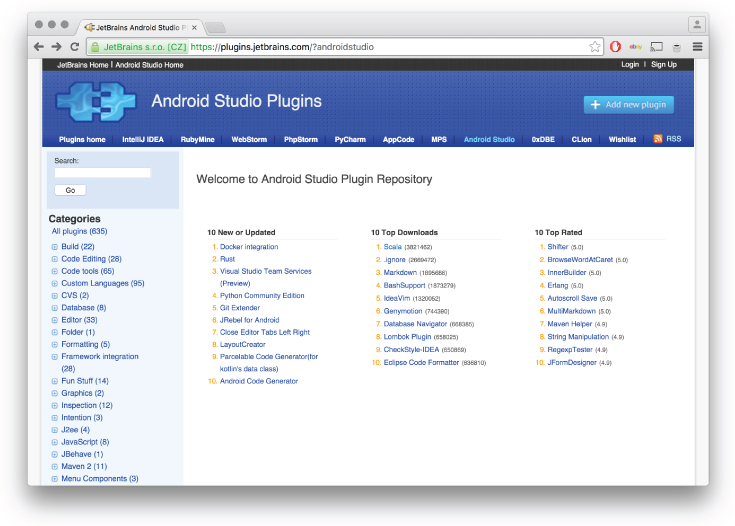
Figure 13.3 JetBrains plugins website
The JetBrains plugins site makes it easier to find popular plugins because it breaks them out into categories. However, if you want to install them, you should use the Android Studio plugins window.
Installing a new plugin is easy; when you select the plugin from the list of plugins and click the green Install button, shown in Figure 13.2, Android Studio will download and install the plugin seamlessly. After the plugin has been installed, you will see the Restart Android Studio button, shown in Figure 13.4. Restarting is required to make Android Studio ready to use the installed plugin. After you restart Android Studio, the plugin will be activated. In this example, we installed the .ignore plugin.
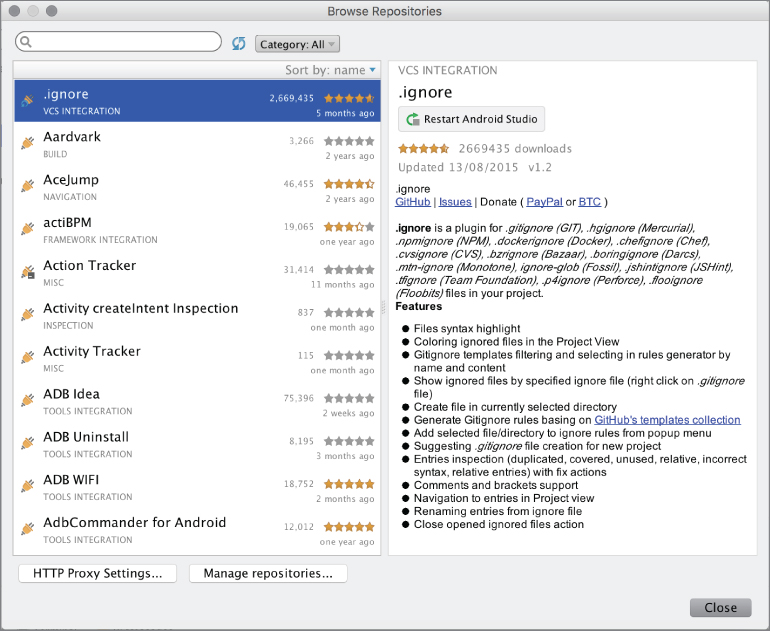
Figure 13.4 After plugin installation
The .ignore plugin's detailed description is shown in the right pane. .ignore is used to organize files that are autogenerated by the build system and add them to the .ignore file (.gitignore if you are using Git) to prevent adding them to the version control system.
As Figure 13.5 shows, the New menu now has an .ignore item that includes options for adding .gitignore or any other version control system's ignore file.

Figure 13.5 .ignore plugin
Here are some other plugins you may find useful for application development:
- ADB Idea—This tool enables Android Studio to perform certain ADB commands through Android Studio. When you install ADB Idea, it will be enabled in the Tools ⇨ Android menu, with the actions shown in Figure 13.6. ADB Idea makes it easy to control the debugging process and remote devices without launching the adb tool from the terminal.
-
ADB WIFI—This plugin helps you debug Android devices remotely over Wi-Fi. To enable your device for debugging over Wi-Fi, make sure your device is connected through USB first, and then navigate to Tools ⇨ Android ⇨ ADB WIFI and click ADB USB to WIFI, as shown in Figure 13.7.
When your device is ready, it will display the connection info with your device's local IP address, as shown in Figure 13.8. Both your development machine and Android device should be on the same network.
Avoiding the messiness of cables is relaxing, so the capability to debug your device wirelessly is a great feature. While it's easy to debug smartphones with a USB cable, wirelessly debugging Android TV is far better.
-
Android Drawable Importer—Managing drawable resources can be tricky when your application needs multiple resolutions and colors. Android Drawable Importer makes it easy to import icons with multiple colors, assets with multiple resolutions simultaneously, and so on. New actions (shown in Figure 13.9) are available from the New option, accessed by right-clicking, or from the File menu.
As an example of how these options work, let's look at Icon Pack Drawable Importer. When you click this action, a window opens where you can select and customize icons for your application. You can set the color, name, and resolution of the icon, as shown in Figure 13.10.
- Android strings.xml tools—If your applications have too many string resources for localizations, it might be hard to find one or to add a missing translation string. This basic tool does two simple actions to sort the strings and add the missing string resource for your localization files.
-
Android Parcelable Code Generator—In Android, serialization to pass data between objects is made with the Parcelable interface, so you should implement the Parcelable interface for the class you want to serialize. Implementation of the Parcelable class has a pattern to follow, and the Android Parcelable Code Generator helps you create the methods and fields to implement it. When this plugin is installed, you can generate Parcelable code within a Java class by selecting Generate ⇨ Parcelable from the Generate menu, as shown in Figure 13.11.
-
Android Holo Colors—With Android Holo Colors, you can easily create custom XML resources with a desired color to use in layouts. After Android Holo Colors is installed, a new “H” button is enabled on the toolbar, as shown in Figure 13.12. When you click on the H button, the window shown in Figure 13.12 opens so you can configure your new XML resource with the selected Holo color.
When the configuration is ready, select the destination resource folder, which is your application's project root folder. According to your configuration, an XML file will be created under the drawable folders such as
apptheme_btn_check_holo_dark.xml.This plugin also has an online version, which can be found at
http://android-holo-colors.com. On this website, you can generate the required XML resources and download them as a zip file to add to your project. - Key Prompter—You might find this tool to be annoying, but it is useful to learn the keyboard shortcuts. It works by displaying a popup like the one shown in Figure 13.13 when you click an action on an Android Studio menu that has a shortcut key.
-
jimu Mirror—This plugin allows you to dynamically design and develop user interfaces for the Android UI. While you are editing XML layouts, you can see previews instantly. jimu Mirror gives you the ability to immediately see changes on the emulator and the device.
Right after you install the jimu Mirror plugin and restart Android Studio, you can either start a 30-day free trial or buy it from
http://jimulabs.com.After installation, jimu Mirror installs a new menu and toolbar buttons, as shown in Figure 13.14.
You can start and stop Mirror from the toolbar or the tool window with the Start button. The first time you start jimu Mirror, it will both install and start the jimu Mirror app on your device. When it starts, you will see actions in the jimu Mirror window and the files that are being generated and sent to the Android device. After all files are generated and ready, jimu Mirror will list the layouts on the device so you can easily work on them and immediately see any changes on the device.
-
Genymotion—Genymotion is a third-party Android emulator to manage testing Android applications on virtual devices with the provided Java API. Developers and teams can choose to use Genymotion instead of AVD. Genymotion's advantage is that it uses a Java API to test your application on a virtual copy of commercial Android devices from vendors such as Samsung and HTC.
Genymotion provides multiple pricing and licensing options; you can see them all at
https://www.genymotion.com/pricing-and-licensing/. If you just want to test Genymotion, the Basic version is free for personal use. To download Genymotion, you first need to create an account on the site.After Genymotion is installed, set the Genymotion path to the Android Studio plugin from the Preferences window, under Other Settings ⇨ Genymotion.
Now, when you click the Genymotion button on the toolbar, the Genymotion Device Manager window opens. This list will be empty initially, but after you create virtual devices in the Genymotion application, they will be listed as shown in Figure 13.15.
To create your first virtual device, click the New button to start the Genymotion application. In the window that opens, you select the new virtual device, as shown in Figure 13.16.
You can get the real devices' exact images as virtual devices with Genymotion. AVD provides only the core Android SDK with the Google API, but because most popular Android phone producers—Samsung, HTC, Asus, Motorola—have a customized Android OS on the device, you can get the exact device's virtual image only with Genymotion.
When you finish creating the selected Android virtual devices, you will see them in the Genymotion Device Manager window as well as inside the Genymotion application itself, as shown in Figure 13.17.
When you run the selected virtual device, you will see it in the Genymotion Player window, as shown in Figure 13.18. Actual performance is really good on Genymotion. You can also see tools in the player to adjust GPS, use the camera, and so on in the Genymotion Player window.
There is one more thing to mention: You can use Genymotion's Java API to test instrumentation. You can find the Java API Guide at
https://docs.genymotion.com/pdf/PDF_Java_API/Java-API-1.0.2-Guide.pdf.Detailed documentation for the Genymotion Java API can be found at
https://cloud.genymotion.com/static/external/javadoc/index.html. The Java API helps with instrument testing of the battery, GPS, SMS, and phone calls on the device.

Figure 13.6 ADB Idea action list
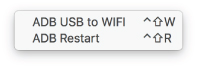
Figure 13.7 ADB WIFI menu

Figure 13.8 ADB WIFI connection information
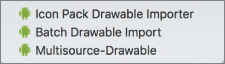
Figure 13.9 Android Drawable Importer plugin actions

Figure 13.10 Icon Pack Drawable Importer

Figure 13.11 Generate menu for the Parcelable class

Figure 13.12 Android Holo Colors configuration page

Figure 13.13 Key Prompter popup
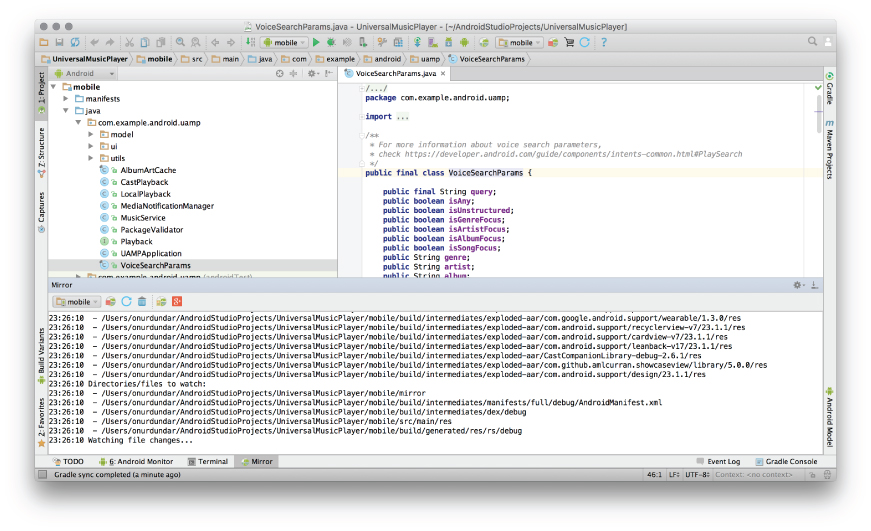
Figure 13.14 jimu Mirror tool menu and action buttons

Figure 13.15 Genymotion Device Manager window

Figure 13.16 Genymotion Virtual Device List
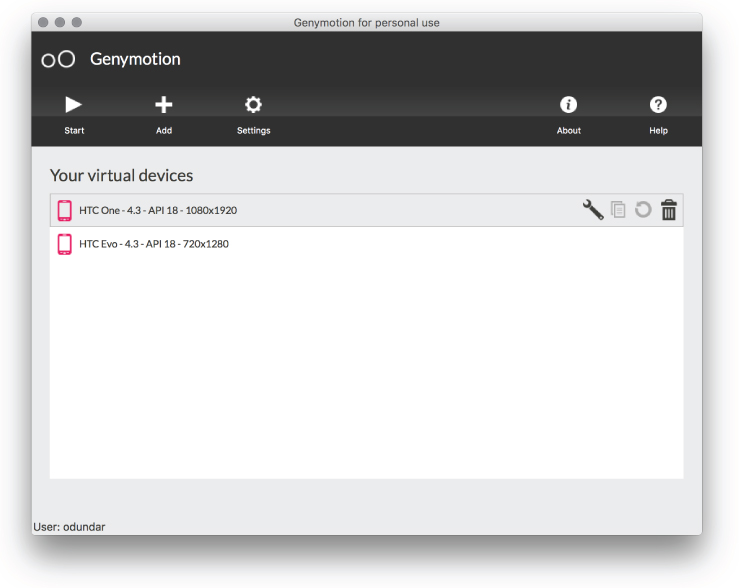
Figure 13.17 Genymotion application window

Figure 13.18 Genymotion Player window
INTEL'S ANDROID SOFTWARE TOOLS
As one of the chip vendors providing a hardware platform to develop Android devices, Intel provides tools and software libraries to help device manufacturers and developers. These tools help engineers tune all aspects of Android performance, from Android device drivers to services and applications.
Intel System Studio
Intel System Studio is a pack of software tools provided for engineers who are going to develop Intel architecture based devices. Software tools from System Studio can be used to fine tune applications and the Android OS itself. Native applications can be developed with Intel C compiler. Tools also include the performance libraries MKL, IPP, and TBB, and analyzer applications for deep performance analysis of graphics and threads.
Intel System Studio's main target is Android device manufacturers, system integrators, and embedded application developers; however, the tools and libraries (see Figure 13.19) can also be used by application developers to improve performance, especially applications with native code.
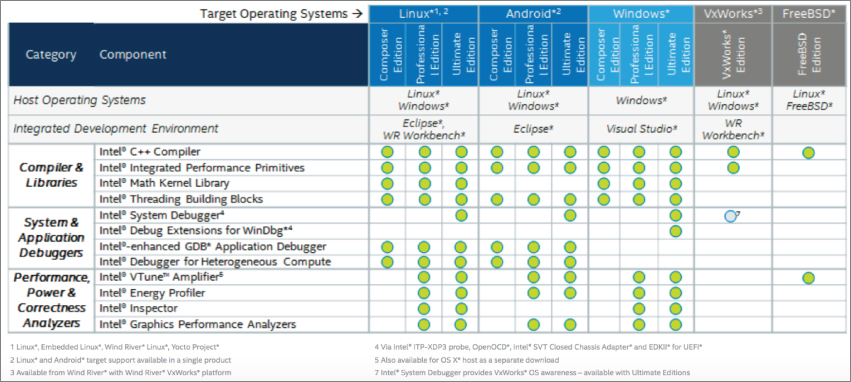
Figure 13.19 Intel System Studio version comparison
Intel System Studio is available on Linux and Windows hosts. From https://software.intel.com/en-us/intel-system-studio, select Android as the target OS and pick the version of Intel System Studio (Composer, Professional, or Ultimate) to continue the download. During installation, when you are asked for a serial number you must register to be able to download and start a 30-day evaluation period. That's covered later in this section.
You can check the Product Brief to see detailed descriptions of tools provided with Intel System Studio at https://software.intel.com/sites/default/files/managed/18/d8/intel-system-studio-2016-product-brief_final.pdf.
The features of each version of Intel System Studio are available on the website (refer to Figure 13.19).
For this example, we downloaded the Ultimate 2016 version for Linux: system_studio_2016.1.030.tar. Let's extract the file and start GUI-based installation.
$ tar xvf system_studio_2016.1.030.tar
$ cd system_studio_2016.1.030
To install the required tools, the fxload and gcc-multilib packages should be installed. Our host machine is running Ubuntu 14.04, so we will use apt-get. If the packages are not installed, installation will warn you about the missing dependencies:
$ sudo apt-get install fxload gcc-multilibStart GUI-based installation from the system_studio_2016.1.030 folder:
$ ./install_GUIThe installer asks about the rights of the tools for root or the current user. We selected the sudo installer to be on the safe side and installed the system tool for all users in the system. If you select sudo-based or root installation, you will be asked for the sudo password in the next window.
The list of tools will be shown in the Welcome window, as shown in Figure 13.20.

Figure 13.20 Intel System Studio components
If you already have a serial number, you can enter it in the next window, or just select Evaluate this product. The next screen shows the Installation Summary and is where you configure the installation directory. The default is s/opt/intel. The opt directory is used by third-party applications in Linux-based operating systems.
The next window, shown in Figure 13.21, presents the Eclipse IDE integration options because most Intel System Studio tools are integrated with Eclipse IDE. If you select integration with an existing Eclipse installation, Eclipse will be configured for use with Intel System Studio. We selected not to integrate with Eclipse, so we will see Eclipse Luna in the /opt/intel/eclipse directory.

Figure 13.21 Eclipse Integration selection
When the installation process asks about Wind River integration, skip it. Finally you see the Android NDK integration screen; we integrated Intel's compiler with our Android NDK. If you want to do so, just type the location of ndk-bundle's toolchain folder path, as shown in Figure 13.22, and you are done preparing the installation.

Figure 13.22 Intel System Studio Android NDK integration
If you downloaded the offline version as we did, it won't take long for the installation to finish. The online version could take longer because it will download the required files during the installation (rather than downloading them with the offline installer), and so depends on the speed of your Internet connection.
The next section discusses some tools provided with Intel System Studio for Android development use. The Intel C++ Compiler is covered in detail first because it is the main component for optimizing binaries for Intel devices. Then we briefly discuss the Intel Integrated Performance Primitives library, Intel Thread Building Blocks library, Intel VTune Amplifier, Energy Profiler, and Graphics Performance Analyzer so you understand their capabilities and purpose.
Intel's Android tools are targeted primarily at embedded software developers and native game developers, not developers of basic Android SDK applications.
Intel C++ Compiler
The Intel C++ Compiler (ICC) is included with Intel System Studio for use in Android. Intel's compiler generates only x86 and x86_64 native applications, so the Intel C++ compiler will generate only x86 and x86_64 binaries.
If you indicated the path correctly during installation, you will see x86-icc (write all folders) under the ndk-build/toolchains folder. However, you are not yet ready to use ICC to build x86 binaries; you need to complete the setup to ensure that switching from NDK's default x86 compiler to the Intel C++ Compiler happens.
Now ICC is ready to build C and C++ code. Android Studio is not ready to work with the Intel C++ Compiler, so for this example you manually build sample C code to see whether a test file you will load really compiled with Intel's compiler.
To begin, open the HelloJNI sample application from the NDK sample list (see Chapter 11 for information about native application samples). After you have loaded the HelloJNI sample, you will see the hello-jni.c file in the src/main/jni folder. We will add a new line to hello-jni.c to see whether it has been compiled with the Intel C++ compiler. Change the final return line as shown in the following code snippet:
#ifdef __INTEL_COMPILER_UPDATE
    return (*env)->NewStringUTF(env, "Hello from Intel C++ !");
#else
    return (*env)->NewStringUTF(env, "Hello from JNI !  Compiled with ABI "
ABI ".");
#endif
Open a terminal in Android Studio and navigate to the jni folder to create the libhello-jni.so library for x86:
$ cd  src/main/jni
$ icc –platform=android –c hello-jni.c
$ icc –platform=android –shared –o libhello-jni.so hello-jni.o
Now copy the .so file to the jniLibs folder to make sure the shared library is copied to APK. Create a jniLibs folder under the src/main folder and an x86 folder under the jniLibs folder you just created. Then copy the shared library to jniLibs/x86.
$ cp src/main/jni/libhello-jni.so src/main/jniLibs/x86Now, you need to build the project and run the application on an x86 virtual device or a real device. This should show that it worked, as shown in Figure 13.23.

Figure 13.23 Intel C++ Compiler Hello JNI sample
ICC manually as in this example is not very efficient. You can use it the “old fashioned” way (using Makefiles and Android.mk files) until there is support in Android Studio to select ICC for x86 in the gradle configuration. Until then, you need to use it this way or continue to use it in the Eclipse IDE.
ICC is also supported in Visual Studio, so you can build Android code with native libraries using Visual Studio and ICC.
Intel Integrated Performance Primitives (Intel IPP)
Intel IPP for Android is available only with Intel System Studio; there is no standalone download for it.
The Intel IPP library is a very advanced set of code-based functions optimized for Intel's Streaming SIMD Extensions and Intel's Advanced Vector Extension instruction sets. IPP functions are the fundamental algorithms used in digital media, communications, and scientific, embedded software applications.
There are many areas in which Intel IPP can help you run complex algorithms and can help software run better on Android devices having Intel's SoC (System on Chip). The Intel IPP library uses an Intel CPU's advanced instruction sets to make software run faster and more energy efficiently.
Detailed documentation for Intel IPP can be found at https://software.intel.com/en-us/intel-ipp.
Intel System Studio installation places the Intel IPP libraries, headers, and samples in the /opt/intel/ipp folder.
Under the bin folder, you can find ippvars.sh to source the Intel IPP library and header files to the system. The bin folder also holds the examples folder for Android samples.
Intel ICC and IPP tools are not integrated with Android Studio yet so you should use Eclipse or traditional command-line build tools to create libraries with IPP.
IPP libraries provide the best functions to create good native applications, especially if you are going to work on audio processing, image recognition, or pattern recognition. IPP can help optimize applications that use low-level data processing from sensors such as microphones, cameras, and motion sensors.
Intel Thread Building Blocks (Intel TBB)
Intel TBB is a library to optimize C++ code for highly optimized parallelization. It is provided with Intel System Studio. Its files and examples are in the /opt/intel/tbb directory. Unlike Intel IPP, you can also download the open source version of the TBB library. The latest open source versions can be found at https://www.threadingbuildingblocks.org/.
Like ICC and IPP, TBB has a tbbvars.sh file for include and library directories.
TBB enhances parallelization of C++ code to optimize existing data structures and algorithms. You can find many samples inside the tbb/examples directory such as a concurrent hash map, priority queue, graph samples, parallel loop implementations, and a Sudoku solver. All are great examples to get you ready for parallel programming with TBB.
Intel VTune Amplifier
Intel System Studio delivers Intel's performance profiler to get detailed CPU and GPU data using Intel's VTune Amplifier. Intel VTune Amplifier is provided with Intel System Studio, and is also available as a standalone application. Visit https://software.intel.com/en-us/intel-vtune-amplifier-xe to download it for your target OS—currently Android is the only option—and use on a Linux or Windows host.
In our Intel System Studio installation, you should navigate to /opt/intel/vtune_amplifier_for_systems. There you will see bin32 and bin64 folders that include the binaries to run the standalone Intel VTune Amplifier application. We will use the 64-bit version and run it with the following command:
$ ./bin64/amplxe-guiThe first time you run it, it will ask whether you want to participate in the developer program; you can either skip that or participate. Then you will see the window shown in Figure 13.24.

Figure 13.24 Intel VTune Amplifier
To start profiling an x86 Android system, application, or process, start a new project. Just click New Project and enter a name for the project. Next, you will see a new tab next to the Welcome tab named New Amplifier Result where you choose the analysis target, as shown in Figure 13.25.

Figure 13.25 Intel VTune Amplifier new project view
As Figure 13.25 shows, there are three targets: local, Android Device (ADB), and remote Linux (SSH). You should select Android Device to analyze your x86 Android device. You can also choose to analyze the process, system, application, or an Android package by selecting an item from the drop-down box shown in Figure 13.25, and it is also possible to select a target device just next to the target process.
To start collecting data from the target device, you can just click the arrow button on the toolbar. When you are finished with data collection, detailed information is displayed and you will be able to navigate between each part of the analysis data.
Intel GPA
Intel GPA (Graphics Performance Analyzers) is a set of tools like Intel VTune Amplifier but providing more high-level analysis options on Android devices. Compared to VTune, Intel GPA is less complex and easier to use. Android tools included in Intel GPA are:
- System Analyzer—This tool shows performance bottlenecks on the CPU or GPU. In order to run System Analyzer on an Intel System Studio installation, go to /opt/intel/SystemAnalyzer and run the gpa-system-analyzer-bin binary. When you run the application, you will see the list of devices available to use with System Analyzer. When you select the appropriate device and connect to it, you will see the list of compatible applications and the system option to view the performance timeline.
- Platform Analyzer—This tool provides an overview of dump data collected over time to show bottlenecks during application execution. To run Platform Analyzer, run the /opt/intel/PlatformAnalyzer/bin64/amplxe-gui binary.
- Graphics Frame Analyzer of OpenGL–Use this tool to get detailed graphics frame analysis for applications such as games that use OpenGL. To run the Graphics Frame Analyzer, go to the Intel System Studio installation path, /opt/intel/FrameAnalyzerOGL, and run the FrameAnalyzerOGL binary.
Intel GPA is available both with Intel System Studio and for standalone download and use. To download the standalone version, select Intel Graphics Performance Analyzers at https://software.intel.com/en-us/gpa and select Intel GPA from the right pane. To download standalone versions of tools, enter your email address, and you will be sent a link with the URL to download tools to your host OS.
INTEL INDE
Intel INDE refers to Intel Integrated Native Developer Experience with supported tools for Linux, Windows, and Android platforms for developing high performance applications running on platforms with Intel CPU and GPU. Detailed information about all the tools and libraries provided in the Intel INDE program is available at https://software.intel.com/en-us/intel-inde.
You must register with your email address to receive a response download links for the tools. For some tools, the links take you directly to the download URL.
Some tools are listed on the Intel INDE home page, while others such as Intel C++ Compiler are available only with Intel System Studio. Intel IPP and some others such as Intel GPA and VTune are provided both as standalone tools and with Intel System Studio. In this section, we discuss only the tools provided in the Intel INDE program that we haven't covered in the previous sections of this chapter.
Some tools in the Intel INDE that we discuss here (such as Intel Tamper Protection Toolkit and Intel Multi-OS Engine) are in beta phase. This section begins with a brief overview of Intel Tamper Protection Toolkits. Then we dive into a detailed look at Multi-OS Engine and Context Sensing SDK.
Intel Tamper Protection Toolkit
The Intel Tamper Protection Toolkit helps developers protect their application with code obfuscation and securing passwords with crypto libraries.
Like INDE tools, Intel Tamper Protection Toolkit also works with Android NDK for better protection and advanced security. More detailed information and the toolkit can be downloaded at https://software.intel.com/en-us/tamper-protection.
If you are developing an application with sensitive user information, or using a highly advanced and private algorithm that you want to protect against reverse engineering, Intel Tamper Toolkit can help you learn about obfuscating and securing your intellectual property and sensitive data.
Intel Multi-OS Engine
The Intel Multi-OS Engine, also provided in Intel INDE, is a framework to help developers create Android and iOS applications with Java programming languages. The Multi-OS Engine is integrated with Android Studio and XCode to generate installable binaries for Android and iOS.
The Multi-OS Engine's modules and related tools make up a single framework for creating iOS and Android applications, but it is not an easy tool to use. It is not yet a mature product, so you should expect to get errors during development. In addition, you will need to learn about Nat/J performance bindings and so on for effective application development. However, if your application will be a simple one, you are an expert with the framework, and you need to publish an application immediately on both platforms, the Multi-OS Engine can be very useful. Otherwise it can be a waste of time to learn the Multi-OS Engine framework. Continue reading if you want to see the installation instructions.
The Multi-OS Engine is available for Windows and Mac OS X; it can be downloaded at https://software.intel.com/en-us/multi-os-engine/.
In this example, we test the Multi-OS Engine on Mac OS X, so you should downloaded the m_multi_os_engine-1.0.598.dmg file.
To install Multi-OS Engine, open the .dmg file, then run the Multi-OS Engine Installer 1.0.598.app. In the first screen, the installer asks for the system password. Then it follows up with a screen asking for the direct JDK, Android Studio, and Android SDK locations, as shown in Figure 13.26.

Figure 13.26 Multi-OS Engine SDK path selections
The installer continues with the license agreement and then the installation path selection shown in Figure 13.27.
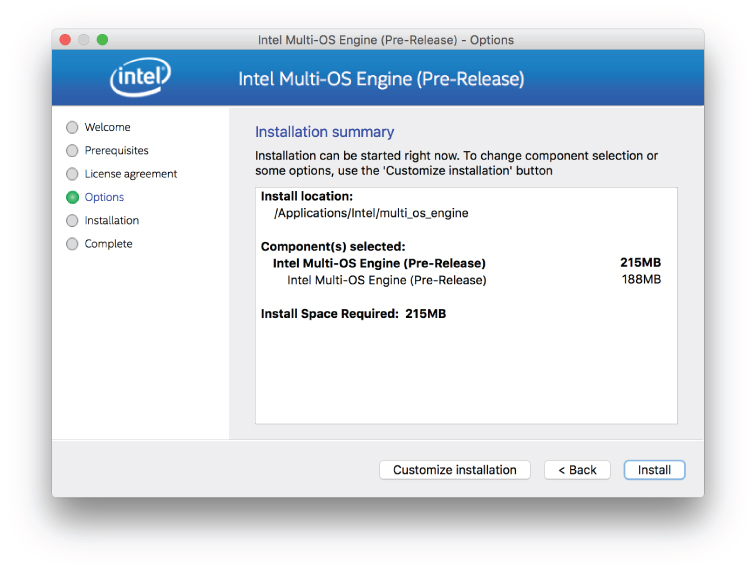
Figure 13.27 Multi-OS Engine Installation path selection
When the installation is done, the Android Studio plugin is installed so you can create new projects for both Android and iOS. If you reopen Android Studio and check the File ⇨ New menu, you will see that two new options are present, as shown in Figure 13.28.

Figure 13.28 Multi-OS Engine Android Studio menu items
When you create a new Intel Multi-OS Engine Project or Module, a new window will ask you to select the type of project or module template to create.
Intel Context Sensing SDK
The Intel Context Sensing SDK, one of the Intel INDE tools, is a free library provided by Intel for Android and Windows platforms to interact with the services and sensors on devices to create context aware applications. Intel's Context Sensing SDK can be downloaded from https://software.intel.com/en-us/context-sensing-sdk for Windows and Mac OS X.
Let's try it on Mac OS X to see how it works. If you download the Mac OS X version, you will get a file named m_cssdkandroid_1.7.2.852.dmg.
When you extract the .dmg file and run m_cssdkandroid_1.7.2.852.app, the dialogue boxes that appear ask you to install the SDK into a given directory with the traditional Intel installer interface shown in Figure 13.29.

Figure 13.29 Intel Context Sensing SDK installer
There are multiple samples and a jar file as a library in the installation directory, as shown in Figure 13.30.

Figure 13.30 Intel Context Sensing SDK installation content
Let's import PhysicalActivitySensingSample. It would be good to show how the SDK works with physical sensors. During the import, there shouldn't be any errors; however, build.gradle's compileSdkVersion may be an earlier version than your installed version, so you should change it to the version you have. compileSdkVersion imports as version 8 by default.
Now you need to import the library module to your new project. Select New Module from the File menu or right-click the project. Select Import .JAR/.AAR Package from the Create New Module window. Finally, select the jar file from the installation directory, as shown in Figure 13.31, by clicking on the icon button at the right of the file name area.

Figure 13.31 Importing the Intel Context Sensing SDK library
Next, you need to add the new library module as a dependency to the app module. (You learned how to add module dependencies in Chapter 7.) Right-click on the app module and select Open Module Settings. Finally, select the Dependency tab and define the dependency, or add the following gradle line to the module's build.gradle file:
dependencies {
    compile project(':intel-context-sensing-1.7.2.852')
}
Now you can run the application and see the five sensor buttons. First press 2) Start Daemon and then press 3) Enable Sensing to see toast messages on the screen about the context analysis, as shown in Figure 13.32.
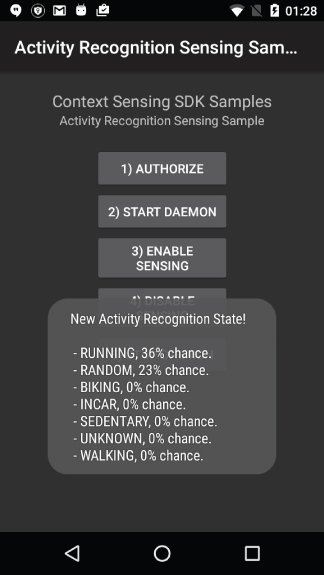
Figure 13.32 PhysicalActivitySensingSample screenshot
As you can see, the SDK gives lots of information about the state of the user's physical activity. Other sample applications can also be run that show the use cases and possible innovative solutions that you can add to your application without any further algorithm or data analysis.
QUALCOMM ANDROID SOFTWARE TOOLS
Qualcomm provides various software tools for Android application development for Snapdragon SoC, which Qualcomm claims is used on one billion Android devices. Like all other chip vendors, Qualcomm assists developers to enhance the performance and experience of Android applications, especially native ones, with supporting libraries and tools. Visit https://developer.qualcomm.com/get-started/android-development to read more about all of the tools in detail.
Snapdragon LLVM Compiler for Android
LLVM Compiler for Android is available for Linux and Windows development platforms. LLVM Compiler for Android can be downloaded at https://developer.qualcomm.com/software/snapdragon-llvm-compiler-android/tools.
For this example, we use Snapdragon LLVM Compiler on a Linux platform to build our test applications.
Extract snapdragon-llvm-3.7-compiler-linux64.tar into the toolchain folder under the Android SDK installation's ndk-bundle folder. Rename the toolchains folder llvm-snapdragonclang3.7 with the following commands:
$ tar xvf snapdragon-llvm-3.7-compiler-linux64.tar –C /path/to/androidsdk/
ndk-bundle/toolchains
$ mv llvm-Snapdragon_LLVM_for_Android_3.7 lvm-snapdragonclang3.7
As it extracts, the tar file will populate multiple folders with setup configurations, but the main build files will be contained in the llvm-Snapdragon_LLVM_for_Android_3.7/prebuilt/linux-x86_64 folders. You can also find user guide PDF files inside the folder. These provide detailed use cases and instructions.
We will demonstrate only a basic compile and run with Snapdragon LLVM compiler using a sample application named Native Plasma.
To build your application with Snapdragon LLVM compiler, you need to add toolchain = "clang" and toolchainVersion = "snapdragonclang3.7" to the android.ndk definitions in the app.gradle file, as shown in the following code:
android.ndk {
    moduleName = "native-plasma"
    toolchain = "clang"
    toolchainVersion = "snapdragonclang3.7"
    CFlags.add("-I${file("src/main/jni/native_app_glue")}".toString())
    ldLibs.addAll(["m", "log","android"])
}
Now you are ready to build the Native Plasma application and run it. You can change the compiler for your current application immediately. For further improvements and detailed optimization options for your C/C++ code, refer to the Snapdragon LLVM compiler documentation.
Qualcomm Adreno GPU SDK
The Adreno GPU is the Snapdragon SoC's graphical processor unit. Qualcomm provides the Adreno GPU SDK to make your 2D and 3D operations better. With it, game developers can take full advantage of the GPU during development to make the final application run on the GPU as efficiently and as fast as possible.
The Adreno GPU SDK can be downloaded at https://developer.qualcomm.com/software/adreno-gpu-sdk. The Adreno GPU SDK can be used on Windows, Mac OS X, and Linux platforms.
The Adreno SDK download file is large and there is no direct way to use it with Android Studio. It is a pure graphics development library for developing assets with OpenGL ES 1.0, OpenGL ES 2.0, OpenGL ES 3.0, OpenCL, and DirectX (Windows phones). All source code is implemented in C and C++.
There are plenty of documents provided with the downloaded file, in the Docs folder. You can also download the OpenGL ES Developer Guide at https://developer.qualcomm.com/software/adreno-gpu-sdk/tools.
Qualcomm FastCV Computer Vision SDK
FastCV SDK is an image-processing SDK like OpenCV but provided by Qualcomm and optimized for Qualcomm Snapdragon SoC, and it runs on ARM-based processors. Using a library like FastCV gives you the opportunity to create applications with real time image analytics and processing from a smartphone's camera, which facilitates creating augmented reality applications with text, face, and object detection and tracking options. Implementing such operations from un-optimized libraries would consume all your battery on an Android device and take too much development time to reinvent the wheel.
More information and download links can be accessed at https://developer.qualcomm.com/software/fastcv-sdk. The FastCV SDK can be used on Windows, Mac OS X, and Linux platforms.
Let's integrate and test the external SDK on Android Studio for Mac OS X. The file for Mac OS X is fastcv-installer-android-1-7-0.app. This installer works with the Java 6 Runtime. The OS will warn you about the Java version and direct you to https://support.apple.com/kb/DL1572 to help you install the required software after you click the More Info button on the warning popup.
Run the downloaded file and follow the instructions to complete the installation. The default installation path is /Users/username/Android/Development/fastcv-android-1-7-0.
When the installation is finished, the FastCV SDK, files, and libraries will be in the installation directory, as shown in Figure 13.33.

Figure 13.33 FastCV SDK directory
As you can see, there are three sample applications. Before trying to work with samples, you need to import the fastcv library header and library to Android NDK folders. If you don't import the modules to the appropriate Android NDK paths, you need to copy the files into your project folder.
Create a folder named fastcv, as shown in the following code:
$ mkdir /path/to/ndk-bundle/platforms/android-21/arch-arm/usr/include/fastcv
$ cp /Users/username/Android/Development/fastcv-android-1-7-0/inc/fastcv.h /path/
to/ndk-bundle/platforms/android-21/arch-arm/usr/include/fastcv
$ cp /Users/username/Android/Development/fastcv-android-1-7-0/lib/Android/lib32/
libfastcv.a /path/to/ndk-bundle/platforms/android-21/arch-arm/usr/libNow, import the loadjpeg sample with Android Studio.
As you've done in previous chapters, you can use the Import Project option to load the sample. Android Studio will recognize the sample project as an Eclipse project and will import it. Importing native projects from Eclipse requires further actions. Because native applications use Android.mk files, you need to convert mk files to gradle files to make Android Studio build native code.
Importing should work without any problem and create some of the required files, as shown in Figure 13.34.

Figure 13.34 FastCV demo application in Android Studio
When you import the loadjpeg application, the stable gradle plugin builds the demo application, but you need to convert gradle files so they use the gradle experimental plugin to build this complex application.
Now you can continue to convert existing gradle files to use the gradle experimental plugin by editing the project's build.gradle file and changing classpath to the latest experimental plugin, as in the following snippet. In the current Android Studio, it is the 0.6.0-beta5 version.
dependencies {
    classpath 'com.android.tools.build:gradle-experimental:0.6.0-beta5'
}
Now, you need to edit the module's gradle file to make the sample application build the native module and load the libfastcv.a library.
Your NDK module name will be loadjpeg. Building the module will create the libloadjpeg.so file as output and a copy of the file inside the apk package during apk generation. You also need to link libraries to your native library. After that's all done, the build.gradle file will be as shown in Listing 13.1.
To correctly test the application, navigate to LoadJpeg.java and write a valid path for a JPEG file in the onResume() method and a correct RGB color model configuration in the loadJPEG("jpegFilePath") method.
Finally, you need to make sure the loadjpeg sample's Android manifest file is working. Currently, there are some errors in the AndroidManifest.xml file, so we corrected them as shown in Listing 13.2.
Now you are ready to build and run the fastcv sample application. Using similar methods, you can import other samples and create your own sample project.
Snapdragon SDK for Android
Snapdragon SDK for Android is built specifically for Android. It can also be used in Java code together with its native C/C++ support.
Snapdragon SDK for Android helps you develop applications with facial processing and recognition features. With the help of Snapdragon SDK, you can analyze each camera frame for blink detection, eye gaze tracking, smile, and position of head.
To start using Snapdragon SDK for Android, download the snapdragon_sdk_2.3.1.zip file at https://developer.qualcomm.com/software/snapdragon-sdk-android. Extract the zip file to create the c_cpp, java, and testapp folders together with the release and license files.
The c_cpp folder holds the shared library .so file used in your native application. You can find documentation of the C/C++ library in the c_cpp/docs folder.
The java folder includes docs and the Java library together with sample applications. Finally, you have a test application APK in the testapp folder.
The Snapdragon SDK test application is used to test that all promised features are working as required on your target device. You can install it with following command, using adb:
$ cd /path/to/android/sdk/platform-tools/
$ ./adb start-server
$ ./adb install /path/to/SnapdragonSDK/testapp/ SnapdragonSDKTestApp.apk
This command should install the test application. Run it on your device and see if all features pass the tests. You start the Automated Test on the initial screen. The FACIAL PROCESSING API TESTS and FACIAL RECOGNITION API TESTS buttons start the tests. When we started the FACIAL RECOGNITION API TESTS, the results looked like Figure 13.35.
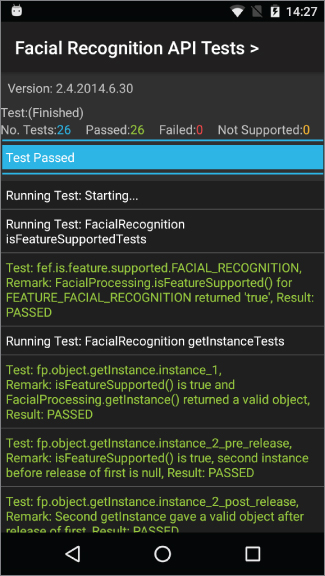
Figure 13.35 Facial Recognition API Tests
The test application makes sure that your device is capable of supporting the features it tests. If you see any failures, it means that you can't use the failed API feature in your application for the device you are testing.
For this example you start with a sample face recognition application from the samples directory and run it to see Snapdragon SDK's functions. This will be good practice for the techniques you learned in previous chapters.
First, import a project by clicking New ⇨ Import Project. Select the sample application under the SDK directory: /PathTo/SnapdragonSDK/java/samples/ samples_facial_processing/FacialRecognitionSample.
After you have imported the sample application, note that it will not build because it is not yet linked with the library. You will see errors, as shown in Figure 13.36.

Figure 13.36 Importing FacialRecognitionSample
You need to import the JAR library and its references in the JNI library.
Switch to Project view in Android Studio. Create a new libs folder in the app module and copy the sd-sdk-facial-processing.jar file to the libs folder. Then right-click the jar file and click Add As Library, as shown in Figure 13.37.

Figure 13.37 Adding a jar file as a library
After you add the jar file, Android Studio creates the gradle dependency entry, as shown in Figure 13.37. The errors have disappeared but you need a final touch to add the jar file's dependency to the so (shared object) file.
Finally, you need to add a JNI library dependency to the project. To do so, create a jniLibs folder under the src/main/ folder and copy the armeabi folder from the java/libs/libs_facial_processing folder to the jniLibs folder, as shown in Figure 13.38.

Figure 13.38 JNI library dependency for Snapdragon SDK
Now you can run the application on your device, as shown in Figure 13.39. You can capture images. and the face recognition sample application will recognize the faces and so on.
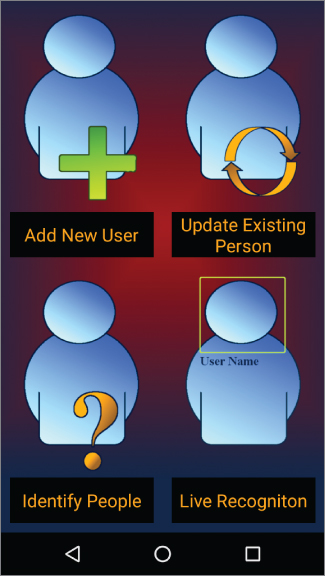
Figure 13.39 Snapdragon SDK Face Recognition sample application
Qualcomm AllPlay Click SDK
Qualcomm AllPlay is a branding for the platforms that are able to play from mobile devices. AllPlay mainly exists on speakers, TVs, and similar devices to stream audio seamlessly. For devices with AllPlay enabled, the Qualcomm AllPlay Click SDK lets you integrate your application so you can stream audio to platforms supporting AllPlay. Information about supporting platforms and more can be found at https://www.qualcomm.com/products/allplay.
In this example, you will make your Android application compatible with AllPlay devices. Go to https://www.qualcomm.com/products/allplay/developer-tools and download the SDK for Android. The allplay-click-sdk-android-v2.1.0.zip file will be downloaded. When you extract the SDK, you'll see that the Android library is already there, so there's not much to integrating the SDK with your application.
Included with the SDK is a sample demo application together with release and debug Android libraries for use in either mode, as shown in Figure 13.40.
Figure 13.40 AllPlay Click download package contents
To run the demo application, import it as you learned in previous chapters. It will be seamless because it is already an Android Studio project. After importing, you will see the project, as in Figure 13.41.

Figure 13.41 AllPlay Click demo project view
When you run the application, you see that it launches without any problem, as shown in Figure 13.42.

Figure 13.42 AllPlay Click demo application
If you have an AllPlay device at home, you can try it. Make sure you grant storage reading permission in the Android device by selecting Settings ⇨ Apps ⇨ Click SDK Demo and enabling Permissions.
Qualcomm Profilers
Qualcomm provides performance profilers together with supporting software libraries. There are two profilers you can use for your Android application: Adreno Profiler for GPU profiling and Snapdragon Profiler for CPU profiling. These profilers run best on Windows machines, but you can try to run them with Mono, an open source version of the .Net framework for Mac OS X and Linux.
Make sure the Android Debug Bridge executable is defined in the system path and is running before running profilers. First, add the path for adb.exe to the environment variables. The following steps are for Windows 10.
- Right-click on This PC and then select Properties.
- The System window will open. Click the Advanced system settings link on the left.
- The System Properties window will launch with the Advanced tab active. Click the Environment Variables button at the bottom to open the Environment Variables window.
- In the Environment Variables window, there will be two sections: One shows the User environment variables and the other shows the System environment variables. Select the Path variable from the System list and click the Edit button near the bottom of the window to open the list of Path variables, as shown in Figure 13.43.
- Click New and enter the path of adb—for example,
C:pathtoandroidsdkplatform-tools.When you are done defining the path, you will see the
adbcommand is available at the command prompt or in Power Shell. To launch adb, attach your device and run the following command:$ adb start-service

Figure 13.43 Windows system path variables list
Adreno Profiler
Adreno Profiler is used for GPU profiling of Snapdragon SoC platforms. This profiler can be downloaded at https://developer.qualcomm.com/software/adreno-gpu-profiler. Select the version you need: Windows, Max OS X, or Linux.
Snapdragon Profiler
Snapdragon Profiler is used for CPU profiling Snapdragron SoCs. For Windows, Mac OS X, and Linux platforms, the Profiler can be downloaded from https://developer.qualcomm.com/software/snapdragon-profiler. The example here uses the Windows version, snapdragonprofiler-windows-1-3.zip.
Extract snapdragonprofiler-windows-1-3.zip to the folder of your choice. Before running the SnapdragonProfilerSetup.exe file, make sure GTK# (the Windows version of Gtk) is installed. If it is not, the Snapdragon installation will direct you to the following URL to download the GTK# installer: http://download.xamarin.com/GTKforWindows/Windows/gtk-sharp-2.12.25.msi.
When you finish installing GTK#, run SnapdragonProfilerSetup.exe and complete the installation.
If you set the adb path and started the adb service, you can navigate to the Snapdragon Profiler path and run the profiler as shown in the following command.
$ cd C:Program Files (x86)QualcommSnapdragon Profiler
$ .SnapdragonProfiler.exe
If nothing happens, select File ⇨ Connect and wait for your device to be connected. It usually takes a couple of seconds and you are ready to use Snapdragon Profiler, as Figure 13.44 shows.
Figure 13.44 Snapdragon Profiler in use
NVIDIA SOFTWARE TOOLS
NVIDIA provides CodeWorks software tools for Android application developers. NVIDIA CodeWorks is available for all Windows, Mac OS X, and Ubuntu 32- and 64-bit versions. You can download CodeWorks at https://developer.nvidia.com/codeworks-android.
Click the download link to get an executable to install the required tools and libraries onto your development machine. (CodeWorksforAndroid-1R4-linux-x64.run for Ubuntu, CodeWorksforAndroid-1R4-osx.dmg or CodeWorksforAndroid-1R4.windows.exe).
You can run the Ubuntu version with the following commands:
$ chmod +x CodeWorksforAndroid-1R4-linux-x64.run
$ ./CodeWorksforAndroid-1R4-linux-x64.run
After the installer starts, select the download directory on the third screen, as shown in Figure 13.45.

Figure 13.45 NVIDIA CodeWorks path configuration
When you finish configuring the path, the component configuration window opens, as shown in Figure 13.46. Here you can select the tools and libraries to download and install on your development machine.
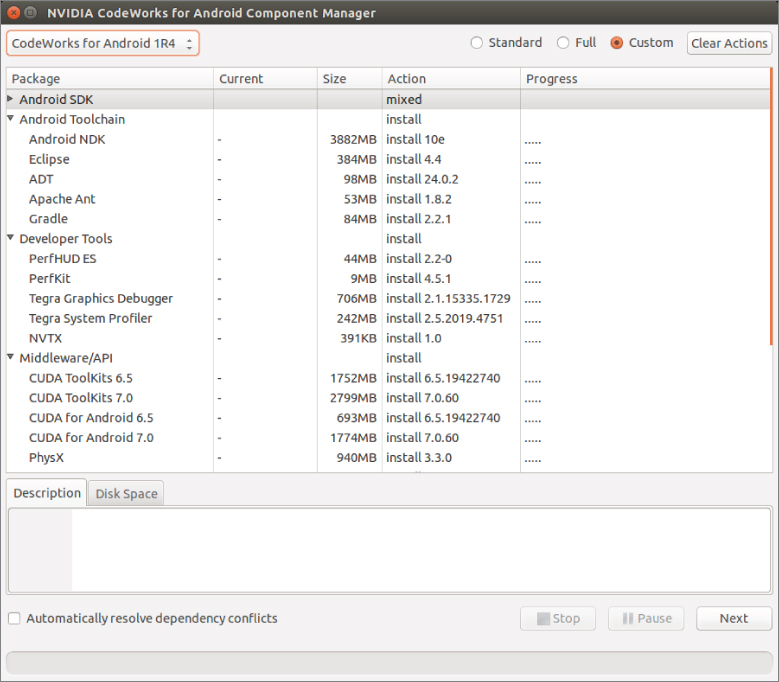
Figure 13.46 NVIDIA CodeWorks components
Under Android SDK, you can find many SDK versions to select for installation. We selected only Marshmallow because we want to cover only NVIDIA's own tools, such as PerfKit, System Profilers, CUDA, and so on.
NVIDIA's focus is mostly on the GPU side to enhance use of its Tegra GPUs with CUDA, PhysX, and OpenCV. These help you make use of the GPU for more than just its normal tasks. To test and use these libraries, you should get a device with a Tegra GPU on it.
If you are going to support NVIDA Tegra or you just want to make sure your high-end game will run best on Tegra, you can try the tools as documented.
There is no support for Android Studio yet, only Eclipse as shown in Figure 13.46. The CodeWorks installer downloads a copy of Eclipse with all installations.
NVIDIA CodeWorks provides the following tools and libraries:
- CUDA—Nvidia's famous CUDA development tools are also available for Android platforms. When installed, CUDA tools and samples will be populated in the installation directory. More information about CUDA for Android can be found at
http://docs.nvidia.com/gameworks/index.html#technologies/mobile/cuda_android_main.htm%3FTocPath%3DTechnologies%7CMobile%2520Technologies%7CCUDA%25C2%25A0for%2520Android%7C_____0. - OpenCV for Tegra—The OpenCV library is also provided with the CodeWorks installation. OpenCV libraries are optimized for Tegra GPUs; CUDA acceleration can also be used with OpenCV functions. More information about OpenCV on Tegra can be found at
http://docs.nvidia.com/gameworks/index.html#technologies/mobile/opencv_main.htm%3FTocPath%3DTechnologies%7CMobile%2520Technologies%7COpenCV%2520for%2520Tegra%7C_____0. - PhysX—PhysX is Nvidia's game physics solution for game and Android developers. It is a very complex SDK. More information about Nvidia's PhysX is available at
http://docs.nvidia.com/gameworks/index.html#gameworkslibrary/physx/physx.htm%3FTocPath%3DGameWorks%2520Library%7CPhysX%7C_____0. - NVIDIA Profilers—Like Intel and Qualcomm, NVIDA also provides its own profilers: Tegra System Profiler and PerfHUD ES (Profiling OpenGL ES code). These profilers are more useful for embedded developers and high-end game developers. Basic use cases are available at
http://docs.nvidia.com/gameworks/index.html#technologies/mobile/native_android_profiling.htm%3FTocPath%3DTechnologies%7CMobile%2520Technologies%7CNative%2520Development%2520on%2520NVIDIA%25C2%25A0Android%2520Devices%7C_____5. - NVIDIA Shield—NVIDIA Shield is a gaming platform for consumers running the Android operating system. Its main purpose is to show Tegra's performance and provide a game console. You can visit following URL to learn more about NVIDIA Shield
https://shield.nvidia.com/
Finally, we want to refer to NVIDIA's Android TV developer's site. NVIDIA wants their hardware in more Android TV devices and to increase their support of Android TV developers. The following URL provides plenty of information for Android TV developers: https://developer.nvidia.com/android-tv-developer-guide.
SUMMARY
This chapter covered some useful plugins and third-party tools and software libraries that you can use with Android Studio and SDK. We also covered supporting tools that work with Android Studio to power your development process and help you create better applications.
We started with some popular Android plugins and their external extensions. That was followed by discussion of Android SoC vendor tools and libraries, which can help you optimize your applications' power and performance. Those tools and libraries are provided by Intel, Qualcomm, and NVIDIA.