
This chapter introduces you two of the most important pieces of data in an Oracle database: redo and undo. Redo is the information Oracle records in online (and archived) redo log files in order to “replay” your transaction in the event of a failure. Undo is the information Oracle records in the undo segments in order to reverse, or roll back, your transaction.
In this chapter, we will discuss topics such as how redo and undo (rollback) are generated and how they fit into transactions. We’ll also discuss the performance implications of COMMIT and ROLLBACK statements. I will present the pseudo-code for these mechanisms in Oracle and a conceptual explanation of what actually takes place. I will not cover every internal detail of what files get updated with what bytes of data. What actually takes place is a little more involved, but having a good understanding of the flow of how it works is valuable and will help you to understand the ramifications of your actions.
Time and time again, I get questions regarding the exact bits and bytes of redo and undo. People seem to want to have a very detailed specification of exactly, precisely, what is in there. I never answer those questions. Instead, I focus on the intent of redo and undo, the concepts behind redo and undo. I focus on the use of redo and undo—not on the bits and bytes. I myself do not “dump” redo log files or undo segments. I do use the supplied tools, such as LogMiner to read redo and flashback transaction history to read undo, but that presents the information to me in a human-readable format. So, we won’t be doing internals in this chapter but rather building a strong foundation.
What Is Redo?
Redo log files are crucial to the Oracle database. These are the transaction logs for the database. Oracle maintains two types of redo log files: online and archived . They are used for recovery purposes; their main purpose in life is to be used in the event of an instance or media failure.
If the power goes off on your database machine, causing an instance failure, Oracle will use the online redo logs to restore the system to exactly the committed point it was at immediately prior to the power outage. If your disk drive fails (a media failure), Oracle will use both archived redo logs and online redo logs to recover a backup of the data that was on that drive to the correct point in time. Moreover, if you “accidentally” truncate a table or remove some critical information and commit the operation, you can restore a backup of the affected data and recover it to the point in time immediately prior to the “accident” using online and archived redo log files.
I should point out that modern versions of Oracle also have flashback technology. This allows us to perform flashback queries (query the data as of some point in time in the past), undrop a database table, put a table back the way it was some time ago, and so on. As a result, the number of occasions in which we need to perform a conventional recovery (using database backups and archived redo logs) has decreased. However, the ability to perform a recovery is the DBA’s most important job.
Note Database restore and recovery is the one thing a DBA is not allowed to get wrong.
Archived redo log files are simply copies of old, full online redo log files. As the system fills up log files, the Oracle archiver (ARCn) process makes a copy of the online redo log file in another location and optionally puts several other copies into local and remote locations as well. These archived redo log files are used to perform media recovery when a failure is caused by a disk drive going bad or some other physical fault. Oracle can take these archived redo log files and apply them to backups of the datafiles to catch them up to the rest of the database. They are the transaction history of the database.
Every Oracle database has at least two online redo log groups with at least a single member (redo log file) in each group. These online redo log groups are written to in a circular fashion by the log writer (LGWR) background process. Oracle will write to the log files in group 1, and when it gets to the end of the files in group 1, it will switch to log file group 2 and begin writing to that one. When it has filled log file group 2, it will switch back to log file group 1 (assuming you have only two redo log file groups; if you have three, Oracle would, of course, proceed to the third group).
Redo logs, or transaction logs, are one of the major features that make a database a database. They are perhaps its most important recovery structure, although without the other pieces such as undo segments, distributed transaction recovery, and so on, nothing works. They are a major component of what sets a database apart from a conventional file system. The online redo logs allow us to effectively recover from a power outage—one that might happen while Oracle’s database writer (DBWR) background process is in the middle of writing to disk. The archived redo logs let us recover from media failures when, for instance, the hard disk goes bad or human error causes data loss. Without redo logs, the database would not offer any more protection than a file system.
There’s one additional item I want to mention regarding redo. In an Oracle RAC environment, you typically have two or more instances. RAC configurations have one common set of datafiles (meaning each instance transacts against a common set of datafiles). However, each instance participating in a RAC cluster has its own memory structures and background processes (e.g., log writer and archiver). Also, each instance will have its own redo stream (or often called a thread of redo). And it follows that each instance will also have its own undo segments. This is important because you may find yourself troubleshooting performing issues with redo, and it’s critical to pinpoint which instance or instances may be having redo bottleneck issues.
What Is Undo?
Undo is conceptually the opposite of redo. Undo information is generated by the database as you make modifications to data so that the data can be put back the way it was before the modifications took place. This might be done in support of multiversioning, or in the event the transaction or statement you are executing fails for any reason, or if we request it with a ROLLBACK statement. Whereas redo is used to replay a transaction in the event of failure—to recover the transaction—undo is used to reverse the effects of a statement or set of statements. Undo, unlike redo, is stored internally in the database in a special set of segments known as undo segments.
“Rollback segment” and “undo segment” are considered synonymous terms.
It is a common misconception that undo is used to restore the database physically to the way it was before the statement or transaction executed, but this is not so. The database is logically restored to the way it was—any changes are logically undone—but the data structures, the database blocks themselves, may well be different after a rollback. The reason for this lies in the fact that, in any multiuser system, there will be tens or hundreds or thousands of concurrent transactions. One of the primary functions of a database is to mediate concurrent access to its data. The blocks that our transaction modifies are, in general, being modified by many other transactions as well. Therefore, we can’t just put a block back exactly the way it was at the start of our transaction—that could undo someone else’s work!
For example, suppose our transaction executed an INSERT statement that caused the allocation of a new extent (i.e., it caused the table to grow). Our INSERT would cause us to get a new block, format it for use, and put some data into it. At that point, some other transaction might come along and insert data into this block. If we roll back our transaction, obviously we can’t unformat and unallocate this block. Therefore, when Oracle rolls back, it is really doing the logical equivalent of the opposite of what we did in the first place. For every INSERT, Oracle will do a DELETE. For every DELETE, Oracle will do an INSERT. For every UPDATE, Oracle will do an “anti-UPDATE,” or an UPDATE that puts the row back the way it was prior to our modification.
This undo generation is not true for direct path operations, which have the ability to bypass undo generation on the table. We’ll discuss these operations in more detail shortly.
- 1.
Create an empty table.
- 2.
Full scan the table and observe the amount of I/O performed to read it.
- 3.
Fill the table with many rows (no commit).
- 4.
Roll back that work and undo it.
- 5.
Full scan the table a second time and observe the amount of I/O performed.
And now we’ll query it, with AUTOTRACE enabled in SQL*Plus to measure the I/O.
In this example, we will full scan the table twice each time. The goal is to only measure the I/O performed the second time in each case. This avoids counting additional I/Os performed by the optimizer during any parsing and optimization that may occur.
Now, that might surprise you at first—that there are zero I/Os against the table. This is due to deferred segment creation.
The deferred segment creation feature is available only with the Enterprise Edition of Oracle. This feature is enabled by default. You can override this default behavior when creating the table.
As you can see, after the table was initially created there was no allocated storage—no extents were used by this table. Upon performing an INSERT, followed immediately by ROLLBACK, we can see the INSERT allocated storage—but the ROLLBACK does not “release” it. Those two things together—that the segment was actually created by the INSERT but not “uncreated” by the ROLLBACK, and that the new formatted blocks created by the INSERT were scanned the second time around—show that a rollback is a logical “put the database back the way it was” operation. The database will not be exactly the way it was, just logically the same.
How Redo and Undo Work Together
Now let’s take a look at how redo and undo work together in various scenarios. We will discuss, for example, what happens during the processing of an INSERT with regard to redo and undo generation and how Oracle uses this information in the event of failures at various points in time.
An interesting point to note is that undo information, stored in undo tablespaces or undo segments, is protected by redo as well. In other words, undo data is treated just like table data or index data—changes to undo generates some redo, which is logged (to the log buffer and then the redo log file). Why this is so will become clear in a moment when we discuss what happens when a system crashes. Undo data is added to the undo segment and is cached in the buffer cache, just like any other piece of data would be.
Example INSERT-UPDATE-DELETE-COMMIT Scenario
What happens if the system fails at various points in the processing of these statements?
What happens if the buffer cache fills up?
What happens if we ROLLBACK at any point?
What happens if we succeed and COMMIT?
The INSERT
The initial INSERT INTO T statement will generate both redo and undo. The undo generated will be enough information to make the INSERT “go away.” The redo generated by the INSERT INTO T will be enough information to make the INSERT “happen again.”

State of the system after an INSERT
There are some cached, modified undo blocks, index blocks, and table data blocks. Each of these blocks is protected by entries in the redo log buffer.
Hypothetical Scenario: The System Crashes Right Now
In this scenario, the system crashes before a COMMIT is issued or before the redo entries are written to disk. Everything is OK. The SGA memory area is wiped out, but we don’t need anything that was in the SGA. It will be as if this transaction never happened when we restart. None of the blocks with changes got flushed to disk, and none of the redo got flushed to disk. We have no need of any of this undo or redo to recover from an instance failure.
Hypothetical Scenario: The Buffer Cache Fills Up Right Now
The situation is such that DBWn must make room and our modified blocks are to be flushed from the cache. In this case, DBWn will start by asking LGWR to flush the redo entries that protect these database blocks. Before DBWn can write any of the blocks that are changed to disk, LGWR must flush (to disk) the redo information related to these blocks. This makes sense: if we were to flush the modified blocks for table T (but not the undo blocks associated with the modifications) without flushing the redo entries associated with the undo blocks, and the system failed, we would have a modified table T block with no undo information associated with it. We need to flush the redo log buffers before writing these blocks out so that we can redo all of the changes necessary to get the SGA back into the state it is in right now, so that a rollback can take place.
This second scenario shows some of the foresight that has gone into all of this. The set of conditions described by “If we flushed table T blocks and did not flush the redo for the undo blocks and the system failed” is starting to get complex. It only gets more complex as we add users, more objects, concurrent processing, and so on.

State of the system after a redo log buffer flush
That is, we’ll have modified blocks representing uncommitted changes in the buffer cache and redo for those uncommitted changes on disk. This is a very normal scenario that happens frequently.
The UPDATE

State of the system after the UPDATE
We have more new undo segment blocks in the block buffer cache. To undo the UPDATE, if necessary, we have modified database table and index blocks in the cache. We have also generated more redo log buffer entries. Let’s assume that our redo generated from the INSERT statement (discussed in the prior section) is on disk (in the redo log file) and redo generated from the UPDATE is in cache.
Hypothetical Scenario: The System Crashes Right Now
Upon startup, Oracle would read the redo log files and find some redo log entries for our transaction. Given the state in which we left the system, we have the redo entries generated by the INSERT in the redo log files (which includes redo for undo segments associated with the INSERT). However, the redo for the UPDATE was only in the log buffer and never made it to disk (and was wiped out when the system crashed). That’s OK; the transaction was never committed, and the datafiles on disk reflect the state of the system before the UPDATE took place.
However, the redo for the INSERT was written to the redo log file. Therefore, Oracle would “roll forward” the INSERT. We would end up with a picture much like Figure 9-1, with modified undo blocks (information on how to undo the INSERT), modified table blocks (right after the INSERT), and modified index blocks (right after the INSERT). Oracle will discover that our transaction never committed and will roll it back since the system is doing crash recovery and, of course, our session is no longer connected.
To roll back the uncommitted INSERT, Oracle will use the undo it just rolled forward (from the redo and now in the buffer cache) and apply it to the data and index blocks, making them look as they did before the INSERT took place. Now everything is back the way it was. The blocks that are on disk may or may not reflect the INSERT (it depends on whether or not our blocks got flushed before the crash). If the blocks on disk do reflect the INSERT, then the INSERT will be undone when the blocks are flushed from the buffer cache. If they do not reflect the undone INSERT, so be it—they will be overwritten later anyway.
This scenario covers the rudimentary details of a crash recovery. The system performs this as a two-step process. First, it rolls forward, bringing the system right to the point of failure, and then it proceeds to roll back everything that had not yet committed. This action will resynchronize the datafiles. It replays the work that was in progress and undoes anything that has not yet completed.
Hypothetical Scenario: The Application Rolls Back the Transaction
At this point, Oracle will find the undo information for this transaction either in the cached undo segment blocks (most likely) or on disk if they have been flushed (more likely for very large transactions). It will apply the undo information to the data and index blocks in the buffer cache, or if they are no longer in the cache request, they are read from disk into the cache to have the undo applied to them. These blocks will later be flushed to the datafiles with their original row values restored.
This scenario is much more common than the system crash. It is useful to note that during the rollback process, the redo logs are never involved. The only time redo logs are read for recovery purposes is during recovery and archival. This is a key tuning concept: redo logs are written to. Oracle does not read them during normal processing. As long as you have sufficient devices so that when ARCn is reading a file, LGWR is writing to a different device, there is no contention for redo logs. Many other databases treat the log files as “transaction logs.” They do not have this separation of redo and undo. For those systems, the act of rolling back can be disastrous—the rollback process must read the logs their log writer is trying to write to. They introduce contention into the part of the system that can least stand it. Oracle’s goal is to make it so that redo logs are written sequentially, and no one ever reads them while they are being written.
The DELETE
Again, undo is generated as a result of the DELETE , blocks are modified, and redo is sent over to the redo log buffer. This is not very different from before. In fact, it is so similar to the UPDATE that we are going to move right on to the COMMIT.
The COMMIT

State of the system after a COMMIT
The modified blocks are in the buffer cache; maybe some of them have been flushed to disk. All of the redo necessary to replay this transaction is safely on disk, and the changes are now permanent. If we were to read the data directly from the datafiles, we probably would see the blocks as they existed before the transaction took place, as DBWn most likely has not yet written them. That’s OK—the redo log files can be used to bring those blocks up to date in the event of a failure. The undo information will hang around until the undo segment wraps around and reuses those blocks. Oracle will use that undo to provide for consistent reads of the affected objects for any session that needs them.
Commit and Rollback Processing
It is important to understand how redo log files might impact us as developers. We will look at how the different ways we can write our code affect redo log utilization. We’ve already seen the mechanics of redo earlier in the chapter, and now we’ll look at some specific issues. You might detect many of these scenarios, but they would be fixed by the DBA as they affect the database instance as a whole. We’ll start with what happens during a COMMIT and then get into commonly asked questions and issues surrounding the online redo logs.
What Does a COMMIT Do?
As a developer, you should have a good understanding of exactly what goes on during a COMMIT. In this section, we’ll investigate what happens during the processing of the COMMIT statement in Oracle. A COMMIT is generally a very fast operation, regardless of the transaction size. You might think that the bigger a transaction (in other words, the more data it affects), the longer a COMMIT would take. This is not true. The response time of a COMMIT is generally “flat,” regardless of the transaction size. This is because a COMMIT does not really have too much work to do, but what it does do is vital.
Once just to warm up the routine (make sure all of the classes are loaded)
A second time, with SQL Tracing on, specifying the number of rows to INSERT along with how many rows to commit at a time (i.e., commit every N rows)
The SCOTT account or whatever account you use to test this with will need to have the EXECUTE privilege granted on the DBMS_MONITOR package.
See the Oracle Database JDBC Developer’s Guide for further details on how to connect to an Oracle database with Java.
Results from Inserting 100,000 Rows
Number of Rows to Insert | Commit Every N Rows, N= | CPU for Insert Statement (Seconds) | Wait Time for Log File Sync (Seconds) |
|---|---|---|---|
100,000 | 1 | 1.42 | 34.87 |
100,000 | 10 | 1.35 | 4.05 |
100,000 | 100 | 1.63 | 0.61 |
100,000 | 1000 | 1.65 | 0.21 |
100,000 | 10,000 | 1.66 | 0.04 |
100,000 | 100,000 | 1.65 | 0.00 |
As you can see, the more often you commit, the longer you wait (your mileage will vary on this). And the amount of time you wait is more or less directly proportional to the number of times you commit. Remember, this is just a single-user scenario; with multiple users doing the same work, all committing too frequently, the numbers will go up rapidly.
We’ve heard the same story, time and time again, with similar situations. For example, we’ve seen how not using bind variables and performing hard parses often severely reduces concurrency due to library cache contention and excessive CPU utilization. Even when we switch to using bind variables, soft parsing too frequently—caused by closing cursors even though we are going to reuse them shortly—incurs massive overhead. We must perform operations only when we need to—a COMMIT is just another such operation. It is best to size our transactions based on business need, not based on misguided attempts to lessen resource usage on the database.
We’ve obviously increased the round trips to and from the database. If we commit every record, we are generating that much more traffic back and forth. I didn’t even measure that, which would add to the overall runtime.
Every time we commit, we must wait for our redo to be written to disk. This will result in a “wait.” In this case, the wait is named “log file sync.”
So, we committed after every INSERT; we waited every time for a short period of time—and if you wait a little bit of time but you wait often, it all adds up. Fully 30 seconds of our runtime was spent waiting for a COMMIT to complete when we committed 100,000 times—in other words, waiting for LGWR to write the redo to disk. In stark contrast, when we committed once, we didn’t wait very long (not a measurable amount of time actually). This proves that a COMMIT is a fast operation; we expect the response time to be more or less flat, not a function of the amount of work we’ve done.
Undo blocks have been generated in the SGA.
Modified data blocks have been generated in the SGA.
Buffered redo for the preceding two items has been generated in the SGA.
Depending on the size of the preceding three items and the amount of time spent, some combination of the previous data may be flushed onto disk already.
All locks have been acquired.
A System Change Number (SCN) is generated for our transaction. In case you are not familiar with it, the SCN is a simple timing mechanism Oracle uses to guarantee the ordering of transactions and to enable recovery from failure. It is also used to guarantee read consistency and checkpointing in the database. Think of the SCN as a ticker; every time someone COMMITs, the SCN is incremented by one.
LGWR writes all of our remaining buffered redo log entries to disk and records the SCN in the online redo log files as well. This step is actually the COMMIT. If this step occurs, we have committed. Our transaction entry is “removed” from V$TRANSACTION—this shows that we have committed.
All locks recorded in V$LOCK held by our session are released, and everyone who was enqueued waiting on locks we held will be woken up and allowed to proceed with their work.
Some of the blocks our transaction modified will be visited and “cleaned out” in a fast mode if they are still in the buffer cache. Block cleanout refers to the lock-related information we store in the database block header. Basically, we are cleaning out our transaction information on the block, so the next person who visits the block won’t have to. We are doing this in a way that need not generate redo log information, saving considerable work later (this is discussed fully later in this chapter).
As you can see, there is very little to do to process a COMMIT. The lengthiest operation is, and always will be, the activity performed by LGWR, as this is physical disk I/O. The amount of time spent by LGWR here will be greatly reduced by the fact that it has already been flushing the contents of the redo log buffer on a recurring basis. LGWR will not buffer all of the work you do for as long as you do it. Rather, it will incrementally flush the contents of the redo log buffer in the background as you are going along. This is to avoid having a COMMIT wait for a very long time in order to flush all of your redo at once.
So, even if we have a long-running transaction, much of the buffered redo log it generates would have been flushed to disk, prior to committing. On the flip side is the fact that when we COMMIT, we must typically wait until all buffered redo that has not been written yet is safely on disk. That is, our call to LGWR is by default a synchronous one. While LGWR may use asynchronous I/O to write in parallel to our log files, our transaction will normally wait for LGWR to complete all writes and receive confirmation that the data exists on disk before returning.
Oracle 11g and above have an asynchronous wait. However, that style of commit has limited general-purpose use. Commits in any end user–facing application should be synchronous.
Now, earlier I mentioned that we were using a Java program and not PL/SQL for a reason—and that reason is a PL/SQL commit-time optimization. I said that our call to LGWR is by default a synchronous one and that we wait for it to complete its write. That is true in every version of the Oracle database for every programmatic language except PL/SQL. The PL/SQL engine, realizing that the client does not know whether or not a COMMIT has happened in the PL/SQL routine until the PL/SQL routine is completed, does an asynchronous commit. It does not wait for LGWR to complete; rather, it returns from the COMMIT call immediately. However, when the PL/SQL routine is completed, when we return from the database to the client, the PL/SQL routine will wait for LGWR to complete any of the outstanding COMMITs. So, if you commit 100 times in PL/SQL and then return to the client, you will likely find you waited for LGWR once—not 100 times—due to this optimization. Does this imply that committing frequently in PL/SQL is a good or OK idea? No, not at all—just that it is not as bad an idea as it is in other languages. The guiding rule is to commit when your logical unit of work is complete—not before.
This commit-time optimization in PL/SQL may be suspended when you are performing distributed transactions or Data Guard in maximum availability mode. Since there are two participants, PL/SQL must wait for the commit to actually be complete before continuing. Also, it can be suspended by directly invoking COMMIT WORK WRITE WAIT in PL/SQL.
The owner of the previous function will need to have been directly granted the SELECT privilege on the V$ views V_$STATNAME and V_$MYSTAT.
Directions on how to create and populate the BIG_TABLE table used in many examples are in the “Setting Up Your Environment” section at the very front of this book.
Times are in hundredths of seconds. Your results may vary depending on variables such as the number of records in BIG_TABLE, size of your log buffer, size and number of redo logs, number of log writer processes, and I/O subsystem.
As you can see, as we generate varying amount of redo from about 6500 bytes to 67MB, the difference in time to COMMIT is not measurable using a timer with a one-hundredth of a second resolution. As we were processing and generating the redo log, LGWR was constantly flushing our buffered redo information to disk in the background. So, when we generated 67MB of redo log information, LGWR was busy flushing every 1MB, or so. When it came to the COMMIT, there wasn’t much left to do—not much more than when we created ten rows of data. You should expect to see similar (but not exactly the same) results, regardless of the amount of redo generated.
What Does a ROLLBACK Do?
Undo segment records have been generated in the SGA.
Modified data blocks have been generated in the SGA.
A buffered redo log for the preceding two items has been generated in the SGA.
Depending on the size of the preceding three items and the amount of time spent, some combination of the previous data may be flushed onto disk already.
All locks have been acquired.
We undo all of the changes made. This is accomplished by reading the data back from the undo segment and, in effect, reversing our operation and then marking the undo entry as applied. If we inserted a row, a ROLLBACK will delete it. If we updated a row, a rollback will reverse the update. If we deleted a row, a rollback will reinsert it again.
All locks held by our session are released, and everyone who was enqueued waiting on locks we held will be released.
A COMMIT, on the other hand, just flushes any remaining data in the redo log buffers. It does very little work compared to a ROLLBACK. The point here is that you don’t want to roll back unless you have to. It is expensive since you spend a lot of time doing the work, and you’ll also spend a lot of time undoing the work. Don’t do work unless you’re sure you are going to want to COMMIT it. This sounds like common sense—of course I wouldn’t do all of the work unless I wanted to COMMIT it. However, I’ve often seen a developer use a “real” table as a temporary table, fill it up with data, report on it, and then roll back to get rid of the temporary data. Later, we’ll talk about true temporary tables and how to avoid this issue.
Investigating Redo
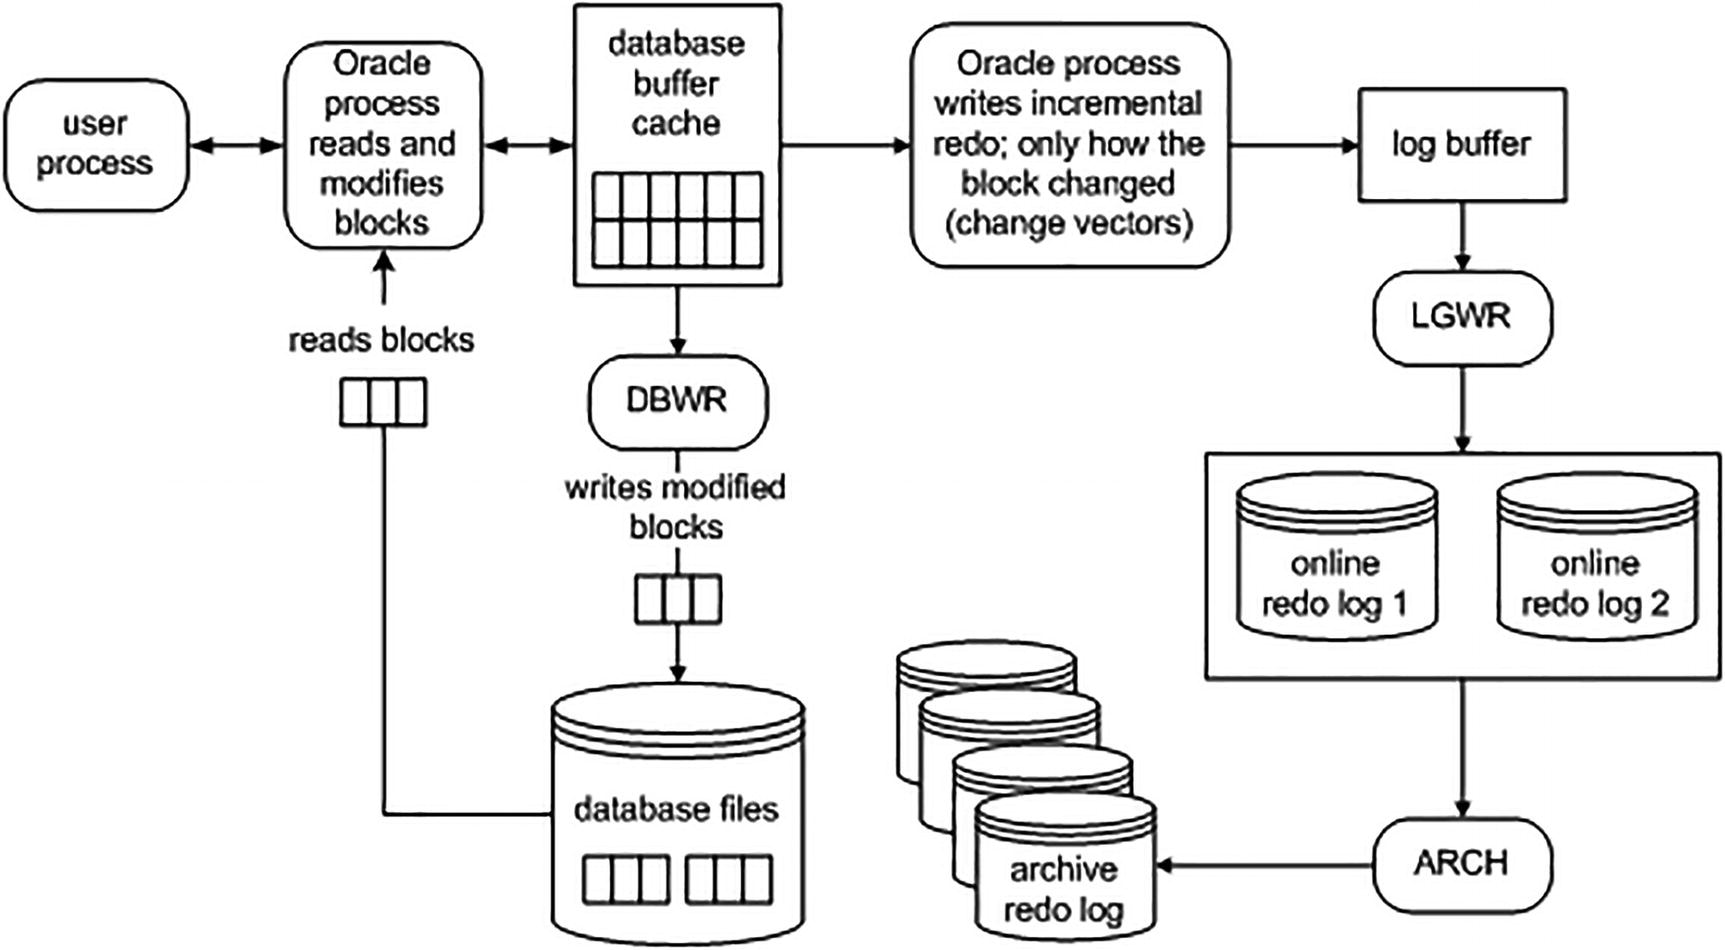
Oracle transacting data and writing redo
Redo management can be a point of serialization (bottleneck) within the database. This is because eventually all transactions end up at LGWR (or one of its worker processes) asking it to manage their redo and COMMIT their transaction. The amount of redo generated also influences how much work the archiver process has to process. If you have a standby database, this redo has to also be transferred and applied to the standby. The more log writer and the archiver have to do, the slower the system will be.
Therefore, as a developer, it’s important to be able to measure how much redo your operations generate. The more redo you generate, the longer your operations may take, and the slower the entire system might be. You are not just affecting your session, but every session. By seeing how much redo an operation tends to generate, and testing more than one approach to a problem, you can find the best way to do things.
Oracle will always start at least one LGWR background process. On multiprocessor systems, Oracle will spawn additional log writer worker processes (LG00) to help improve performance of writing redo to disk.
Measuring Redo
In this first example, we’ll use AUTOTRACE to observe the amount of redo generated. In subsequent examples, we’ll use the GET_STAT_VAL function (introduced earlier in this chapter).
You will not see the exact same results when you run these examples in your environment. Your results may vary depending on variables such as the number of records in BIG_TABLE, memory configuration, CPUs, and other processes running on your system.
As you can see, that INSERT generated about 113MB of redo.
The example in this section was performed on a NOARCHIVELOG mode database. If you are in ARCHIVELOG mode, the table would have to be created or set as NOLOGGING to observe this dramatic change. We will investigate the NOLOGGING attribute in more detail shortly in the section “Setting NOLOGGING in SQL.” Please make sure to coordinate all nonlogged operations with your DBA on a “real” system.
That INSERT generated only about 220KB—kilobytes, not megabytes—of redo. As you can see, the amount of redo generated by a direct path insert is much less than a conventional insert.
Can I Turn Off Redo Log Generation?
This question is often asked. The simple short answer is no, since redo logging is crucial for the database; it is not overhead and it is not a waste. You do need it, regardless of whether you believe you do or not. It is a fact of life, and it is the way the database works. If you turned off redo, then any temporary failure of disk drives, power, or a software crash would render the entire database unusable and unrecoverable. That said, however, there are some operations that can be done without generating redo log in some cases.
Oracle allows you to place your database into FORCE LOGGING mode. In that case, all operations are logged regardless if you specify NOLOGGING. The query SELECT FORCE_LOGGING FROM V$DATABASE will display if logging forced or not. This feature is in support of Data Guard, a disaster recovery feature of Oracle that relies on redo to maintain a standby database copy.
Setting NOLOGGING in SQL
This time, we generated only 90KB of redo. As you can see, this makes a tremendous difference—4MB of redo vs. 90KB. The 4MB written in the first example is a copy of the actual table data itself; it was written to the redo log when the table was created without the NOLOGGING clause.
If you test this on a NOARCHIVELOG mode database, you will not see any differences between the two. The CREATE TABLE will not be logged, with the exception of the data dictionary modifications, in a NOARCHIVELOG mode database. Additionally, if you run this test in a database that has force logging enabled, you will always get redo logged, regardless of the NOLOGGING clause.
These facts point out a valuable tip: test your system in the mode it will be run in production, as the behavior may be different. Your production system will be running in ARCHIVELOG mode; if you perform lots of operations that generate redo in this mode, but not in NOARCHIVELOG mode, you’ll want to discover this during testing, not during rollout to the users!
Of course, it is now obvious that you will do everything you can with NOLOGGING, right? In fact, the answer is a resounding no. You must use this mode very carefully and only after discussing the issues with the person in charge of backup and recovery. Let’s say you create this table and it is now part of your application (e.g., you used a CREATE TABLE AS SELECT NOLOGGING as part of an upgrade script). Your users modify this table over the course of the day. That night, the disk that the table is on fails. “No problem,” the DBA says. “We are running in ARCHIVELOG mode and we can perform media recovery.” The problem is, however, that the initially created table, since it was not logged, is not recoverable from the archived redo log. This table is unrecoverable and this brings out the most important point about NOLOGGING operations: they must be coordinated with your DBA and the system as a whole. If you use them and others are not aware of that fact, you may compromise the ability of your DBA to recover your database fully after a media failure. NOLOGGING operations must be used judiciously and carefully.
Some amount of redo will be generated, as a matter of fact. This redo is to protect the data dictionary. There is no avoiding this at all. It could be of a significantly lesser amount than before, but there will be some.
NOLOGGING does not prevent redo from being generated by all subsequent operations. In the preceding example, I did not create a table that is never logged. Only the single, individual operation of creating the table was not logged. All subsequent “normal” operations such as INSERTs, UPDATEs, DELETEs, and MERGEs will be logged. Other special operations, such as a direct path load using SQL*Loader or a direct path INSERT using the INSERT /*+ APPEND */ syntax, will not be logged (unless and until you ALTER the table and enable full logging again). In general, however, the operations your application performs against this table will be logged.
After performing NOLOGGING operations in an ARCHIVELOG mode database, you must take a new baseline backup of the affected datafiles as soon as possible, in order to avoid losing the data created by the NOLOGGING operation due to media failure. Since the data created by the NOLOGGING operation is not in the redo log files, and is not yet in the backups, you have no way of recovering it!
Setting NOLOGGING on an Index
Again, this example was performed in an ARCHIVELOG mode database. You would not see the differences in redo size in a NOARCHIVELOG mode database as the index CREATE and REBUILD operations are not logged in NOARCHIVELOG mode.
And now it generates a mere 39KB of redo. But that index is “unprotected” now. If the datafiles it was located in failed and had to be restored from a backup, we would lose that index data. Understanding that fact is crucial. The index is not recoverable right now—we need a backup to take place. Alternatively, the DBA could just re-create the index as we can re-create the index directly from the table data as well.
NOLOGGING Wrap-Up
Index creations and ALTERs (rebuilds).
Bulk INSERTs into a table using a direct path INSERT such as that available via the /*+ APPEND */ hint or SQL*Loader direct path loads. The table data will not generate redo, but all index modifications will (the indexes on this nonlogged table will generate redo).
LOB operations (updates to large objects do not have to be logged).
Table creations via CREATE TABLE AS SELECT.
Various ALTER TABLE operations such as MOVE and SPLIT.
Used appropriately on an ARCHIVELOG mode database, NOLOGGING can speed up many operations by dramatically reducing the amount of redo log generated. Suppose you have a table you need to move from one tablespace to another. You can schedule this operation to take place immediately before a backup occurs—you would ALTER the table to be NOLOGGING, move it, rebuild the indexes (without logging as well), and then ALTER the table back to logging mode. Now, an operation that might have taken X hours can happen in X/2 hours perhaps (I’m not promising a 50 percent reduction in runtime!). The appropriate use of this feature includes involving the DBA, or whoever is responsible for database backup and recovery or any standby databases. If that person is not aware that you’re using this feature and a media failure occurs, you may lose data, or the integrity of the standby database might be compromised. This is something to seriously consider.
Why Can’t I Allocate a New Log?
It might say Archival required instead of Checkpoint not complete, but the effect is pretty much the same. This is really something the DBA should be looking out for. This message will be written to alert.log on the server whenever the database attempts to reuse an online redo log file and finds that it can’t. This happens when DBWn has not yet finished checkpointing the data protected by the redo log or ARCn has not finished copying the redo log file to the archive destination. At this point, the database effectively halts as far as the end user is concerned. It stops cold. DBWn or ARCn will be given priority to flush the blocks to disk. Upon completion of the checkpoint or archival, everything goes back to normal. The reason the database suspends user activity is that there is simply no place to record the changes the users are making. Oracle is attempting to reuse an online redo log file, but because either the file would be needed to recover the database in the event of a failure (Checkpoint not complete), or the archiver has not yet finished copying it (Archival required), Oracle must wait (and the end users will wait) until the redo log file can safely be reused.
If you see that your sessions spend a lot of time waiting on a “log file switch,” “log buffer space,” or “log file switch checkpoint or archival incomplete,” you are most likely hitting this. You will notice it during prolonged periods of database modifications if your log files are sized incorrectly or because DBWn and ARCn need to be tuned by the DBA or system administrator. I frequently see this issue with the “starter” database that has not been customized. The “starter” database typically sizes the redo logs far too small for any significant amount of work (including the initial database build of the data dictionary itself). As soon as you start loading up the database, you will notice that the first 1000 rows go fast, and then things start going in spurts: 1000 go fast, then hang, then go fast, then hang, and so on. These are the indications you are hitting this condition.
Make DBWn faster: Have your DBA tune DBWn by enabling ASYNC I/O, using DBWn I/O slaves, or using multiple DBWn processes . Look at the I/O on the system and see if one disk or a set of disks is “hot” and you need to therefore spread the data out. The same general advice applies for ARCn as well. The pros of this are that you get “something for nothing” here—increased performance without really changing any logic/structures/code. There really are no downsides to this approach.
Add more redo log files: This will postpone the Checkpoint not complete in some cases, and, after a while, it will postpone the Checkpoint not complete so long that it perhaps doesn’t happen (because you gave DBWn enough breathing room to checkpoint). The same applies to the Archival required message. The benefit of this approach is the removal of the “pauses” in your system. The downside is it consumes more disk, but the benefit far outweighs any downside here.
Re-create the log files with a larger size: This will extend the amount of time between the time you fill the online redo log and the time you need to reuse it. The same applies to the Archival required message, if the redo log file usage is “bursty.” If you have a period of massive log generation (nightly loads, batch processes) followed by periods of relative calm, then having larger online redo logs can buy enough time for ARCn to catch up during the calm periods. The pros and cons are identical to the preceding approach of adding more files. Additionally, it may postpone a checkpoint from happening until later, since checkpoints happen at each log switch (at least), and the log switches will now be further apart.
Make checkpointing happen more frequently and more continuously: Use a smaller block buffer cache (not entirely desirable) or various parameter settings such as FAST_START_MTTR_TARGET, LOG_CHECKPOINT_INTERVAL, and LOG_CHECKPOINT_TIMEOUT. This will force DBWn to flush dirty blocks more frequently. The benefit to this approach is that recovery time from a failure is reduced. There will always be less work in the online redo logs to be applied. The downside is that blocks may be written to disk more frequently if they are modified often. The buffer cache will not be as effective as it could be, and it can defeat the block cleanout mechanism discussed in the next section.
The approach you take will depend on your circumstances. This is something that must be fixed at the database level, taking the entire instance into consideration.
Block Cleanout
In this section, we’ll discuss block cleanouts, or the removal of “locking”-related information on the database blocks we’ve modified. This concept is important to understand when we talk about the infamous ORA-01555: snapshot too old error in a subsequent section.
If you recall from Chapter 6 we talked about data locks and how they are managed. I described how they are actually attributes of the data, stored on the block header. A side effect of this is that the next time that block is accessed, we may have to clean it out—in other words, remove the transaction information. This action generates redo and causes the block to become dirty if it wasn’t already, meaning that a simple SELECT may generate redo and may cause lots of blocks to be written to disk with the next checkpoint. Under most normal circumstances, however, this will not happen. If you have mostly small- to medium-sized transactions (OLTP), or you have a data warehouse that performs direct path loads or uses DBMS_STATS to analyze tables after load operations, you’ll find the blocks are generally cleaned for you. If you recall from the earlier section in this chapter, “What Does a COMMIT Do?”, one of the steps of COMMIT-time processing is to revisit some blocks if they are still in the SGA and if they are accessible (no one else is modifying them), and then clean them out. This activity is known as a commit cleanout and is the activity that cleans out the transaction information on our modified block. Optimally, our COMMIT can clean out the blocks so that a subsequent SELECT (read) will not have to clean it out. Only an UPDATE of this block would truly clean out our residual transaction information, and since the UPDATE is already generating redo, the cleanout is not noticeable.
We can force a cleanout to not happen, and therefore observe its side effects, by understanding how the commit cleanout works. In a commit list associated with our transaction, Oracle will record lists of blocks we have modified. Each of these lists is 20 blocks long, and Oracle will allocate as many of these lists as it needs—up to a point. If the sum of the blocks we modify exceeds 10 percent of the block buffer cache size, Oracle will stop allocating new lists. For example, if our buffer cache is set to cache 3000 blocks, Oracle will maintain a list of up to 300 blocks (10 percent of 3000). Upon COMMIT, Oracle will process each of these lists of 20 block pointers, and if the block is still available, it will perform a fast cleanout. So, as long as the number of blocks we modify does not exceed 10 percent of the number of blocks in the cache and our blocks are still in the cache and available to us, Oracle will clean them out upon COMMIT. Otherwise, it just skips them (i.e., does not clean them out).
With this understanding, we can set up artificial conditions to see how the cleanout works. I set my DB_CACHE_SIZE to a low value of 16MB, which is sufficient to hold 2048 8KB blocks (my block size is 8KB). Next, I create a table such that a row fits on exactly one block—I’ll never have two rows per block. Then I fill this table up with 10,000 rows and COMMIT. We know that 10,000 blocks far exceed 10 percent of 2048, so the database will not be able to clean out all of these dirty blocks upon commit—most of them will not even be in the buffer cache anymore. I’ll measure the amount of redo I’ve generated so far, run a SELECT that will visit each block, and then measure the amount of redo that SELECT generated.
In order for this example to be reproducible and predictable, you’ll need to disable SGA automatic memory management. If that is enabled, there is a chance that the database will increase the size of your buffer cache—defeating the “math” I’ve worked out.
I see that no redo is generated—the blocks are all clean.
If we were to rerun the preceding example with the buffer cache set to hold a little more than 100,000 blocks, we’d find that we generate little to no redo on any of the SELECTs—we will not have to clean dirty blocks during either of our SELECT statements. This is because the10,000-plus (remember the index was modified as well) blocks we modified fit comfortably into ten percent of our buffer cache, and we are the only users. There is no one else mucking around with the data, and no one else is causing our data to be flushed to disk or accessing those blocks. In a live system, it would be normal for at least some of the blocks to not be cleaned out sometimes.
This behavior will most affect you after a large INSERT (as just demonstrated), UPDATE, or DELETE—one that affects many blocks in the database (anything more than ten percent of the size of the cache will definitely do it). You’ll notice that the first query to touch the block after this will generate a little redo and dirty the block, possibly causing it to be rewritten if DBWn had already flushed it or the instance had been shut down, clearing out the buffer cache altogether. There is not too much you can do about it. It is normal and to be expected. If Oracle didn’t do this deferred cleanout of a block, a COMMIT could take as long to process as the transaction itself. The COMMIT would have to revisit each and every block, possibly reading them in from disk again (they could have been flushed).
If you are not aware of block cleanouts and how they work, they will be one of those mysterious things that just seem to happen for no reason. For example, say you UPDATE a lot of data and COMMIT. Now you run a query against that data to verify the results. The query appears to generate tons of write I/O and redo. It seems impossible if you are unaware of block cleanouts; it was to me the first time I saw it. You go and get someone to observe this behavior with you, but it is not reproducible as the blocks are now “clean” on the second query. You simply write it off as one of those database mysteries—a mystery that only happens when you are alone.
Bulk-loading lots of new data into the data warehouse
Running UPDATEs on all of the data you just loaded (producing blocks that need to be cleaned out)
Letting people query the data
You have to realize that the first query to touch the data will incur some additional processing if the block needs to be cleaned. Realizing this, you yourself should “touch” the data after the UPDATE. You just loaded or modified a ton of data—you need to analyze it at the very least. Perhaps you need to run some reports to validate the load. This will clean the block out and make it so the next query doesn’t have to. Better yet, since you just bulk-loaded the data, you now need to refresh the statistics anyway. Running the DBMS_STATS utility to gather statistics may well clean out all of the blocks as it just uses SQL to query the information and would naturally clean the blocks out as it goes along.
Log Contention
This, like the cannot allocate new log message, is something the DBA must fix, typically in conjunction with the system administrator. However, it is something a developer might detect as well if the DBA isn’t watching closely enough.
Putting redo on a slow device: The disks are just performing poorly. It is time to buy faster disks.
Putting redo on the same device as other files that are accessed frequently: Redo is designed to be written with sequential writes and to be on dedicated devices. If other components of your system—even other Oracle components—are attempting to read and write to this device at the same time as LGWR, you will experience some degree of contention. Here, you want to ensure LGWR has exclusive access to these devices if at all possible.
Mounting the log devices in a buffered manner: Here, you are using a “cooked” file system (not RAW disks). The operating system is buffering the data, and the database is also buffering the data (redo log buffer). Double buffering slows things down. If possible, mount the devices in a “direct” fashion. How to do this varies by operating system and device, but it is usually possible.
Putting redo on a slow technology, such as RAID-5: RAID-5 is great for reads, but it is generally terrible for writes. As we saw earlier regarding what happens during a COMMIT, we must wait for LGWR to ensure the data is on disk. Using any technology that slows this down is not a good idea.
Redo log group 1: Disks 1 and 3
Redo log group 2: Disks 2 and 4
Archive: Disk 5 and optionally disk 6 (the big disks)

Optimal redo log configuration
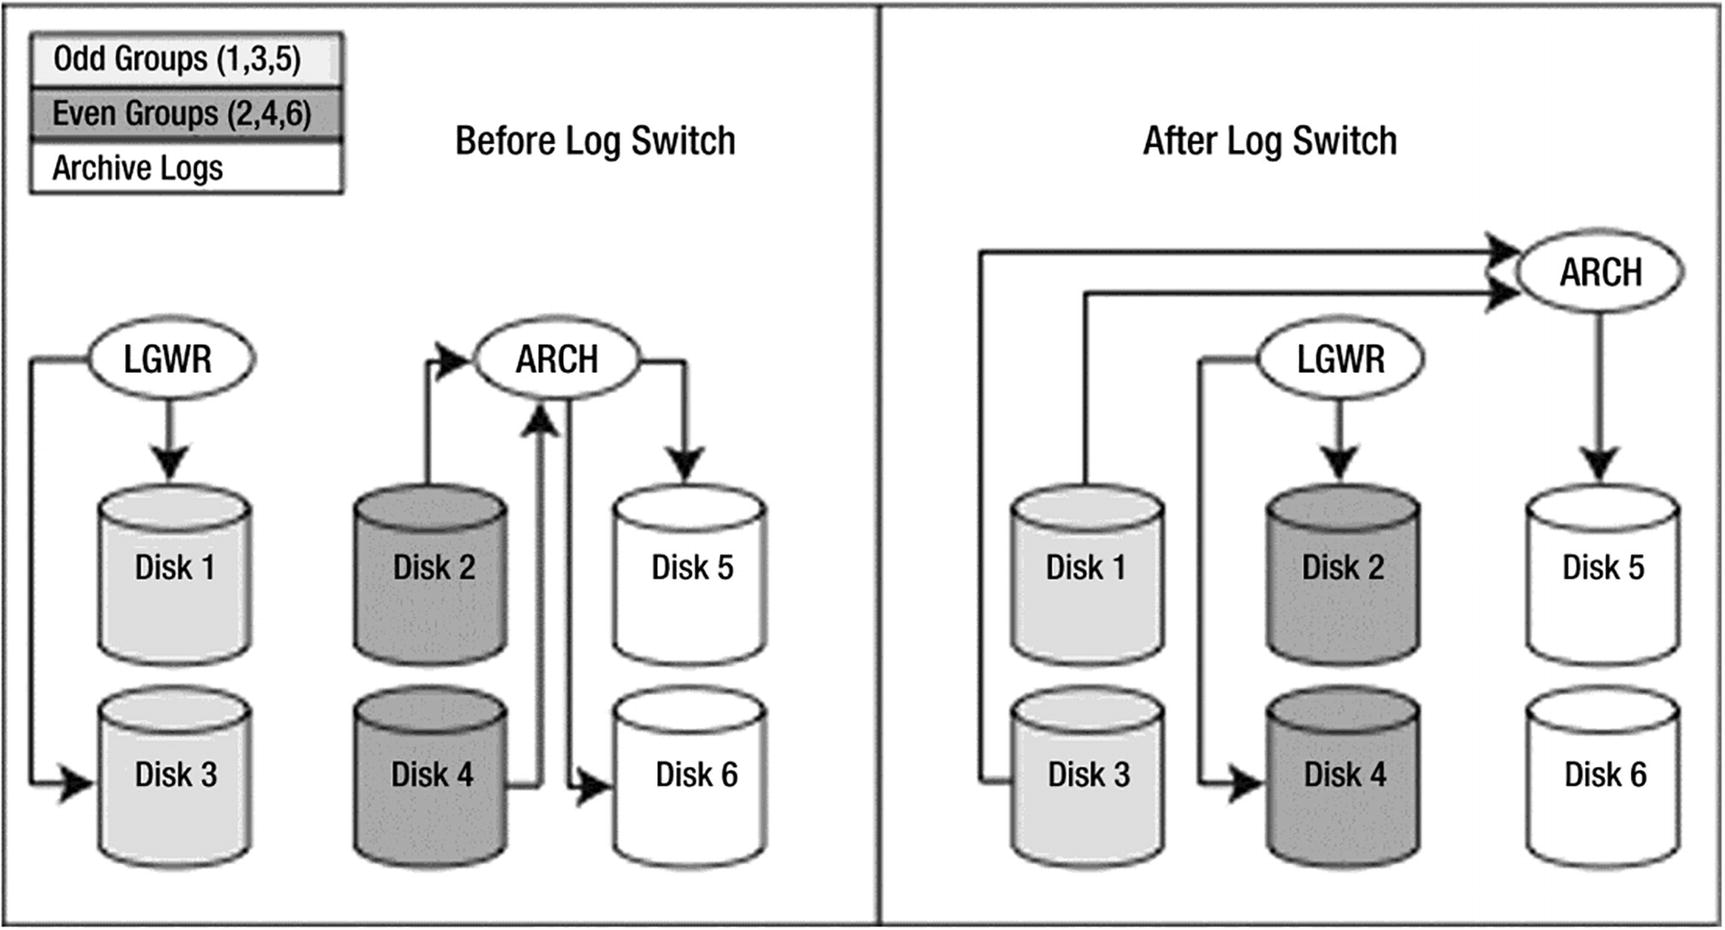
Redo log flow
So, when LGWR is writing group 1, ARCn is reading group 2 and writing to the archive disks. When LGWR is writing group 2, ARCn is reading group 1 and writing to the archive disks. In this fashion, LGWR and ARCn each have their own dedicated devices and will not be contending with anyone, not even each other.
Temporary Tables and Redo
Oracle comes with two types of temporary tables: global and private. Global temporary tables have been a feature within Oracle for a long time. Global temporary tables are permanent database objects that persist on disk and are visible to all sessions. They are named temporary tables because the data within them only persists for the duration of the transaction or session.
Starting with Oracle 18c, you can create a private temporary table. Unlike a global temporary table, a private temporary table exists only in memory and is only visible to the session that created it. You can define a private temporary table to persist per transaction or session duration, after which the temporary table is automatically dropped.
If you’ve worked with other database technologies such as SQL Server or MySQL, a private temporary table aligns more with what you’ve used in those environments.
Even though global temporary tables have been around for a while, there is still some confusion surrounding them, in particular in the area of logging. In this section, we’ll also explore the question “How do temporary tables work with respect to logging of changes?”
Global Temporary Tables
You can instruct Oracle to store the undo for a temporary table in a temporary tablespace via the TEMP_UNDO_ENABLED parameter. When blocks are modified in a temporary tablespace, no redo is generated. Therefore, when TEMP_UNDO_ENABLED is set to TRUE, any DML issued against a temporary table will generate little or no redo.
By default, TEMP_UNDO_ENABLED is set to FALSE.
The INSERT into the “real” table generated a lot of redo, while almost no redo was generated for the temporary table. This makes sense—there is very little undo data generated for INSERTs, and only undo data is logged for temporary tables.
The UPDATE of the real table generated about twice the amount of redo as the temporary table. Again, this makes sense. About half of that UPDATE, the “before image,” had to be saved. The “after image” (redo) for the temporary table did not have to be saved.
The DELETEs each took about the same amount of redo space. This makes sense, because the undo for a DELETE is big, but the redo for the modified blocks is very small. Hence, a DELETE against a temporary table takes place very much in the same fashion as a DELETE against a permanent table.
An INSERT will generate little to no undo/redo activity.
An UPDATE will generate about half the redo as with a permanent table.
A DELETE will generate the same amount of redo as with a permanent table.
The results are dramatic: a trivial amount of redo is generated by the INSERT, UPDATE, and DELETE statements in a temporary table. For environments where you perform large batch operations that transact against temporary tables, you can expect to see a significant reduction in the amount of redo generated.
You may be wondering why there were 376 bytes of redo generated in the prior example’s output. As processes consume space within the database, Oracle does some internal housekeeping. These changes are recorded in the data dictionary, which in turn generates some redo and undo.
There’s no need to set TEMP_UNDO_ENABLED in the standby database. This is because temporary undo is always enabled in an Oracle Active Data Guard standby database.
Global temporary tables are often used for reporting purposes—like generating and storing intermediate query results. Oracle Active Data Guard is often used to offload reporting applications to the standby database. Couple global temporary tables with Oracle Active Data Guard, and you have a more powerful tool to address your reporting requirements.
Private Temporary Tables
The bottom line is that when you use either global temporary tables or private temporary tables, if you want to minimize undo generation, set TEMP_UNDO_ENABLED to TRUE.
Investigating Undo
Roll back transactions via the ROLLBACK statement
Enable read consistency
Recover the database
Analyze data as of a prior point in time using Oracle Flashback Query
Recover from logical corruptions using Oracle Flashback features
We’ve already discussed several of the prior undo segment topics. We’ve seen how they are used during recovery, how they interact with the redo logs, and how they are used for consistent reads and nonblocking reads of data. In this section, we’ll look at the most frequently raised issues with undo segments.
The bulk of our time will be spent on the infamous ORA-01555: snapshot too old error, as this single issue causes more confusion than any other topic in the entire set of database topics. Before we do this, however, we’ll investigate one other undo-related issue: the question of what type of DML operation generates the most and least undo (you might already be able to answer that yourself, given the examples in the preceding section with temporary tables).
What Generates the Most and Least Undo?
This is a frequently asked but easily answered question. The presence of indexes (or the fact that a table is an index-organized table) may affect the amount of undo generated dramatically, as indexes are complex data structures and may generate copious amounts of undo information.
That said, an INSERT will, in general, generate the least amount of undo, since all Oracle needs to record for this is a rowid to “delete.” An UPDATE is typically second in the race (in most cases). All that needs to be recorded are the changed bytes. It is most common that you UPDATE some small fraction of the entire row’s data. Therefore, a small fraction of the row must be remembered in the undo. Many of the previous examples run counter to this rule of thumb, but that’s because they update large, fixed-size rows and they update the entire row. It is much more common to UPDATE a row and change a small percentage of the total row. A DELETE will, in general, generate the most undo. For a DELETE, Oracle must record the entire row’s before image into the undo segment. The previous temporary table example, with regard to redo generation, demonstrated that fact: the DELETE generated the most redo, and since the only logged element of the DML operation on a temporary table is the undo, we in fact observed that the DELETE generated the most undo. The INSERT generated very little undo that needed to be logged. The UPDATE generated an amount equal to the before image of the data that was changed, and the DELETE generated the entire set of data written to the undo segment.
You will not see the exact same results when you run these tests on your database. It will depend on the number of objects in your database, which will be different from database to database.
As you can see, updating that indexed column in this example generated several times as much undo. This is due to the inherit complexity of the index structure itself and the fact that we updated every single row in the table—moving every single index key value in this structure.
ORA-01555: Snapshot Too Old Error
In the last chapter, we briefly investigated the ORA-01555 error and looked at one cause of it: committing too frequently. Here, we’ll take a much more detailed look at the causes and solutions for the ORA-01555 error. ORA-01555 is one of those errors that confound people. It is the foundation for many myths, inaccuracies, and suppositions.
ORA-01555 is not related to data corruption or data loss at all. It is a “safe” error in that regard; the only outcome is that the query that received this error is unable to continue processing.
The undo segments are too small for the work you perform on your system.
Your programs fetch across COMMITs (actually a variation on the preceding point). We covered this in Chapter 8.
Block cleanout.
will see a read-consistent view of T and the set of rows where X=2, regardless of any other concurrent activity in the database.
The four statements presented here are just examples of the types of statements that would see a read-consistent view of T. They are not meant to be run as a single transaction in the database, as the first update would cause the following three statements to see no records. They are purely illustrative.
All statements that “read” the table take advantage of this read consistency. In the example just shown, the UPDATE reads the table to find rows where x=2 (and then UPDATEs them). The INSERT reads the table to find rows where X=2, and then INSERTs them, and so on. It is this dual use of the undo segments, both to roll back failed transactions and to provide for read consistency that results in the ORA-01555 error.
The third item in the previous list is a more insidious cause of ORA-01555 in that it can happen in a database where there is a single session, and this session is not modifying the tables that are being queried when the ORA-01555 error is raised! This doesn’t seem possible—why would we need undo data for a table we can guarantee is not being modified? We’ll find out shortly.
If your undo tablespace has autoextend enabled, set the parameter UNDO_RETENTION properly (larger than the amount of time it takes to execute your longest-running transaction or the longest expected flashback operation). V$UNDOSTAT can be used to determine the duration of your long-running queries. Also, ensure sufficient space on disk has been set aside so the undo segments are allowed to grow to the size they need to be based on the requested UNDO_RETENTION.
If your undo tablespace is a fixed size, then the UNDO_RETENTION parameter is ignored, and Oracle automatically tunes undo. For fixed-size undo tablespaces, choose a size sufficiently large enough to accommodate long-running queries and flashback operations.
Reduce the runtime of your query (tune it). This is always a good thing if possible, so it might be the first thing you try. It reduces the need for larger undo segments. This method goes toward solving the previous points.
Gather statistics on related objects. This helps avoid the block cleanout point listed earlier. Since the block cleanout is the result of a very large mass UPDATE or INSERT, statistics gathering needs to be done anyway after a mass UPDATE or large load.
We’ll come back to these solutions, as they are important to know. It seemed appropriate to display them prominently before we begin.
Undo Segments Are in Fact Too Small
The scenario is this: you have a system where the transactions are small. As a result, you need very little undo segment space allocated. Say, for example, the following is true:
Each transaction generates 8KB of undo on average.
You do five of these transactions per second on average (40KB of undo per second, 2400KB per minute).
You have a transaction that generates 1MB of undo that occurs once per minute on average. In total, you generate about 3.5MB of undo per minute.
You have an exceedingly small amount of undo configured for your system.
That is more than sufficient undo for this database when processing transactions. The undo segments will wrap around and reuse space about every three to four minutes or so, on average. If you sized undo segments based on your transactions that do modifications, you did all right.
In this same environment, however, you have some reporting needs. Some of these queries take a really long time to run—five minutes, perhaps. Here is where the problem comes in. If these queries take five minutes to execute and they need a view of the data as it existed when the query began, you have a very good probability of the ORA-01555 error occurring. Since your undo segments will wrap during this query execution, you know that some undo information generated since your query began is gone—it has been overwritten. If you hit a block that was modified near the time you started your query, the undo information for this block will be missing, and you will receive the ORA-01555 error.
Long-Running Query Timeline
Time (Minutes:Seconds) | Action |
|---|---|
0:00 | Our query begins. |
0:01 | Another session UPDATEs block 1,000,000. Undo information for this is recorded into some undo segment. |
0:01 | This UPDATE session COMMITs. The undo data it generated is still there, but is now subject to being overwritten if we need the space. |
1:00 | Our query is still chugging along. It is at block 200,000. |
1:01 | Lots of activity going on. We have generated a little over 14MB of undo by now. |
3:00 | Our query is still going strong. We are at block 600,000 or so by now. |
4:00 | Our undo segments start to wrap around and reuse the space that was active when our query began at time 0:00. Specifically, we have just reused the undo segment space that the UPDATE to block 1,000,000 used back at time 0:01. |
5:00 | Our query finally gets to block 1,000,000. It finds it has been modified since the query began. It goes to the undo segment and attempts to find the undo for that block to get a consistent read on it. At this point, it discovers the information it needs no longer exists. ORA-01555 is raised and the query fails. |
This is all it takes. If your undo segments are sized such that they have a good chance of being reused during the execution of your queries, and your queries access data that will probably be modified, you stand a very good chance of hitting the ORA-01555 error on a recurring basis. If this is the case, you must set your UNDO_RETENTION parameter higher and let Oracle take care of figuring out how much undo to retain (this is the suggested approach; it’s much easier than trying to figure out the perfect undo size yourself) or resize your undo segments and make them larger (or have more of them). You need enough undo configured to last as long as your long-running queries. The system was sized for the transactions that modify data—you forgot to size for the other components of the system.
Automatic undo management: Here, Oracle is told how long to retain undo for, via the UNDO_RETENTION parameter. Oracle will determine how many undo segments to create based on concurrent workload and how big each should be. The database can even reallocate extents between individual undo segments at runtime to meet the UNDO_RETENTION goal set by the DBA. This is the recommended approach for undo management.
Manual undo management: Don’t use this method. This is a relic of the early versions of Oracle.
With manual undo management, DBAs had the choice of manually setting the size and number of the undo segments. Don’t use the manual method. Knowledge of this topic is really only relevant when trying to impress older DBAs on the team.
Under automatic undo management, things are much easier from the ORA-01555 perspective. The DBA first creates an autoextending undo tablespace and then tells the database how long the longest-running query (or flashback operation) is and sets that value in the UNDO_RETENTION parameter. Oracle will attempt to preserve undo for at least that duration of time. If sufficient space to grow has been allocated, Oracle will extend an undo segment and not wrap around—in trying to obey the UNDO_RETENTION period. This is in direct contrast to manually managed undo, which will wrap around and reuse undo space as soon as it can. It is primarily for this reason, the support of the UNDO_RETENTION parameter, that I highly recommend automatic undo management whenever possible. That single parameter reduces the possibility of an ORA-01555 error greatly (when it is set appropriately).
If you have a fixed-size undo tablespace, then the UNDO_RETENTION parameter is ignored by Oracle. In this configuration, you can use tools such as the Undo Advisor to help you appropriately size your undo tablespace. The Undo Advisor is accessible via Enterprise Manager or the DBMS_ADVISOR PL/SQL packages. The two most important considerations in sizing your undo are the length of the longest-running query and the longest interval you require for flashback operations.
I am getting a little too deep into the DBA role at this point, so we’ll move on to the next case. It’s just important that you understand that the ORA-01555 error in this case is due to the system not being sized correctly for your workload. The only solution is to size correctly for your workload. It is not your fault, but it is your problem since you hit it. It’s the same as if you run out of temporary space during a query. You either configure sufficient temporary space for the system, or you rewrite the queries so they use a plan that does not require temporary space.
To demonstrate this effect, we can set up a small, but somewhat artificial, test. We’ll create a very small undo tablespace with one session that will generate many small transactions, virtually assuring us that it will wrap around and reuse its allocated space many times—regardless of the UNDO_RETENTION setting , since we are not permitting the undo tablespace to grow. The session that uses this undo segment will be modifying a table, T. It will use a full scan of T and read it from “top” to “bottom.” In another session, we will execute a query that will read the table T via an index. In this fashion, it will read the table somewhat randomly: it will read row 1, then row 1000, then row 500, then row 20,001, and so on. In this way, we will tend to visit blocks very randomly and perhaps many times during the processing of our query. The odds of getting an ORA-01555 error in this case are virtually 100 percent.
UNDO_RETENTION is set in the database to be at least long enough for this read process to complete. That will allow the database to grow the undo tablespace to hold sufficient undo for us to complete.
The undo tablespace is allowed to grow, or you manually allocate more disk space to it.
So, instead of receiving an error, we completed successfully, and the undo grew to be large enough to accommodate our needs. It is true that in this example, getting the error was purely due to the fact that we read the table T via the index and performed random reads all over the table. If we had rapidly full scanned the table instead, there is a good chance we would not have received the ORA-01555 error in this particular case. This is because both the SELECT and UPDATE would have been full scanning T, and the SELECT could most likely race ahead of the UPDATE during its scan (the SELECT just has to read, but the UPDATE must read and update and therefore could go slower). By doing the random reads, we increase the probability that the SELECT will need to read a block, which the UPDATE modified and committed many rows ago. This just demonstrates the somewhat insidious nature of the ORA-01555 error. Its occurrence depends on how concurrent sessions access and manipulate the underlying tables.
Delayed Block Cleanout
This cause of the ORA-01555 error is hard to eliminate entirely, but it is rare anyway, as the circumstances under which it occurs do not happen frequently. We have already discussed the block cleanout mechanism, but to summarize, it is the process whereby the next session to access a block after it has been modified may have to check to see if the transaction that last modified the block is still active. Once the process determines that the transaction is not active, it cleans out the block so that the next session to access it does not have to go through the same process again. To clean out the block, Oracle determines the undo segment used for the previous transaction (from the block’s header) and then determines whether the undo header indicates that the transaction has been committed and, if so, when it committed. This confirmation is accomplished in one of two ways. One way is that Oracle can determine that the transaction committed a long time ago, even though its transaction slot has been overwritten in the undo segment transaction table. The other way is that the COMMIT SCN is still in the transaction table of the undo segment, meaning the transaction committed a short time ago, and its transaction slot hasn’t been overwritten.
A modification is made and COMMITed, and the blocks are not cleaned out automatically (e.g., the transaction modified more blocks than can fit in ten percent of the SGA block buffer cache).
These blocks are not touched by another session and will not be touched until our unfortunate query (displayed shortly) hits it.
A long-running query begins. This query will ultimately read some of those blocks from earlier. This query starts at SCN t1, the read-consistent SCN it must roll data back to in order to achieve read consistency. The transaction entry for the modification transaction is still in the undo segment transaction table when we begin.
During the query, many commits are made in the system. These transactions don’t touch the blocks in question (if they did, we wouldn’t have the impending problem as they would clean out the old transaction—solving the cleanout issue).
The transaction tables in the undo segments roll around and reuse slots due to the high degree of COMMITs. Most important, the transaction entry for the original modification transaction is cycled over and reused. In addition, the system has reused undo segment extents, preventing a consistent read on the undo segment header block itself.
Additionally, the lowest SCN recorded in the undo segment now exceeds t1 (it is higher than the read-consistent SCN of the query), due to the large number of commits.
When our query gets to the block that was modified and committed before it began, it is in trouble. Normally, it would go to the undo segment pointed to by the block and find the status of the transaction that modified it (in other words, it would find the COMMIT SCN of that transaction). If the COMMIT SCN is less than t1, our query can use this block. If the COMMIT SCN is greater than t1, our query must roll back that block. The problem is, however, that our query is unable to determine in this particular case if the COMMIT SCN of the block is greater than or less than t1. It is unsure as to whether it can use that block image or not. The ORA-01555 error then results.
The 4MB UNDO_SMALL undo tablespace.
A 300MB SGA, this is so we can get some dirty blocks flushed to disk to observe this phenomenon.
You might wonder why I didn’t use CASCADE=>TRUE on the gather statistics call to gather statistics on the index created by default by the primary key constraint. That is because a CREATE INDEX or ALTER INDEX REBUILD has implicit compute statistics added to it already whenever the table it is indexing is not empty. So, the very act of creating the index has the side effect of gathering statistics on itself. There’s no need to regather the statistics we already have.
Ensure you are using “right-sized” transactions in the first place. Make sure you are not committing more frequently than you should.
Use DBMS_STATS to scan the related objects, cleaning them out after the load. Since the block cleanout is the result of a very large mass UPDATE or INSERT, this needs to be done anyway.
Allow the undo tablespace to grow by giving it the room to extend and increasing the undo retention. This decreases the likelihood of an undo segment transaction table slot being overwritten during the course of your long-running query. This is the same as the solution for the other cause of an ORA-01555 error (the two are very much related; you experience undo segment reuse during the processing of your query). In fact, I reran the preceding example with the undo tablespace set to autoextend 1MB at a time, with an undo retention of 900 seconds. The query against the table BIG completed successfully.
Reduce the runtime of your query—tune it. This is always good if possible, so it might be the first thing you try.
That way you ensure you’re not running your database with an extremely small undo tablespace.
Summary
In this chapter, we investigated how to measure redo. We also looked at the impact that NOLOGGING has on redo generation. When used in combination with direct path operations (e.g., direct path insert), the generation of redo can be reduced dramatically. However, for regular DML statements, the NOLOGGING clause has no effect.
We explored the reasons why a log switch might be delayed. Oracle won’t allow a redo log to be overwritten in the event that DBWn has not yet finished checkpointing the data protected by the redo log or ARCn has not finished copying the redo log file to the archive destination. This is mainly a problem for the DBA to detect (inspect the alert.log) and manage.
We discussed how redo is handled with transactions that occur in temporary tables. In 12c and above, the amount of redo can be reduced to nearly nothing. For applications that use temporary tables, this can have a positive impact on performance.
In this chapter, we also investigated which statements generate the least and most undo. In general, an INSERT generates the least amount, an UPDATE generates more than INSERT, and a DELETE generates the most undo.
Lastly, we explored the causes of the infamous ORA-01555 error (snapshot too old). This error can occur because the undo tablespace has been sized too small. The DBA must ensure that the undo tablespace is sized large enough mostly to eliminate this as a cause for the error. We also looked at how a delayed block cleanout can cause issues. If you’ve correctly sized your transactions and your undo tablespace, you will probably rarely run into this error. Tuning the query that throws the ORA-01555 error should always be one of the first methods employed to resolve the issue.