
![]()
by Riyaj Shamsudeen
Oracle database uses a locking scheme as a coordination mechanism to protect critical resources from concurrent changes. In a single-instance database, instance-level locks are sufficient as the locks need to be visible in the local instance only, so local locks are sufficient. In a RAC database, resources must be globally visible and so a new layer—Global Enqueue Services (GES)—is employed to implement a global locking scheme.
Global Resource Directory (GRD) is a memory area designed to keep track of the state of resources in a RAC database. GRD is distributed across all active instances of a database. This distribution removes a single point of failure and resource contention.
In this context, a resource is a structure designed to protect an entity from concurrent changes and act as a coordination mechanism for concurrency control. Locks are acquired on that resource before altering the entity. For example, a database table is a lockable entity, and before altering a table, a resource is allocated uniquely representing that table. Then, a lock is acquired on that resource in a specific mode. Another session modifying the same table must acquire a lock on the resource before altering the table. If the requested lock mode is incompatible with mode already held, then the requesting session must wait for the locks to be available. With this locking scheme, concurrent changes are coordinated to avoid consistency issues.
In a single-instance database, entities are modified only by a single instance, so single-instance resources and locks are sufficient to implement a locking scheme. In a RAC database, an entity can be modified by any instance of a database and hence changes must be globally coordinated. Globally maintained structures are required, as local resources and locks are not sufficient. For example, a session in instance 1 locks a row and another session in instance 2 tries to modify the same row concurrently while the transaction initiated by the session 1 is still active. A global locking scheme, GES layer, is employed to protect critical resources from concurrent changes globally. As in a single-instance locking scheme, every global resource has an associated resource structure: locking a global resource means that a global locking structure is associated with a global resource.
Figure 11-1 shows the structures employed in this global locking scheme. In this figure, a database table is to be locked. A resource uniquely representing that table is allocated to protect it. The resource uniquely represents the table by coding object_id of the table in the resource_name. Further, a resource structure has two queues: converting queue and granted queue. If a process succeeds in acquiring a lock on a resource, then that process is added to the granted queue of the resource. If the resource is not available or if the requested lock mode is incompatible with lock mode held already, then the requesting process is added to the converting queue. In Figure 11-1, one process is holding a lock on the resource, and two processes are waiting for the resource to be available.

Figure 11-1. Resources and locks in GRD
![]() Note Figure 11-1 shows locks and resources for both GES structures and Global Cache Services (GCS) structures. Internally, GCS manages cache fusion-related resources. GCS resources are externalized in x$kjbr fixed table, GCS locks are externalized in x$kjbl fixed table, GES resources are externalized in x$kjirft, and GES locks are externalized in x$kjilkft table. There are a few more structures implementing resources and locks too.
Note Figure 11-1 shows locks and resources for both GES structures and Global Cache Services (GCS) structures. Internally, GCS manages cache fusion-related resources. GCS resources are externalized in x$kjbr fixed table, GCS locks are externalized in x$kjbl fixed table, GES resources are externalized in x$kjirft, and GES locks are externalized in x$kjilkft table. There are a few more structures implementing resources and locks too.
GRD is distributed among active instances of a database. For example, if there are three active instances, then one-third of GRD is resident in each instance. As resources and locks are integral components of GRD, resources are also distributed among active instances, and an instance is assigned to be the resource master; essentially, a resource master keeps track of the state of the resource at any given time. As searching for a resource in all instances will be cost-prohibitive, by employing the resource mastering scheme, search for a resource is optimized. Essentially, locking a resource has three steps: identify the resource master instance; request for locks on that resource to the resource master instance; and then the resource master instance grants lock or adds the request to the converting queue. The following is an elaboration of these steps:
- Identify the master instance of a resource using the resource name. Typically, a variant of hash function is applied on the resource name to identify the master instance.
- Send a message to resource master instance to acquire a lock on the resource. If the resource is available, then the remote instance will allocate a locking structure and associate the locking structure to the granted queue of that resource. A message is sent back to the requesting process with a grant. This action implies that requested process now holds a lock on that resource.
- If the resource is not available, then the resource master instance will allocate a locking structure and associate the locking structure to the converting queue. A process in the converting queue waits for the resource to be available.
Resources and locks are allocated in GRD and maintained by GES layer processes. These components are the key pieces for the global locking scheme.1
GRD is stored in the shared_pool area of instance SGA. The memory allocations for GES resources and locks are tagged as ges resources and ges enqueues. As the size of SGA and activity grows, these memory areas can grow dynamically too. In the following output, 65MB is allocated for ges resource and 150MB for ges enqueues. The size of GCS layer resources and locks is proportional to the size of SGA.
SELECT name, TRUNC(bytes/1024/1024, 2) size_MB
FROM v$sgastat
WHERE name LIKE 'ges resource%'
OR name LIKE 'ges enqueues'
OR name LIKE 'gcs resources'
OR name LIKE 'gcs enqueues'
OR name LIKE 'gcs shadows';

NAME                          SIZE_MB
-------------------------- ----------
ges resource                    65.77
ges enqueues                   150.37
gcs resources                  599.44
gcs shadows                    441.69
In version 12c, ges resource memory allocations are fine-grained into permanent and dynamic resource allocations. The following shows the output of the earlier query.
NAME                          SIZE_MB
-------------------------- ----------
ges resource dynamic            10.81
ges resource permanent          45.87
...
You can gather statistics about dynamic growth or shrinkage by reviewing v$resource_limit view. In the following output, resources grew up to a count of 689,253. However, current utilization is 123,090. This dynamic growth or shrinkage is not necessarily a concern unless SGA memory allocations for resources and enqueues are growing rapidly.
SELECT * FROM v$resource_limit WHERE resource_name IN
('ges_ress','ges_locks', 'gcs_resources','gcs_shadows');

                                  Current        Max Initial
RESOURCE_NAME                        Util       Util Alloc           Limit
------------------------------ ---------- ---------- --------------- ----------
ges_ress                           123090     689253     131128       UNLIMITED
ges_locks                           91215     524188     293045       UNLIMITED
gcs_resources                      755053    1167954    4135261       4135261
gcs_shadows                        823219     874225    4135261       4135261
If you have access and license to performance metrics stored in AWR (Automatic Workload Repository), you can review the growth and shrink of these areas over a period using the code listed in Listing 11-1.
Listing 11-1. History of SGA Allocations for RAC-Specific Allocations
select
    to_date(to_char(trunc(begin_interval_time), 'DD-MON-YYYY'), 'DD-MON-YYYY') DAY,
    instance_number,
    trunc(max(bytes/1024/1024),2)  sz_MB
  from
   (select begin_interval_time, s.instance_number, sum(bytes) bytes
    from
      dba_hist_sgastat g, dba_hist_snapshot s
   where (name like '%ges%' or name like '%gcs%')
    and trunc(begin_interval_time) >= sysdate -30
    and s.snap_id = g.snap_id
    and s.instance_number = g.instance_number
    group by begin_interval_time, s.instance_number
   )
  group by
    to_date(to_char(trunc(begin_interval_time), 'DD-MON-YYYY'), 'DD-MON-YYYY'),
    instance_number
order by 1
/
DAY             INSTANCE_NUMBER      SZ_MB
--------------- --------------- ----------
...
22-SEP-12                     1    1347.56
22-SEP-12                     2     599.44
22-SEP-12                     3    1358.17
To accommodate the increase in RAC-specific memory allocations, you should consider increasing the size of shared pool (shared_pool_size parameter) when you convert the database from single instance to a RAC database.2 Along the same line of reasoning, you should consider increasing the size of shared pool if you increase buffer cache size to accommodate the increase in GCS allocation size.
There are two categories of global resource types.
- BL resource: BL (Buffer Lock) resources are at the heart of cache fusion processing and protect buffer cache buffers in the SGA from concurrent modifications by multiple instances at any given time. Before a buffer of a database block is modified, lock on a BL resource is acquired in a specific lock mode. GCS layer manages BL resources.
- Non-BL resources: Resources such as TX, TM, SQ, etc., are few examples of non-BL resources. GES layer manages non-BL resources.
There are subtle differences between the implementation of these two types of resources, and I will discuss non-BL resources in this chapter. BL resource specifics are discussed in Chapter 10.
Let me explain the locking scheme with an example. Consider a table T1 with object_id of 11984883. Before altering table T1 with a DDL statement, such as dropping a column from the table or locking the table in exclusive mode, a lock on a TM resource must be acquired. A TM resource is allocated to protect this table T1 and uniquely represents table T1, as id1 attribute of that resource is set to object_id of the table.
In the following code, table T1 is locked in exclusive mode. A lock structure is visible in gv$lock view with id1 column value set to 11984883. Also, note that locking mode of the resource is set to 6 (exclusive mode). The following output indicates single-instance locking scheme.
REM First let us lock a small table in exclusive mode.
SQL> LOCK TABLE t1 IN exclusive MODE;
Table locked.

REM Query gv$lock to review single-instance locks.
SQL> SELECT sid, type, id1, id2, lmode, request FROM gv$lock WHERE type='TM';

       SID TY        ID1        ID2      LMODE    REQUEST
---------- -- ---------- ---------- ---------- ----------
         4 TM   11984883          0          6          0
In RAC, single-instance resources and locks are globalized as global resources. In Listing 11-2, a global resource is seen in gv$ges_resource with a resource name [0xb6dff3][0x0],[TM] to protect table T1. This resource_name is coined using object_id of the table, providing a one-to-one mapping between the resource and the table T1. Resource name is a string concatenated with three components: [0xb6dff3] is object_id in hexadecimal representation, the second component [0x0] is not applicable to TM resource type (set to zero), and the third component [TM] is a string identifying resource type.
Listing 11-2. Resource Name in ges_resource
REM Global resource is created with an unique resource name referring to
REM object_id of the table.

SQL> SELECT inst_id, resource_name, master_node, on_convert_q, on_grant_q
     FROM gv$ges_resource WHERE resource_name LIKE '[0xb6dff3]%TM%' ;

   INST_ID RESOURCE_NAME                  MASTER_NODE ON_CONVERT_Q ON_GRANT_Q
---------- ------------------------------ ----------- ------------ ----------
         1 [0xb6dff3][0x0],[TM][ext 0x0,0           0            0          1
RESOURCE_NAME
Interestingly, you can also identify the resource_name using the oradebug command. The ffollowing code uses the oradebug command3 to print the resource details to a trace file by accepting decimal representation. After connecting to the database as SYS user:
REM Set my process for Oradebug
SQL>oradebug setmypid

REM Print the resource details for the object_id (three components)

REM Use the object_id of your table, in this case, object_id=11984883 for table T1.
SQL>oradebug lkdebug -O 11984883 0 TM

REM Print the trace file name
SQL>oradebug tracefile_name
/opt/app/product/11.2.0.2/admin/diag/rdbms/RACD/trace/RACD_ora_920.trc
Review of the trace file shows the details about resource_name: [0xb6dff3][0x0],[TM] is printed in the trace file.
Note that column master_node indicates the master node of the resource. This resource is mastered by instance with inst_id=1. Also, master_node column values start at 0; in contrast, inst_id column values start with 1. Hence, master_node=0 indicates inst_id=1.
Next, I will query gv$ges_enqueue to review locking structures. Locks associated with the global resource [0xb6dff3][0x0],[TM] are visible in the following code output. The grant_level of the lock is KJUSEREX, exclusive mode. I will discuss locking modes in the next section.
REM Locks are acquired on that global resource in an exclusive mode.
Set serveroutput on size 100000
BEGIN
   print_Table (q'#
    select  inst_id, resource_name1, grant_level, request_level,state, blocked, blocker from
    gv$ges_enqueue where resource_name1 like '[0xb6dff3]%TM%'
    #');
 END;
/
INST_ID                       : 1
RESOURCE_NAME1                : [0xb6dff3][0x0],[TM][ext 0x0,0
GRANT_LEVEL                   : KJUSEREX
REQUEST_LEVEL                 : KJUSEREX
STATE                         : GRANTED
BLOCKED                       : 0
BLOCKER                       : 0
![]() Note I am using a procedure named print_table to pretty print the columns. Print_table is a PL/SQL procedure written by Tom Kyte. In a nutshell, that procedure prints the column values in a row format. We will be using the print_table procedure in our book to improve readability of the code output. Search on your favorite search engine for “print_table tom kyte” or it can also be downloaded from the following URL: http://asktom.oracle.com/pls/apex/f?p=100:11:0::::P11_QUESTION_ID:1035431863958.
Note I am using a procedure named print_table to pretty print the columns. Print_table is a PL/SQL procedure written by Tom Kyte. In a nutshell, that procedure prints the column values in a row format. We will be using the print_table procedure in our book to improve readability of the code output. Search on your favorite search engine for “print_table tom kyte” or it can also be downloaded from the following URL: http://asktom.oracle.com/pls/apex/f?p=100:11:0::::P11_QUESTION_ID:1035431863958.
Resources can be locked in various modes in RAC too. In single instance, six locking modes (1 through 6) are available to lock a resource. Similarly, RAC too has six locking modes. In fact, there is a one-to-one mapping between a single-instance locking mode and RAC locking mode, as shown in Table 11-1. Semantics of these single-instance locking modes are functionally equivalent to locking modes in RAC. Table 11-1 shows locking modes and their meaning.
Table 11-1. Lock Modes

It is important to understand most common locking modes for TX/TM resources. I will discuss the meaning of TX/TM lock modes later in this chapter.
Dynamic view gv$lock shows all single-instance locks globally. View gv$lock is based upon the fixed table x$ksqst. Accessing gv$lock view retrieves data from x$ksqst table from all instances, processes rows, and returns the result set. Rows from the gv$lock and gv$resource views do not retrieve any information from GRD.
In contrast, Dynamic view gv$ges_resource shows global resource and it is based upon two fixed tables: X$KJBR and X$KJIRFT. Fixed table X$KJBR externalizes resources structures of BL resource type and fixed table X$KJIRFT externalizes resource structures of non-BL resource types such as TX, TM, etc. Similarly, gv$ges_enqueue is based upon the fixed tables X$KJBL and X$KJILKFT. Fixed table X$KJBL externalizes BL locks and X$KJILKFT externalizes non-BL locks. These four fixed tables are at the heart of the global locking scheme in RAC.
![]() Note Parallel servers named PZxx are employed to retrieve data from other instances if you query gv$ views. Session querying gv$ views acts as a query coordinator, parallel servers named PZxx (xx is number between 99 and 01) retrieve data from other instances, and the query coordinator process receives data and returns it to the user. From version 11g onward, even if you disable parallelism completely, PZ process can be spawned in other instances. Also, PZ parallel server process starts with 99 and decrements for each additional PZ process. For example, the first query accessing gv$ views will use PZ99 server processes in all nodes, and the second concurrent query accessing gv$ views will use PZ98 parallel server process.
Note Parallel servers named PZxx are employed to retrieve data from other instances if you query gv$ views. Session querying gv$ views acts as a query coordinator, parallel servers named PZxx (xx is number between 99 and 01) retrieve data from other instances, and the query coordinator process receives data and returns it to the user. From version 11g onward, even if you disable parallelism completely, PZ process can be spawned in other instances. Also, PZ parallel server process starts with 99 and decrements for each additional PZ process. For example, the first query accessing gv$ views will use PZ99 server processes in all nodes, and the second concurrent query accessing gv$ views will use PZ98 parallel server process.
To review global locks, we need to access GES layer-level views. All currently held locks can be reviewed by querying gv$ges_enqueue. Currently blocked locks can be reviewed by querying v$ges_blocking_enqueue. Interpretations and methods will be discussed while discussing individual resource types.
Oracle Database version 12c introduces the pluggable databases feature, which allows many pluggable databases to be resident in a container database.
Pluggable databases bring an interesting problem for resource names. For example, for the table resources (TM resource type), object_id is used to coin the resource name, as object_id is unique prior to 12c. But in 12c, object_id is unique only within a pluggable database. As GES layer is a common service to all pluggable databases, it is not sufficient to just use object_id alone to coin the resource_name.
So, from version 12c onward, resource_name is coded with container_id of the PDB also. For example, I created two PDBs (hrdb1 and hrdb2) in a container database and managed to create a table GSTEST with the same object_id:89897. As you can see in the following, the ext attribute of the resource_name is coded with container_id of the PDB to make the resource_name unique. In the following, the first resource is for GSTEST table created in hrdb1 PDB with container_id equal to 3 and second resource is for the GSTEST table created in hrdb2 PDB with container_id equal to 4.
select resource_name from gv$ges_resource where resource_name like '[0x15f29][0x0],[TM]%'
/
RESOURCE_NAME
------------------------------
[0x15f29][0x0],[TM][ext 0x3,0x hrdb1 PDB – GSTEST table –object_id=89897
[0x15f29][0x0],[TM][ext 0x4,0x hrdb2 PDB – GSTEST table –object_id=89897
select resource_name1, con_id, state, grant_level
from gv$ges_enqueue where resource_name1 like '[0x15f29][0x0],[TM]%';
RESOURCE_NAME1 CON_ID STATE GRANT_LEV
------------------------------ ---------- -------------------- ---------
[0x15f29][0x0],[TM][ext 0x4,0x 0 GRANTED KJUSEREX
[0x15f29][0x0],[TM][ext 0x3,0x 0 GRANTED KJUSEREX
So, from version 12c onward, you should pay close attention to ext attribute of resource_name to identify PDB of the object.
Troubleshooting Locking Contention
To understand locking contention, we need to understand holders and waiters of global locks. A handful of global GES views are useful to understand the locking contention. I will use a small example to illustrate the views and methods to interpret the data from global views.
In this example, I will create a blocking lock between two sessions connecting to two different instances. Refer to the following code: session 1 locked the table T1 in exclusive mode. Session 2 tries to lock the table in exclusive mode while session 1 is holding the lock. Since there is an exclusive lock already held on the table T1, session 2 enqueues waiting for session 1 to release the lock.
REM From session 1, lock table t1 from instance 1.

SQL> lock table t1 in exclusive mode;
Table locked.

REM From session 2, try to lock table t1 from instance 2.

SQL> lock table t1 in exclusive mode;
<.. Session 2 is waiting for the lock..>
Output of gv$ges_blocking_enqueue is printed in Listing 11-3. Querying gv$ges_blocking_enqueue, you can see the following details about all blocked locks:
- Column resource_name uniquely identifies the table T1, as the first part of the string 0xb6dff3 is coded with object_id of the table in hexadecimal format.
- Column STATE is set to GRANTED, implying that lock on the resource has been granted to PID:17665. Column value OPENING means that the process is waiting for the lock to be available.
- Column BLOCKED indicates if the process is blocked or not. A value of 1 in the BLOCKED column indicates that process is blocked and waiting for lock to be available.
- Column BLOCKER indicates if the process is blocking another process or not. A value of 1 in the BLOCKER column indicates that the process is blocking another process.
- Column owner_node indicates the owner node for that lock. PID 3914 is connected to instance 1 (inst_id=2) and PID 17665 is connected to instance 0 (inst_id=1).
Listing 11-3. gv$ges_blocking_enqueue
REM At this time, session 2 will be waiting for locks. Let’s review global locks.

SQL> col inst_id format 99
SQL> col owner_node format 99 head 'Owner|Node'

SQL> SELECT inst_id, pid, resource_name1, state, owner_node, blocked, blocker
     FROM gv$ges_blocking_enqueue
     ORDER BY resource_name1;
                                                            Owner
INST_ID        PID RESOURCE_NAME1                 STATE       Node    BLOCKED    BLOCKER
------- ---------- ------------------------------ ---------- ----- ---------- ----------
      1      17665 [0xb6dff3][0x0],[TM][ext 0x0,0 GRANTED        0          0          1
      2       3914 [0xb6dff3][0x0],[TM][ext 0x0,0 OPENING        1          1          0
View gv$ges_blocking_enqueue can be joined to gv$process to retrieve session-level details. Listing 11-4 prints a useful script to retrieve session-level details. Session with a SID of 943 is holding a lock in KJUSEREX mode and session 4312 is waiting for the resource to be available. In this example, the resource type is TM, since we are locking the table object.
Listing 11-4. ges_blocking_locks.sql Script
REM Author: Riyaj Shamsudeen
REM ges_blocking_locks.sql script
col state format A10
col pid format 99999999
set serveroutput on size 100000
begin
 print_Table ('
        with dl as (
        SELECT inst_id, resource_name1, grant_level, request_level,
          transaction_id0, which_queue, state, pid, blocked ,
          blocker
        FROM gv$ges_blocking_enqueue
        )
        SELECT dl.inst_id, dl.resource_name1, dl.grant_level,
          dl.request_level, dl.state, s.sid, sw.event,
          sw.seconds_in_wait sec
        FROM dl,
          gv$process p, gv$session s, gv$session_wait sw
        WHERE (dl.inst_id = p.inst_id AND dl.pid        = p.spid)
        AND (p.inst_id    = s.inst_id AND p.addr        = s.paddr)
        AND (s.inst_id    = sw.inst_id AND s.sid        = sw.sid)
        ORDER BY sw.seconds_in_wait DESC
');
end;
/

INST_ID                       : 1
RESOURCE_NAME1                : [0xb6dff3][0x0],[TM][ext 0x0,0
GRANT_LEVEL                   : KJUSEREX
REQUEST_LEVEL                 : KJUSEREX
STATE                         : GRANTED
SID                           : 943
EVENT                         : PX Deq: Execute Reply
SEC                           : 0
-----------------
INST_ID                       : 2
RESOURCE_NAME1                : [0xb6dff3][0x0],[TM][ext 0x0,0
GRANT_LEVEL                   : KJUSERNL
REQUEST_LEVEL                 : KJUSEREX
STATE                         : OPENING
SID                           : 4312
EVENT                         : enq: TM - contention
SEC                           : 1798
In this section, I will discuss locking contention, which is frequently seen in a typical RAC database.
Oracle database provide row-level locking abilities for a fine-grained locking granularity. Sessions trying to modify a row locked by another transaction must wait for the transaction to commit or rollback before modifying the row. In a single-instance database, row-level locking scheme is implemented using TX resources and locks; a TX resource protects one transaction. A session initiating a transaction will hold exclusive mode lock on a TX resource, and a session waiting to modify the row locked by the first transaction will request exclusive mode lock on the lock holder’s TX resource. After the lock holder completes the transaction, that is, commit or rollback, holding session will release the lock on TX resource. As the lock request is complete, lock waiter will continue to modify the row.
In a RAC database, sessions connected to two different instances could try to modify a row. So, TX resources and locks are globalized in a RAC database. A global locking scheme is employed to protect the TX resources globally. I will explain TX resource contention in a RAC database using a simple example: In the following code, session #1 updated a row, thereby initiating a new transaction. Transaction_id of the transaction is 1557.11.9239 as retrieved using dbms_transaction packaged call. From session #2, I will try to update the same row and since the row is locked by session #1, session #2 will wait for the lock to be available. Essentially, session #2 will wait for the transaction initiated by session #1 to complete.
REM From session 1, I will lock a row. SID=6445
SQL> update t1 set n1=n1 where n1=100;

select dbms_Transaction.LOCAL_TRANSACTION_ID from dual;

LOCAL_TRANSACTION_ID
--------------------
1557.11.9239

REM From session 2 connected to a different instance, I will update the same row.
REM  SID=12229
SQL> update t1 set n1=n1 where n1=100;
In single-instance views, TX resources are visible in v$lock family of views. In the following output, a TX resource with id1=102039563 and id2=9239 is held in exclusive mode by session 6445. Session with SID=12229 is requesting a lock on the same TX resource in exclusive mode. The combination of enqueue types id1 and id2 uniquely identifies a transaction.
SELECT sid, type, id1, id2, lmode, request
FROM gv$lock WHERE (type, id1, id2) IN
  (SELECT type, id1, id2 FROM gv$lock WHERE request>0) ;
   SID TY        ID1        ID2 LMODE REQUEST
------ -- ---------- ---------- ----- -------
  6445 TX  102039563       9239     6       0
 12229 TX  102039563       9239     0       6
Now, let’s review the global locks. In Listing 11-5, output of ges_blocking_locks.sql script shows that session 6445 is holding a lock on a global TX resource in KJUSEREX mode, and session 12229 is waiting for the lock and has requested the lock in KJUSEREX mode. State OPENING indicates that the session is waiting for the resource to be available. Wait event confirms the row-level lock wait.
Listing 11-5. TX Enqueue Contention
REM Reviewing the output of ges_blocking_locks.sql script, session 12229 is
REM waitingfor TX lock. Session 6445 is holding a TX enqueue.
REM Script is printed in Listing 11-4.
SQL> @ges_blocking_locks.sql

INST_ID                       : 2
RESOURCE_NAME1                : [0x615000b][0x2417],[TX][ext 0
GRANT_LEVEL                   : KJUSEREX
REQUEST_LEVEL                 : KJUSEREX
STATE                         : GRANTED
SID                           : 6445
EVENT                         : ges remote message
SEC                           : 0
-----------------
INST_ID                       : 1
RESOURCE_NAME1                : [0x615000b][0x2417],[TX][ext 0
GRANT_LEVEL                   : KJUSERNL
REQUEST_LEVEL                 : KJUSEREX
STATE                         :OPENING
SID                           : 12229
EVENT                         :enq: TX - row lock contention
SEC                           : 462
Transaction_id is used to coin a unique resource_name [0x615000b][0x2417],[TX] in GRD. The first part of string [0x615000b] is the concatenation of strings 615 and 000b. 0x615 is a hexadecimal representation of decimal 1557, and 0x000b is the hexadecimal representation of 11. The second part of string 0x2417 is the hexadecimal representation of 9239. These three parts, 1557.11.9239, combined together constitute the transaction_id we queried using dbms_transaction package call.
![]() Note gv$ges_blocking_enqueue encompasses both GES and GCS layer locks. If your buffer cache is huge, in the order of hundreds of gigabytes, accessing this gv$ view can be slower.
Note gv$ges_blocking_enqueue encompasses both GES and GCS layer locks. If your buffer cache is huge, in the order of hundreds of gigabytes, accessing this gv$ view can be slower.
Oracle Development introduces code optimization in new releases, and some of those features are quietly introduced. For example, from version 11g, TX resource visibility stays local until a session in another instance tries to acquire a lock on that TX resource. This optimistic strategy improves RDBMS efficiency, as most transactions will complete without inducing or suffering from locking waits. Only a few percent of transactions will suffer from locking contention and hence it is efficient to defer maintenance of GES structures until it is absolutely necessary to do so. With this optimization, code path is reduced as the maintenance of global structures is completely avoided for most transactions. Further, this optimization is very useful in reducing global cache workload in the database using application affinity.
In addition to TX resources, the row-level locking scheme must protect the base table from any incompatible change also. So, lock on a TM resource protecting the table is acquired in a single-instance database. In RAC, TM locks are globalized as GRD resources, and locks are acquired in row share mode.
I will a fabricate TM resource_name by converting object_id of T1 table to a string of format [0x obj_id][0x0],[TM]. This resource_name will be used to search in gv$ges_resource in Listing 11-6. The following code uses built-in functions to coin the resource_name.
REM Derive a resource_name string from object_id.
SELECT DISTINCT '[0x'
    ||trim(TO_CHAR(object_id, 'xxxxxxxx'))
    ||'][0x'
    || trim(TO_CHAR(0,'xxxx'))
    || '],[TM]' res
FROM dba_objects WHERE object_name=upper('&objname')
AND owner=upper('&owner') AND object_type LIKE 'TABLE%';
Enter value for objname: T1
Enter value for owner: RS
RES
---------------------------
[0xb6dff3][0x0],[TM]
In Listing 11-6, a SQL statement queries gv$ges_resource and searches for the resources with the coined resource name. A global resource is visible in both nodes. Also, note that master_node of the resource is set to 0 (inst_id=1). Querying gv$ges_enqueue, we see that two locks have been acquired on this resource, in KJUSERCW mode (Mode KJUSERCW—Row Exclusive or Concurrent Write—is compatible with another KJUSERCW mode).
Listing 11-6. TM Resources
REM Using the derived resource_name, identify all GES resources.

SELECT inst_id, resource_name, master_node
FROM gv$ges_resource WHERE resource_name LIKE '[0xb6dff3][0x0],[TM]%' ;

   INST_ID RESOURCE_NAME                  MASTER_NODE
---------- ------------------------------ -----------
         1 [0xb6dff3][0x0],[TM][ext 0x0,0           0
         2 [0xb6dff3][0x0],[TM][ext 0x0,0           0

REM Identify all GES locks for that resource.

col state format a10
col inst_id format 99 head Inst
col owner_node format 99 head 'Owner|Node'

SQL> SELECT inst_id, resource_name1, pid, state,
            owner_node , grant_level, request_level
     FROM gv$ges_enqueue
     WHERE resource_name1 LIKE '[0xb6dff3][0x0],[TM]%' ;
                                                          Owner
Inst RESOURCE_NAME1                        PID STATE       Node GRANT_LEV REQUEST_L
---- ------------------------------ ---------- ---------- ----- --------- ---------
   2 [0xb6dff3][0x0],[TM][ext 0x0,0      20444 GRANTED        1 KJUSERCW  KJUSERCW
   1 [0xb6dff3][0x0],[TM][ext 0x0,0      21877 GRANTED        0 KJUSERCW  KJUSERCW
In summary, in a RAC database, both TX and TM resources are used to implement the row-level locking scheme, a scheme similar to the single-instance database locking scheme. While it is possible to understand row-level locks by querying the gv$lock family of views, it is a better practice to review GRD-level locks also.
Table 11-2 provides a few common reasons for TX enqueue contention and possible causes that can help you to resolve the contention.
Table 11-2. TX Lock Contention and Modes

TM resource and enqueue protects table-level concurrency, as we saw in the previous section. To further your understanding of TM resource contention, I will create TM enqueue contention and review the resource structures.
In Listing 11-6, I explained how TM locks are acquired to implement row-level locking strategy. I will continue with the same setup as a starting point for this example. While session 12229 is waiting to lock a row, I will try to lock the table in exclusive mode from a different session connected to instance 3. Since the request mode is incompatible with other existing locking modes, session 3 will wait for the lock to be available.
REM This listing continues from Listing 11-4.
REM From session 3, we will try to lock the table.
SQL> lock table t1 in exclusive mode;
...
REM From another session, let’s review resources and locks.

SQL> SELECT DISTINCT '[0x'
    ||trim(TO_CHAR(object_id, 'xxxxxxxx'))
    ||'][0x'
    || trim(TO_CHAR(0,'xxxx'))
    || '],[TM]' res
FROM dba_objects WHERE object_name=upper('&objname');
RES
---------------------------
[0xb6dff3][0x0],[TM]
Output of gv$ges_resource shows that resource is set up in all instances.
SQL> SELECT inst_id, resource_name, master_node
     FROM gv$ges_resource WHERE resource_name LIKE '[0xb6dff3][0x0],[TM]%' ;

Inst RESOURCE_NAME                  MASTER_NODE
---- ------------------------------ -----------
   1 [0xb6dff3][0x0],[TM][ext 0x0,0           0
   2 [0xb6dff3][0x0],[TM][ext 0x0,0           0
   3 [0xb6dff3][0x0],[TM][ext 0x0,0           0
Further, from the output of gv$ges_enqueue, we can see that Process with PID 404 is requesting a lock on the resource [0xb6dff3][0x0],[TM] in KJUSEREX mode. Since that resource is already held by other two processes in KJUSERCW mode (which is incompatible with KJUSEREX mode), PID 404 is waiting for the lock to be available. State of the lock for PID 404 is set to OPENING, indicating that lock is not granted yet.
col state format a10
col inst_id format 99 head Inst
col owner_node format 99 head 'Owner|Node'

SQL> SELECT inst_id, resource_name1, pid, state,
            owner_node , grant_level, request_level
     FROM gv$ges_enqueue
     WHERE resource_name1 LIKE '[0xb6dff3][0x0],[TM]%' ;
                                                          Owner
Inst RESOURCE_NAME1                        PID STATE       Node GRANT_LEV REQUEST_L
---- ------------------------------ ---------- ---------- ----- --------- ---------
   1 [0xb6dff3][0x0],[TM][ext 0x0,0      21877 GRANTED        0 KJUSERCW  KJUSERCW
   2 [0xb6dff3][0x0],[TM][ext 0x0,0      20444 GRANTED        1 KJUSERCW  KJUSERCW
   3 [0xb6dff3][0x0],[TM][ext 0x0,0        404 OPENING        2 KJUSERNL  KJUSEREX
Reviewing the output of ges_blocking_locks.sql script, we can identify that SID 8013 is requesting the lock in KJUSEREX mode and waiting on event “enq: TM – contention.”
INST_ID                       : 3
RESOURCE_NAME1                : [0xb6dff3][0x0],[TM][ext 0x0,0
GRANT_LEVEL                   : KJUSERNL
REQUEST_LEVEL                 : KJUSEREX
STATE                         : OPENING
SID                           : 8013
EVENT                         : enq: TM - contention
SEC                           : 3516
Table 11-3 lists the most commonly seen TM resource request modes in a typical application life cycle. This table also guides common solutions to the locking contention with the listed request modes.
Table 11-3. TM Lock Contention and Modes
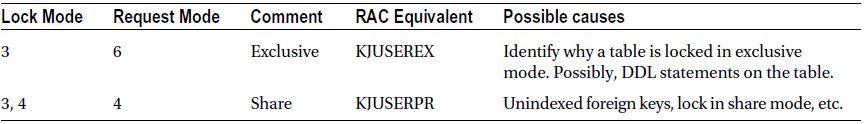
High-Water Mark (HWM) of a segment indicates the highest-ever used block of that segment; essentially, a marker between used space and unused space. Full Table Scan access path reads all blocks below HWM. During a DML operation, to populate rows, new blocks may need to be formatted and that would require HWM to be increased. Changes to the HWM are performed under the protection of HW enqueues. During excessive concurrent insert/update workload, processes can wait for HW enqueue contention.
![]() Note HWM is increased five blocks at a time. Undocumented parameter _bump_highwater_mark controls the number of blocks to increase. There is no reason to modify this parameter for normal workload, though.
Note HWM is increased five blocks at a time. Undocumented parameter _bump_highwater_mark controls the number of blocks to increase. There is no reason to modify this parameter for normal workload, though.
Since HW enqueues are also globalized in a RAC environment, HW enqueue contention can be magnified. Generally, this problem is not prevalent in ASSM tablespaces. If you encounter HW enqueue contention in an ASSM tablespace, then that would generally indicate that the object growth rate is higher than the speed of ASSM metadata manipulation. You might have to either preallocate the extents or partition the object to reduce the severity of HW enqueue contention.
There are a few common reasons for HW contention:
- Heavy insert activity in to a non-partitioned table: Numerous processes insert in one segment and that segment grows by leaps and bounds, leading to contention issues with HW enqueues. Partitioning the table is a better practice, so that pressure on HW enqueue is distributed across many segments.
- Indexes splitting and growing faster: Determine if indexes are needed during insert activity. If so, hash partitioning indexes might be helpful.
- Prior to Oracle Database 10g, LOB column segments were extended one block at a time. This bug has been fixed in Oracle Database version 11g, and so upgrading to the latest version is useful to resolve the problem if the segment is a LOB segment.
DFS stands for Distributed File System, an older name from Oracle Parallel Server (predecessor to Oracle RAC) versions. However, in RAC, this wait event is overused in various contexts. For example, DFS lock handle mechanism is also used to trigger a predefined action, such as global checkpoint, in an instance background process (both remote and local instances).
Consider a DDL statement truncating a table T1. Table blocks of T1 can be resident in the buffer cache of any instance. So, before the truncate statement is successful, buffers belonging to that table must be invalidated4 from all instances. This invalidation would require a message to be sent to the remote DBW process, and that communication mechanism is implemented using DFS lock handle mechanism. Essentially, requesting a lock handle on a lock type will trigger predefined action in the background process indirectly. While the background process is working to complete the triggered action, foreground process is instrumented to wait on DFS lock handle wait event. The exact sequence of messaging between the background processes is version dependent and so, we will see only practical methods to debug “DFS lock handle” waits.
A resource and lock lurks underneath DFS lock handle mechanism. To understand the root cause of DFS lock handle waits, you need to identify the resource type and mode requested. In Listing 11-7, a line from a SQL trace file is shows a wait time of 4.6 ms for DFS lock handle wait event. Attribute p1 of the event is set to 1398145029. That innocuous-looking number can be used to understand more details. Hexadecimal representation of 1398145029 is 0x53560005. The first part of the string 5356 represents the lock type in ASCII format. In this example, the value of 53 maps to ASCII character S, and the value of 56 maps to ASCII character V; therefore, 5356 represents lock type SV. Lock mode is 0005, which is KJUSERPW mode. Listing 11-7 also provides a SQL statement to convert the value of p1 from decimal to lock type and mode.
Listing 11-7. DFS Lock Handle Trace File Output
REM A line from a trace file.
nam='DFS lock handle' ela= 4362 type|mode=1398145029id1=86033 id2=0 obj#=-1 ...

SQL> SELECT chr(bitand(&&p1,-16777216)/16777215) || chr(bitand(&&p1,16711680)/65535) type,
     mod(&&p1, 16) md
     FROM dual
/
Enter value for p1: 1398145029
TY MD
-- ----------
SV 5
You can query v$lock_type to understand the functionality of a lock type. In this example, SV lock type is used for Sequence Ordering, and id1 column value indicates the object_id. Lock type SV will be covered later in this chapter.
exec print_table ( 'select * from v$lock_type where type=''SV''');
TYPE                          : SV
NAME                          : Sequence Ordering
ID1_TAG                       : object #
ID2_TAG                       : 0
IS_USER                       : NO
DESCRIPTION                   : Lock to ensure ordered sequence allocation in RAC mode
After identifying the lock type and mode, you can probe further to understand the root cause of DFS lock handle contention. In the next section, I will probe individual lock types and discuss practical methods to resolve the locking contention.
As discussed in the preceding section, SV enqueue is used for sequence-related actions. Each instance caches sequence values in SGA. In RAC, due to instance-level caching, queried sequence values may not correlate well with time-based column values. Designers typically tend to resolve this problem by creating sequences with nocache or ORDER attributes.
The CACHE attribute of a sequence dictates that sequence values are cached in instance SGA. The ORDER attribute of a sequence dictates that values will be retrieved in strict sequential order. Every retrieval from a sequence with ORDER NOCACHE attribute modifies the seq$ dictionary table to guarantee a strict sequential order. This method of retrieval leads to excessive amount of “row cache lock” waits (changes to data dictionary tables require row cache locks to be held) and global cache wait events.
If a sequence is defined with ORDER CACHE attributes, then GES layer is used to maintain the strict sequential order. Essentially, DFS lock handle mechanism with an SV resource is used for this purpose. To explain DFS lock handle contention for SV resource, I will create a sequence T1_SEQ with ORDER and CACHE attributes. Then, I will access the sequence a few times and increase the sequence value to 9.
REM Create a sequence with cache and order attributes.
create sequence T1_SEQ order cache 100;

SQL> select t1_seq.nextval from dual;

   NEXTVAL
----------
         1
...

REM selecting couple of times from this sequence from two nodes to bump up the value to 9
REM Note: Not all SELECT statements are printed for brevity.
SQL> select t1_seq.nextval from dual;

   NEXTVAL
----------
         9
Resources created in GRD for sequences with CACHE ORDER attributes uses the familiar naming pattern discussed earlier in this chapter. Object_id of the sequence and SV lock type is used to fabricate a resource name.5 In this example, resource_name is [0xb6e64b][0x0],[SV]; the first part of the string, 0xb6e64b, is object_id of the sequence in hexadecimal format; the second part of the string is set to 0 (not applicable to SV resource types); and the third part of the string is SV, indicating the resource type. The following query shows the SV resource_name for the T1_SEQ sequence.
REM query gv$ges_resource to identify the resource name.
col res  new_value resource_name

SELECT DISTINCT '[0x'
    ||trim(TO_CHAR(object_id, 'xxxxxxxx'))
    ||'][0x'
    || trim(TO_CHAR(0,'xxxx'))
    || '],[SV]' res
FROM dba_objects WHERE object_name=upper('&objname')
     AND owner=upper('&owner') AND object_type LIKE 'SEQUENCE%'
/
Objname: T1_SEQ
Owner: RS
RES
---------------------------
[0xb6e64b][0x0],[SV]
In Listing 11-8, view gv$ges_resource is queried to identify the resources in GRD. Column value of value_blk is of special interest. Column value_blk of the resource holds the current value of the sequence; in this example, notice that the first few bytes of the value_blk are set to 0x82c10b. The second part of that value is c10b, which is the internal representation of value 10. Essentially, value_blk column of SV resource holds current sequence value.
Listing 11-8. Sequence Value and SV Resource
REM Using the derived resource_name, identify all GES resources.

col master_node head 'Mast|node' format 99
col value_blk format a30
SQL> SELECT inst_id, resource_name, master_node, value_blk
     FROM gv$ges_resource WHERE resource_name LIKE '&resource_name%'
/
                                    Mast
Inst RESOURCE_NAME                  node VALUE_BLK
---- ------------------------------ ---- -----------------------------------------
   2 [0xb6e64b][0x0],[SV][ext 0x0,0    2 0x82c10b00000000000000000000000000 .
Oracle Database uses special representation to store the numbers, apparently for cross-platform compatibility reasons. For example, a value of 10 is represented as a two-byte value. The following two SQL statements can be used to identify the internal representation:
SQL> select dump(10) from dual;
DUMP(10)
-------------------
Typ=2 Len=2: 193,11
Converting the values 193 and 11, we get c10b:
select to_char(193,'xx')||to_char(11,'xx') from dual;

TO_CHA
------
 c1  b
RAC background processes coordinate the value_blk column value and return the next value to the foreground process. As expected, locks are also acquired by the background processes on the SV resource. In the following output, PID 24313 has KJUSERNL mode lock, and PID 24313 is LCK0 process.
REM Identify all GES locks for that resource.

col state format a10
col inst_id format 99 head Inst
col owner_node format 99 head 'Owner|Node'

SQL> SELECT inst_id, resource_name1, pid, state, owner_node , grant_level, request_level
     FROM gv$ges_enqueue WHERE resource_name1 LIKE '&resource_name%'
/
                                                          Owner
Inst RESOURCE_NAME1                        PID STATE       Node GRANT_LEV REQUEST_L
---- ------------------------------ ---------- ---------- ----- --------- ---------
   2 [0xb6e64b][0x0],[SV][ext 0x0,0      24313 GRANTED        1 KJUSERNL  KJUSERNL
   3 [0xb6e64b][0x0],[SV][ext 0x0,0       4416 GRANTED        2 KJUSERNL  KJUSERNL
   3 [0xb6e64b][0x0],[SV][ext 0x0,0          0 GRANTED        1 KJUSEREX  KJUSEREX
Let us understand how to identify the object_id associated with DFS lock handle wait event and SV resource type. The first line shows the DFS lock handle wait event. Column id1 in that trace file line shows the object_id of the sequence involved in DFS lock handle contention. Note that the obj# field value from the trace line is not referring to the sequence (as of release 11.2).
nam='DFS lock handle' ela= 827 type|mode=1398145029 id1=11986507id2=0 obj#=-1

col object_name format a30

SQL> SELECT object_name, object_id FROM dba_objects WHERE object_id=11986507
/
OBJECT_NAME                     OBJECT_ID
------------------------------ ----------
T1_SEQ                           11986507
In summary, if the derived lock type from DFS lock handle wait event is SV, then identify the sequence_name and alter the sequence attributes matching with workload. Here are guidelines that will help you to decide the attributes of sequences:
- If the sequence is heavily accessed, alter the sequence cache to upwards of 1000 with no ORDER attribute.
- If the sequence is lightly accessed and if the requirement is to retrieve strictly sequential values, then use ORDER CACHE attribute.
- If there is no requirement for ordered values, then use CACHE without any ORDER attribute.
Enqueues on CI resources are acquired to invoke instance-level action(s) in background processes. For example, truncating a table T1 would require buffers to be flushed from other nodes. So, DBW processes in all nodes must be posted to invalidate buffers in the buffer cache of that table T1. CKPT process coordinates the instance-level actions, and DBW process will do the actual scanning and writes.
ASM instances running in clustered mode use DFS lock handle to coordinate the activity too. For example, the addition of a data file or disk needs to modify extent map in all instances, and that coordination is performed through DFS lock handle mechanism.6,7
I will explain CI enqueues with a small example, by truncating a table with 10046 event trace on. Reviewing the trace file, we can identify the trace line marking the wait for DFS lock handle wait event. A few wait events from the trace file are printed below.
alter session set events '10046 trace name context forever, level 12';
truncate table t1;
alter session set events '10046 trace name context forever, level off';

REM from the trace file
...
nam='DFS lock handle' ela= 844 type|mode=1128857605 id1=13 id2=1 obj#=11984883
nam='DFS lock handle' ela= 914 type|mode=1128857605 id1=13 id2=3 obj#=11984883
nam='DFS lock handle' ela= 8159 type|mode=1128857605 id1=13 id2=2 obj#=11984883
...
Using the SQL statement shown in Listing 11-9, we can identify lock type and lock mode. In this case, lock type is CI and mode is 5.
Listing 11-9. Identify Lock Type from p1.REM Identify Lock Type
SELECT chr(bitand(&&p1,-16777216)/16777215) || chr(bitand(&&p1,16711680)/65535) type,
     mod(&&p1, 16) md
     FROM dual
/
TY         MD
-- ----------
CI          5
There are numerous reasons for DFS lock handle waits with enqueue type of CI. Fortunately, note 34631.1 provides mapping between id1, id2 values and the semantics of the combination, but the list is not complete. You might need to engage Oracle support for further analysis, as performance issues due to CI resource type could be a software bug too.
A quick approach to gain more knowledge about specific id1, id2 value combinations of CI lock type is to identify the background process associated with that resource. Using id1=13 and id2=2, we can coin a resource name as [0xd][0x2],[CI] and search in gv$ges_enqueue view. In Listing 11-10, PID 23557 in node 2 is a DBW process holding locks on this resource. You can make an educated guess about the problem with SQL statement affected and the background process involved.
Listing 11-10. Resources with CI Enqueue
SELECT resource_name1, inst_id, pid, blocker, blocked
FROM gv$ges_enqueue
WHERE resource_name1 LIKE '%[0xd][0x2],[CI]%'
/
RESOURCE_NAME1                    INST_ID        PID    BLOCKER    BLOCKED
------------------------------ ---------- ---------- ---------- ----------
[0xd][0x2],[CI][ext 0x0,0x0]            2      23557          0          0
[0xd][0x2],[CI][ext 0x0,0x0]            3       4213          0          0
[0xd][0x2],[CI][ext 0x0,0x0]            1      10753          0          0
A few ASM-related CI events are printed in Table 11-4. For example, “ASM map resize message” event will use the resource [0x2a][0x0],[CI], where 0x2a is the hexadecimal representation of 42. These resources will be visible in ASM instance(s).
Table 11-4. ASM-Specific CI – id1
| CI – id1 | Meaning in ASM instance |
|---|---|
| 42 | ASM map resize message |
| 43 | ASM map lock message |
| 44 | ASM map unlock message (phase 1) |
Events for ASM-related operations are usually short-lived. However, when you are add a new datafile to a tablespace or extend a datafile, in a database with higher activity, then ASM-related wait events will be prominent.
Note that, usually, DFS lock handle contention with CI as resource type is just a symptom of another root cause lurking underneath. For example, excessive truncates of tables in huge buffer caches induce DFS lock handle contention with CI resource type. The root cause in that example is excessive truncation, and use of global temporary table is a recommended approach. So, to resolve DFS lock handle contention, you must understand the root cause before resolving the contention. Also, it is important to realize that every instance will have some DFS lock handle contention and only when the time spent waiting for DFS lock handle contention is a major contributor of wait time should you worry about the contention.
DFS Lock Handle Summary
Table 11-5 lists few common enqueue types associated with DFS lock handle mechanism. It is out of scope to discuss every DFS lock handle enqueue type.
Table 11-5. DFS Lock Request—Enqueue Types
| Enqueue | Comment | Possible reason |
|---|---|---|
| SS | Sort Segment | Drop of sort segment or temporary tablespace configuration issues. |
| IV | Invalidation | Object invalidation due to a DDL statement. |
| CI | Cross Invocation | Many possible reasons. Check note 34631.1. |
Library cache locks protect library cache objects from concurrent modifications, and library cache pins protect a library cache object while that library object is busy in execution. In a single-instance database, parse locks on a SQL statement (cursors) implicitly acquire library cache locks on dependent objects. For example, when a table is altered then the library cache object for that table will be invalidated. That invalidation would recursively invalidate dependent cursors, requiring cursors to be reparsed on subsequent execution.
In a RAC database, dependency between the cursors and objects must be maintained globally. Local library cache locks are not sufficient to maintain the global dependency. For example, if you alter a table in instance 1, then all packages and cursors dependent upon the table must be invalidated in all instances. This invalidation is needed to trigger an automatic recompilation of library cache objects in the subsequent execution of cursors.
Global dependency for library cache object is maintained through GRD resources and locks. Library cache locks are globalized as resource types in the range of LA through LP, and library cache pins are globalized as NA through NZ types of resources. I will explain the global locks with an example. In Listing 11-11, a PL/SQL block is creating a dynamic SQL statement joining table T_LIBTEST 1024 times, and then parses the statement calling dbms_sql package. This example is artificial and serves no real-world purpose other than to show the use of GRD resources and locks.8
Listing 11-11. Library Cache Lock and Pin
REM create a table
CREATE TABLE t_libtest (n1 NUMBER );

REM dynamically populate a CLOB variable and try to parse it.
DECLARE
  v_sqltext CLOB;
  c1 NUMBER ;
BEGIN
  v_sqltext:= ' select a0.* from t_libtest a0';
  c1       := dbms_sql.open_cursor;
  FOR i    IN 1 .. 1024
  LOOP
    v_sqltext := v_sqltext ||' , t_libtest a'||i;
  END LOOP;
  dbms_output.put_line(v_sqltext);
  dbms_sql.parse( c1, v_sqltext, dbms_sql.native);
END;
/
GRD uses first 16 bytes of name hash value of the library cache object to construct a resource_name. The following SQL statement uses that algorithm to construct resource_name for library cache objects. I will use the resource_name constructed as follows to query gv$ views.
col res format a30
col owner format a30
col objname format a30
SELECT '[0x' || SUBSTR(kglnahsv, 1,8) || '][0x'|| SUBSTR(kglnahsv, 9, 8) || ']' res,
 kglnaown owner, kglnaobj objname
FROM x$kglob WHERE kglnaobj LIKE upper('&objname');

Enter Objname: T_LIBTEST
RES                            OWNER                          OBJNAME
------------------------------ ------------------------------ ------------------------------
[0xd9bcbc52][0xb0a18d29]       APPS                           T_LIBTEST
In Listing 11-12, cursor c1 derives resource_name using the kglnahsv column from x$kglob table (Fixed table x$kglob keeps all library cache objects, and kglnashv column shows the name hash value). Using the derived resource_name, cursor c2 searches gv$ges_resource to identify the resources, and cursor c3 searches gv$ges_enqueue to identify locks associated with the resource_name.
Listing 11-12. Library Cache Lock Resources
SET serveroutput ON size 1000000
DECLARE
BEGIN
  FOR c1 IN
  (SELECT '[0x'|| SUBSTR(kglnahsv, 1,8) || '][0x'|| SUBSTR(kglnahsv, 9, 8)|| ']' res,
           kglnaown owner, kglnaobj objname
   FROM x$kglob WHERE kglnaobj LIKE upper('&objname')
  )
  LOOP
    dbms_output.put_line ('-------------------');
    dbms_output.put_line ('Object Details...' || c1.owner||'.'|| c1.objname);
    dbms_output.put_line ('-------------------');
    dbms_output.put_line ('-------------------');
    dbms_output.put_line ('Resource details...');
    dbms_output.put_line ('-------------------');
    FOR c2 IN
    (SELECT resource_name, master_node FROM v$ges_resource
     WHERE resource_name LIKE '%'||c1.res||'%'
    )
    LOOP
      dbms_output.put_line ('Resource name '|| c2.resource_name ||
                                 ', Master '||c2.master_node );
    END LOOP;
    dbms_output.put_line ('-------------------');
    dbms_output.put_line ('Lock details...');
    dbms_output.put_line ('-------------------');
    FOR c3 IN
    (SELECT resource_name1, transaction_id0, pid,
      state, owner_node, grant_level
    FROM v$ges_enqueue WHERE resource_name1 LIKE '%'||c1.res ||'%'
     )
    LOOP
      dbms_output.put_line ('Res name '|| c3.resource_name1 || ', owner '||c3.owner_node );
      dbms_output.put_line ('...Transaction_id0 '|| c3.transaction_id0 ||
                       ',Level '||c3.grant_level|| ' State ' || c3.state );
    END LOOP;
  END LOOP;
END;
/
Refer to the output of Listing 11-12 printed in the following section: There are two types of resources—LB and NB types—for the library cache object of T1_LIBTEST table. Output from gv$ges_enqueue shows that locks are acquired by instance 1 in KJUSERPR mode while parsing the statement. LB resource type represents the global resource for library cache lock on table T1_LIBTEST, and NB resource type represents the global resource for library cache pin on table T1_LIBTEST.
Searches gv$ges_enqueue to identify locks associated with the resource_name.
-------------------
Object Details...APPS.T_LIBTEST
-------------------
Resource details...
-------------------
Resource name [0xd9bcbc52][0xb0a18d29],[LB][, Master 2
Resource name [0xd9bcbc52][0xb0a18d29],[NB][, Master 2
-------------------
Lock details...
-------------------
Res name [0xd9bcbc52][0xb0a18d29],[LB][, owner 1
...Transaction_id0 131479,Level KJUSERPR ,State GRANTED
Res name [0xd9bcbc52][0xb0a18d29],[NB][, owner 1
...Transaction_id0 131479,Level KJUSERPR ,State GRANTED
Troubleshooting Library Cache Lock Contention
It is crucial to understand how library cache locks and resources are globalized in a RAC database, and the preceding section provided a foundation. In this section, I will create a library cache lock and library cache pin contention to show a method to troubleshoot the contention.
I will use the script in Listing 11-11 that joins a table 1,024 times to create a library cache lock contention. From session 1, I will execute a script. While session 1 is executing the script, I will try to alter table t_libtest to add a column from session 2. A column cannot be added since the first session has not released the global lock yet, and session 2 will wait for the first session to complete.9
REM from session #1
@listing_11_10.sql

REM from session #2
Alter table t_libtest add (n3 number);
<.. this session wait..>
Let us inspect global locks and wait events. Session 8075 is waiting for library cache lock wait event. This wait event is a bit misleading, since the actual wait is for global lock.
SELECT sid, SUBSTR(event, 1, 28) event, state, seconds_in_wait wis
FROM v$session
WHERE state='WAITING'
AND event LIKE 'library cache%';

   SID EVENT                          STATE             WIS
------ ------------------------------ --------------- -----
  8075 library cache lock             WAITING           165
Output of ges_blocking_locks.sql script is printed in the following section. From the output, session 11296 is holding a lock on resource [0xad07b0f5][0x339db0c8],[LB] in KJUSERPR mode, while session with SID 8075 is waiting to lock the same resource in KJUSEREX mode. Session 8075 is requesting the lock in exclusive mode since the DDL statement on a table must invalidate dependent library cache locks.
SQL>@ges_blocking_locks.sql

INST_ID                       : 2
RESOURCE_NAME1                : [0xad07b0f5][0x339db0c8],[LB][
GRANT_LEVEL                   : KJUSERPR
REQUEST_LEVEL                 : KJUSERPR
STATE                         : GRANTED
SID                           : 11296
EVENT                         : Disk file operations I/O
SEC                           : 197
--------------------------------------------------------------
INST_ID                       : 2
RESOURCE_NAME1                : [0xad07b0f5][0x339db0c8],[LB][
GRANT_LEVEL                   : KJUSERNL
REQUEST_LEVEL                 : KJUSEREX
STATE                         : OPENING
SID                           : 8075
EVENT                         : library cache lock
SEC                           : 186
In RAC, it is hard to debug the library cache lock and library cache pin contention using traditional methods. It is easier to debug the contention by reviewing global locks. Script ges_blocking_locks.sql comes in handy to understand holders and waiters of GRD locks.
There are a few enqueue statistics maintained by Oracle database related to global lock activity. AWR report also calculates the average enqueue time using these statistics. A few lines from AWR report are given in the following output, showing that the average global enqueue time is 0.1 ms.
Global Cache and Enqueue Services—Workload Characteristics
------------------------------------------------------------
                  Avg global enqueue get time (ms):      0.1
Three statistics are used in the calculation of this average: “global enqueue get time,” “global enqueue get async,” and “global enqueue gets sync.” The global enqueue get time statistic maintains the total time spent waiting for global locks; global enqueue gets async maintains the total number of async gets (mostly by background processes); and global enqueue gets sync maintains the total number of sync gets (mostly by foreground processes).
Sum of the values of global enqueue get async and global enqueue get sync is the total number of enqueue gets. Average global enqueue time is calculated by dividing global enqueue get time by total number of enqueue gets.
It is very important to realize that Avg global enqueue get time is an average at an instance level. So, you need to identify specific locks involved in the locking contention to troubleshoot elevated global enqueue get time. The value of Avg global enqueue get time is merely an indicator about locking efficiency. Higher values for the statistics imply that there was a locking contention during that AWR sample period.
Here is an example analysis from a production problem. As you can see, Avg global enqueue get time is very high.
Global Cache and Enqueue Services—Workload Characteristics
------------------------------------------------------------
                  Avg global enqueue get time (ms):    419.7
Reviewing the foreground wait events section, you will realize that there is no locking contention that can justify elevated global enqueue get time. But, in RAC, library cache locks are globalized as global locks, and so waits for the GRD locks are counted toward global enqueue get time statistics.
                                                     Avg
                                        %Time Total Wait    wait    Waits   % DB
Event                             Waits -outs   Time (s)    (ms)     /txn   time
-------------------------- ------------ ----- ---------- ------- -------- ------
library cache lock                5,446     0    456,860   83889      0.0  111.3
library cache: mutex X           11,668     0      5,483     470      0.1    1.3
latch: ges resource hash l        5,915     0      2,462     416      0.0     .6
...
View v$wait_chains is another useful view that can be used to identify locking contention quickly. This view retrieves rows from all instances, and so, there is no global counterpart for this view.
Essentially, v$wait_chains stores wait-for-graph as a chain and then identifies if there is any cycle in the chain. The usefulness of this view stems from the fact that locking contention is usually very complex in a high-end production environment. You are looking for just one blocker to terminate so that the application can continue processing normally. The following SQL statement queries v$wait_chains and prints the waits in a tree format to identify the blockers quickly.
col ses format a15
set lines 180
WITH blocked AS
      (SELECT * FROM
        (SELECT instance, sid, sess_serial#, blocker_instance,
          blocker_sid, blocker_sess_serial#, level lv,
          num_waiters, blocker_chain_id
         FROM v$wait_chains
          CONNECT BY PRIOR sid        = blocker_sid
          AND PRIOR sess_serial#      = blocker_sess_serial#
          AND PRIOR INSTANCE          = blocker_instance
          START WITH blocker_is_valid = 'FALSE'
        )
      WHERE num_waiters >0 OR blocker_sid   IS NOT NULL
      )
    SELECT instance,
      LPAD(' ', 2*(lv-1)) ||b.sid ses, b.sess_serial#,
      b.blocker_instance, b.blocker_sid, b.blocker_sess_serial#
    FROM blocked b
/
                                      Blocker Blocker    Blocker
  INSTANCE SES             Serial#   Instance     sid    serial#
---------- --------------- ------- ---------- ------- ----------
         1 10127             43405
         1   6374            27733          1   10127      43405
         1     1421          24393          1    6374      27733
The preceding output shows a wait-for-graph of 1421 → 6374 → 10127. So, we may have to terminate session 10127 to clear the locking contention.
Hanganalyze can also be used to identify chains. The hanganalyze command essentially goes through chain of waiters to identify if there is a process blocking all other sessions. In RAC, you need to take concurrent hanganalyze dumps using –g all option, as shown in the following.
SQL> oradebug setmypid
SQL> oradebug  -g all hanganalyze 10
Hang Analysis in /u01/app/product/rdbms/diag/cdb12/cdb12_diag_11019.trc
The DIAG process will generate trace file wait cycle information. The following trace file shows a sample of a DIAG trace file.
-------------------------------------------------------------------------------
Chain 1:
-------------------------------------------------------------------------------
    Oracle session identified by:
    {
                instance: 1 (prod.prod1)
                   os id: 26698
              process id: 7322, oracle@racdb1
              session id: 2066
    session serial #: 26535
Hanganalyze trace file is self-explanatory, and by following the chain of waits, you can identify the process blocking all other processes.
A deadlock occurs if two or more transactions are waiting for resources locked by each other. In a single-instance database, sessions waiting for a lock will execute a small piece of code known as deadlock detection algorithm, to check if there is a deadlock. The deadlock detection algorithm checks if a session is repeated in a waiter-holder tree. If a session is seen again in the locking hierarchy, then it would indicate that there is a deadlock and current session aborts the statement to resolve the deadlock.
In a single-instance database, waiters and holders are visible to every session connected to the database. So, a foreground process can perform deadlock detection. In RAC, waiters and holders may be in different instances, and all necessary data for deadlock detection is not available to the foreground processes. So, LMD background process performs deadlock detection in a RAC database.
I will explain the deadlock detection with a simple test case. From two sessions connected to two different instances, I will update two rows in a table.
REM From session 1 connected to instance 1
UPDATE t1 SET n1=n1 WHERE n1=100;
1 row updated.
REM From session 2 connected to instance 2
UPDATE t1 SET n1=n1 WHERE n1=200;
1 row updated.
Next, I will update the row where n1=200 from session 1 and update the row with n1=100 from session 2. After the update, since these two sessions are waiting for each other, we induce conditions for deadlock.
REM From session 1
UPDATE t1 SET n1=n1 WHERE n1=200;
<..session waiting..>

REM From session 2
UPDATE t1 SET n1=n1 WHERE n1=100;
<.. session waiting..>
At this time, both sessions are waiting for each other, a classic behavior of a deadlock. Figure 11-2 shows the deadlock issue.

Figure 11-2. Deadlock between two sessions
The deadlock detection algorithm executed by LMD process will detect deadlocks in nearly 10 seconds. After 10 seconds of lock wait, a waiting session is chosen and the statement is rolled back.
update t1 set n1=n1 where n1=200
*
ERROR at line 1:
ORA-00060: deadlock detected while waiting for resource

Elapsed: 00:00:09.59
![]() Note Deadlock detection is performed in ∼10 seconds from Oracle Database version 11g onward. In version 10g, deadlock detection can take 60 seconds. Parameter _lm_dd_interval controls this behavior. Of course, there is no reason to adjust this parameter though. In single-instance database, deadlock detection routine is executed every 3 seconds, and therefore deadlock will be detected in 3 seconds.
Note Deadlock detection is performed in ∼10 seconds from Oracle Database version 11g onward. In version 10g, deadlock detection can take 60 seconds. Parameter _lm_dd_interval controls this behavior. Of course, there is no reason to adjust this parameter though. In single-instance database, deadlock detection routine is executed every 3 seconds, and therefore deadlock will be detected in 3 seconds.
In a single-instance database, a deadlock trace file is written by the foreground process, but in a RAC database as deadlocks are detected by LMD processes, you must review LMD trace file to understand the root cause of a deadlock.
Information written by the LMD processes to trace files follows a specific format. LMD process detecting deadlock writes resource and lock details in its own trace file. In addition, LMD processes running in other nodes are requested to dump details about holders and waiters of resources and locks involved in the deadlocks from their respective nodes. This coordinated dump by LMD processes is written to their own trace files, and so it is important to review LMD trace files from all instances at the same time to gain full insight into the deadlock issue.
LMD trace file dumps for deadlocks follow a general structure outlined in Figure 11-3. The first section prints resource details, queue details, and a summary of lock structures in the queue. Then, details about each of these lock structures are printed. If the lock structure is in local instance, then process such as program, user name, etc., are printed along with the lock details.

Figure 11-3. LMD trace file structure
Now, let me explain the details about each of these sessions. The following lines show the starting point for this resource dump in node 2 after a deadlock detection event. LMD process detecting the deadlock is starting to write deadlock information:
*** 2012-10-06 15:37:08.013

Global blockers dump start:---------------------------------
DUMP LOCAL BLOCKER/HOLDER: block level 5 res [0x1650015][0x351eac],[TX][ext 0x0,0x0]
Nearly at the same time, the following lines are written to LMD trace files in node 1, indicating that a dump request was received by the LMD process in node 1 to dump details about resource and lock structures.
*** 2012-10-06 15:37:08.018
ENQUEUE DUMP REQUEST: from 2 spnum 12 on [0x1650015][0x351eac],[TX][ext 0x0,0x0] for reason 3
DUMP LOCAL BLOCKER/HOLDER: block level 5 res [0x1650015][0x351eac],[TX][ext 0x0,0x0]
The first section of the dump file prints the resource details. In this case, the resource is a TX resource; as we discussed earlier in this chapter, row-level locks are implemented through TX resources. The next three lines show details about the local instance, directory instance, and master instance. The master instance is the resource master instance.
----------resource 17cfa16ca0----------------------
resname       : [0x1650015][0x351eac],[TX][ext 0x0,0x0]
hash mask     : x3
Local inst    : 1
dir_inst      : 1
master_inst   : 1
...
The following few lines show existing grants on that resource. Count line indicates number of locks in that mode. In this example, there is a NULL mode and an exclusive mode lock on this resource. Value block from the resource is also printed. Generally, value block is not useful for debugging deadlocks though.
grant_bits    : KJUSERNL KJUSEREX
grant mode    : KJUSERNL  KJUSERCR  KJUSERCW  KJUSERPR  KJUSERPW  KJUSEREX
count         : 1         0         0         0         0         1
val_state     : KJUSERVS_NOVALUE
valblk        : 0x000000010c2799280000000000000000 .'(
...
Continuing the discussion, one lock has been granted and one lock is waiting as Cvting_locks is set to 1 and Granted_locks is also set to 1.
Granted_locks : 1
Cvting_locks  : 1
value_block:  00 00 00 01 0c 27 99 28 00 00 00 00 00 00 00 00
The following few lines show processes in the queue. The Granted_Q section prints the details about locks currently held on the resource. Possible PID 13787 is holding an exclusive mode lock on this resource. Convert_Q section prints the details about process waiting in the converting queue. Notice that there is no PID or XID information printed in this lock structure, as that information is not available in the local node. You will need to refer to the remote node LMD trace file to identify that information.
GRANTED_Q :
lp 1657e67440 gl KJUSEREX rp 17cfa16ca0 [0x1650015][0x351eac],[TX][ext 0x0,0x0]
master 1 gl owner 1753f447f8 possible pid 13787 xid 1007-0078-00001FF1 bast 0 ..
open opt KJUSERDEADLOCK

CONVERT_Q:
lp 16112f5ec8 gl KJUSERNL rl KJUSEREX rp 17cfa16ca0 [0x1650015][0x351eac],[TX]..
   master 1 owner 2  bast 1 rseq 43 mseq 0x40001 history 0xd497adaa
   convert opt KJUSERGETVALUE
The next section in the LMD trace file prints information about lock structures. Detail printed in this section is more complete if the lock is held by a local session. Again, by assembling data from all nodes of LMD trace files, you can get a complete picture about the deadlock issue.
The following section prints the data from enqueue structures. You can map lock pointers in the convert_q or grant_q in the resource details section to the lock details section. In this example, lock 1657e67440 is holding the lock and listed in grant_q section. This lock is also granted in exclusive mode as the grant_level is set to KJUSEREX. Process with PID 13787 is holding the lock in exclusive mode.
----------enqueue 1657e67440------------------------
lock version     : 185
Owner inst       : 1
grant_level      : KJUSEREX
req_level        : KJUSEREX
bast_level       : KJUSERNL
notify_func      : 0
...
possible pid     : 13787
xid              : 1007-0078-00001FF1
...
lock_state       : GRANTED
ast_flag         : 0x0
Open Options     : KJUSERDEADLOCK
...
Session-level details are also printed. Details such as program, username, application name, etc., will be useful in understanding the deadlock issues. Finally, SQL statement involved in the deadlock is also printed to debug the deadlock further.
user session for deadlock lock 0x1657e67440
  sid: 11303 ser: 58495 audsid: 4294967295 user: 0/SYS
    flags: (0x41) USR/- flags_idl: (0x1) BSY/-/-/-/-/-
    flags2: (0x40009) -/-/INC
  pid: 120 O/S info: user: oracle, term: UNKNOWN, ospid: 13787
    image: oracle@rac1 (TNS V1-V3)
client details:
O/S info: user: oraperf, term: pts/3, ospid: 13786
machine: wsqfinc1a program: sqlplus@wsqfinc1a (TNS V1-V3)
application name: sqlplus@wsqfinc1a (TNS V1-V3), hash value=321046474
current SQL:
  update t1 set n1=n1 where n1=200
In a nutshell, deadlock details are printed in LMD trace files. To better understand the root cause of deadlocks, assemble the sections from LMD trace files from all nodes at the time of deadlock. By reviewing details, you can identify the root cause of a deadlock.
Initially, LMD trace file details are overwhelming, since a huge amount of information is dumped to the trace file. You can use this chapter to understand the trace file contents and identify SQL statements and the processes suffering from deadlock. This approach should lead to a faster resolution of deadlocks.
Summary
Resources and locks are maintained in GRD by the GES layer of RAC code. This globalization of resources allows RAC to coordinate changes to the resources. By reviewing GES layer views, you can understand the root cause of the locking contention and resolve performance issues. In addition, the LMD process prints essential details in a trace file, and the analysis of LMD trace files should lead to quicker root cause analysis.
1 In version 12c, the pluggable database feature is introduced. GES and GCS services are common services for both pluggable databases and container databases, meaning both memory and background processes are shared between container and plugged databases. So, structures discussed in this chapter have a new column, con_id, to support the pluggable database feature.
2 Required increase in shared_pool_size depends upon your SGA size, current shared_pool size, Database software version, etc. However, a 20% increase in single-instance shared_pool _size and a 10% increase in buffer cache is a good preliminary design. Sandesh Rao, Director of RAC Assurance Team, agrees with this recommendation.
3 This section is mostly academic and merely provided to improve understanding of RAC internal structures. Use of oradebug command in a production environment is not advised, and do not try these commands in a critical database.
4 Exact terminology is Checkpoint Range and Invalidate.
5 In 12c, PDB container_id is also coded in to the resource name.
6 Sandesh Rao points out that any disk group operation such as add disk, drop disks, add files, etc., would trigger DFS lock handle–based concurrency control.
7 This concurrency control is improved in version 12c as concurrent disk group operations can be performed in the same instance.
8 MOS note 122793.1 is also a good document to read about library cache lock contention.
9 Sandesh Rao points out that locking will happen in a single-instance database also, but the difference is that library cache locks and pins have global resources representing them, whereas in a single-instance database, this problem will be visible in x$kgllk and x$kglpn memory views only.