![]()
Index Metadata and Statistics
Now that you understand the logical and physical fundamentals of indexes, you should look at the way in which statistics are stored for indexes. These statistics provide insight into how SQL Server can and is utilizing indexes. It also provides the information needed to decipher why an index may not be selected and how it is behaving. This chapter will provide you with a deeper understanding about where and how this information is collected. You’ll investigate some additional DBCC commands and dynamic management objects (DMOs) that are available and see how that information comes to be.
There are four domains of information that the statistics in this chapter will cover. The first domain is column-level statistics. This provides the query optimizer with information on the population of data within a column and, thus, an index. The next domain is index usage statistics. Information here provides insight into whether and how an index is being used. The third domain is operational statistics. This information is similar to usage statistics but provides deeper insight. The last domain of information is physical statistics, and it provides insight into the physical characteristics of the index and how the index is distributed within the database.
Additionally, in this chapter, you’ll review the metadata that is available on columnstore indexes and learn what information is collected. This information provides an understanding of what is being stored by the columnstore index and how it might impact the performance of queries against columnstore indexes.
Let’s begin by looking at the first domain of statistic information, index-level statistics. This area is one of the most important within SQL Server when it comes to indexes. Index-level statistics provide information on how data is distributed within an index. SQL Server uses this information to determine the anticipated frequency and distribution of values within an index; this is referred to as cardinality.
Through cardinality, the query optimizer develops cost-based execution plans to find the best execution plan for executing the submitted request. If the statistics for an index are incorrect or no longer represent the data in the index, then the plan that is created will, likely, be inefficient. It is important to understand and be able to interact with statistics to be certain that indexes in your environment not only exist but also provide their expected benefits.
There are many ways to interact with statistics within SQL Server. You’ll review some of the most common mechanisms in the sections to follow. With each of these methods, you’ll look what they are, what they provide, and the value in using each method.
DBCC SHOW_STATISTICS
The first, and likely most familiar, way to interact with statistics is through the DBCC command SHOW_STATISTICS. This command will return the statistics for the requested database object, either a table or an indexed view. The information returned is a statistics object that includes three different components: the header, the histogram, and the density vector. Each of these components provides SQL Server with an understanding of the data available in the index.
Returning the statistics object can be done with the DBCC syntax in Listing 3-1. This syntax accepts the name of the table or indexed view for the statistics, and then the target is returned. The target is either the name of the index or the column-level statistics that were created.
There are four options that can be included with the DBCC command: NO_INFOMSGS, STAT_HEADER, DENSITY_VECTOR, and HISTOGRAM. Any or all of these options can be included in a comma-separated list.
The option NO_INFOMSGS suppresses all informational messages when the DBCC command is executed. These are error messages generated with severity from 0 to 10, with 10 being the highest severity error. In most cases, since these error messages are informational, they are not of value when using this DBCC statement.
The options STAT_HEADER, DENSITY_VECTOR, and HISTOGRAM limit the output from the DBCC command. If one or more of the options are included, then only the statistics components for the items included will be returned. If none of these is selected, then all the components are included.
With the DBCC command defined, let’s walk through each of the statistics components. Each will be defined, and then an example of their contents from the AdventureWorks2014 database will be explored. The results that you’ll be reviewing can be created with Listing 3-2.
Stats Header
The stats header is the metadata portion of the statistics object. These columns, listed in Table 3-1, are primarily informational. They inform on the number of rows that were considered when building the statistics and how those rows were selected through filtering. Table 3-1 also includes information on when the statistics were last updated, which can be useful when investigating potential issues with the quality of statistics.
Table 3-1. Stats Header Columns from DBCC SHOW_STATISTICS
|
Column Name |
Description |
|---|---|
|
Name |
Name of the statistics object. For index statistics, this is the same name as the index. |
|
Updated |
Date and time that the statistics were last updated. |
|
Rows |
Total number of rows in the table or indexed view when the statistics were last updated. For filtered statistics or indexes, the count pertains to the number of rows that matched the filter criteria. |
|
Rows Sampled |
Total number of rows sampled for statistics calculations. Histogram and density values are estimates when the Rows Sampled value is less than the value in Rows. |
|
Steps |
Number of steps in the histogram. Each step spans a range of column values followed by an upper-bound column value. The histogram steps are defined on the first key column in the statistics. The maximum number of steps is 200. |
|
Density |
Calculated as 1/distinct values for all values in the first key column of the statistics object, excluding the histogram boundary values. As of SQL Server 2008, this value is no longer used by SQL Server. |
|
Average Key Length |
Average number of bytes per value for all the key columns in the statistics object. |
|
String Index |
Indicates whether the statistics object contains string summary statistics to improve the cardinality estimates for query predicates that use the LIKE operator. |
|
Filter Expression |
When populated, this is the predicate for the subset of table rows included in the statistics object. |
|
Unfiltered Rows |
Total number of rows in the table before applying the filter expression. If Filter Expression is NULL, Unfiltered Rows is equal to Rows. |
Reviewing the stats header information for PK_SalesOrderDetail_SalesOrderID_SalesOrderDetailID on Sales.SalesOrderDetail, shown in Figure 3-1, you’ll see a number of items of interest. First, since the Rows and Rows Sampled values are the same, you know that the statistics are not based on estimates. Next, the statistics were last updated on June 29, 2011 (though this value may differ in your database). Another item is that there are 154 steps, of a possible 200, in the statistics histogram. The number of steps is equal to ranges. In this case, 154 steps means there are 154 ranges, each with an upper-bound value in the statistics. For example, step 154 may have an upper-bound range of 124,000. If step 153 has an upper boundary of 110,000, step 154 covers the range from 110,001 to 124,000. Only those values would be contained in step 154. The last thing of note to point out is the lack of a filtered expression; neither the index nor statistics are filtering out rows.
![]()
Figure 3-1. Stats header for index on Sales.SalesOrderDetail table
Histogram
On the other end of the spectrum from the stats header is the histogram. The histogram provides the details of the statistics object that the query optimizer uses to determine cardinality. When building the histogram, SQL Server calculates a number of aggregates that are based on either a statistics sample or all the rows in the table or view. The aggregates measure the frequency in which values occur and group the values into no more than 200 segments, or steps. For each of these steps, a distribution of the statistics columns is computed that includes the number of rows in the step, the upper bound of the step, the number of rows matching the upper bound, the distinct rows in the step, and the average number of duplicate values in the step. Table 3-2 lists the columns that match these aggregates. With this information, the query optimizer is able to estimate the number of rows returned for ranges of values in an index, thus allowing it to calculate a cost associated with retrieving the row.
Table 3-2. Histogram Columns from DBCC SHOW_STATISTICS
|
Column Name |
Description |
|---|---|
|
RANGE_HI_KEY |
Upper-bound column value for a histogram step. The column value is also called a key value. |
|
RANGE_ROWS |
Estimated number of rows whose column value falls within a histogram step, excluding the upper bound. |
|
EQ_ROWS |
Estimated number of rows whose column value equals the upper bound of the histogram step. |
|
DISTINCT_RANGE_ROWS |
Estimated number of rows with a distinct column value within a histogram step, excluding the upper bound. |
|
AVG_RANGE_ROWS |
Average number of rows with duplicate column values within a histogram step, excluding the upper bound (RANGE_ROWS / DISTINCT_RANGE_ROWS for DISTINCT_RANGE_ROWS > 0). |
As mentioned in the previous section, there are 156 steps in the histogram. In Figure 3-2, which includes a number of rows from the histogram, you can see how a few of the steps in Sales.SalesOrderDetail are aggregated. If you look at the second item in Figure 3-2, it shows the RANGE_HI_KEY value of 43692; this means that all SalesOrderID values between 43660 and 43692 are included in these estimates. There are 283 rows in this series, based on the RANGE_ROWS value, with 33 distinct rows in the series. Translating these numbers to the SalesOrderDetail table, there are 33 distinct SalesOrderID values with 283 SalesOrderDetailID items between them. Lastly, there are 32 SalesOrderDetailID items for SalesOrderID 43692.

Figure 3-2. Sample of the histogram for index on Sales.SalesOrderDetail table
This leaves one last column to look at: AVG_RANGE_ROWS. This column is often scrutinized and can result in a lot of pain when statistics are out-of-date. It states how many rows can be expected when any one value or range of values from the statistics are retrieved. To check the accuracy of the range average, execute Listing 3-3, which will aggregate some of the values in the second step. After it is complete, the results (shown in Figure 3-3) will show that the averages closely match the average range rows value of 8.8125.

Figure 3-3. Results of AVG_RANGE_ROWS estimate validation
This histogram is a valuable tool to use when the statistics of an index are in question. If there is a need to determine why a query is behaving in a specific manner or you need to check why a query plan is estimating rows as it is, the histogram can be used to validate these behaviors and results.
Density Vector
The last portion of the statistics components is the density vector. The density vector describes the columns within a statistics object. There is a row for each key value in the statistics or index object. For instance, if there are two columns in an index named SaleOrderID and SalesOrderDetailID, there will be two rows in the density vector. The density vector will have a row for SaleOrderID and a row for SaleOrderID and SalesOrderDetailID, shown in Figure 3-4. There are three pieces of information available for density vector: the density, average length, and columns included in the vector (column names detailed in Table 3-3).

Figure 3-4. Sample of the density vector for index on Sales.SalesOrderDetail table
Table 3-3. Density Vector Columns from DBCC SHOW_STATISTICS
|
Column Name |
Description |
|---|---|
|
All Density |
Returns the density for each prefix of columns in the statistics object, one row per density. The density is calculated as 1/distinct column values. The closer the density is to 1, the more uniform the values in the columns. |
|
Average Length |
Average length, in bytes, to store the column values for each level of the density vector. |
|
Columns |
Names of columns in each density vector level. |
The value of the density vector is that it helps the query optimizer adjust cardinality for multiple column statistics objects. Since the ranges within the histogram are based solely on the first column of the statistics object, the density provides an adjustment between when single or multicolumn queries are executed.
Using DBCC SHOW_STATISTICS provides the most detailed information on query optimization statistics. It does, however, rely on the user knowing that the statistics exist. With index statistics, it is easy to know about the statistics since all indexes have statistics. Column-level statistics require an alternative method for discovering the statistics. This is accomplished through two catalog views: sys.stats and sys.stat_coumns.
sys.stats
The catalog view sys.stats returns one row for every query optimization statistic object that exists within the database. Whether the statistic was created based on an index or column, the statistic object is listed in the view. Table 3-4 lists the columns in sys.stats.
Table 3-4. Columns for sys.stats
|
Column Name |
Data Type |
Description |
|---|---|---|
|
object_id |
int |
ID of the object to which these statistics belong. |
|
name |
sysname |
Name of the statistics. This value must be unique for every object_id. |
|
stats_id |
int |
ID of the statistics (unique within the object). |
|
auto_created |
bit |
Statistics were autocreated by the query processor. |
|
user_created |
bit |
Statistics were explicitly created by the user. |
|
no_recompute |
bit |
Statistics were created with the NORECOMPUTE option. |
|
has_filter |
bit |
Indicates whether the statistics are aggregated based on a filter or subset of rows. |
|
filter_definition |
nvarchar(max) |
Expression for the subset of rows included in filtered statistics. |
sys.stat_columns
As a companion to sys.stats, the catalog view sys.stat_columns provides one row for every column within a statistics object. Table 3-5 lists the columns in sys.stat_columns.
Table 3-5. Columns for sys.stats
|
Column Name |
Data Type |
Description |
|---|---|---|
|
object_id |
int |
ID of the object of which this column is part |
|
stats_id |
int |
ID of the statistics of which this column is part |
|
stats_column_id |
int |
1-based ordinal within set of stats columns |
|
column_id |
int |
ID of the column from sys.columns |
STATS_DATE
When it comes to statistics, one of the most important questions that is asked is whether the statistics are out-of-date. A frequent method for determining whether statistics are out-of-date is through the STATS_DATE function. The STATS_DATE function provides the date of the most recent update to statistics. The syntax for the function, shown in Listing 3-4, accepts an object_id and stats_id. In the case of indexes, the stats_id is the same value as the index_id.
While the STATS_DATE function is routinely used to identify out-of-date statistics, that approach isn’t effective for this task. The date that statistics were last updated does not necessarily reflect anything about the rate at which data has changed. While the function can be useful as a catchall for indexes whose statistics change slowly, it should be used with caution since when it identifies statistics as old, they still may be accurate for the index.
sys.dm_db_stats_properties
A better method for identifying the rate of change in statistics, which provides a qualifier that is reflective of the data, is the sys.dm_db_stats_properties DMO. The DMO provides the details on the number of rows that have changed since the statistics were last updated. The syntax for sys.dm_db_stats_properties, shown in Listing 3-5, accepts an object_id and stats_id. As with STATS_DATE, stats_id is the same value as the index_id. Table 3-6 lists the columns in sys.dm_db_stats_properties.
Table 3-6. Columns for sys.stats
|
Column Name |
Data Type |
Description |
|---|---|---|
|
object_id |
int |
ID of the object in question. |
|
stats_id |
int |
ID of the statistics. For indexes, the ID matches the index ID. |
|
last_updated |
datetime2(7) |
Date and time that the statistics were last updated. |
|
rows |
bigint |
Total number of rows in the table or indexed view when the statistics were last updated. For filtered statistics or indexes, the count pertains to the number of rows that matched the filter criteria. |
|
rows_sampled |
bigint |
Total number of rows sampled for statistics calculations. Histogram and density values are estimates when the rows_sampled value is less than the value in rows. |
|
steps |
int |
Number of steps in the histogram. Each step spans a range of column values followed by an upper-bound column value. The histogram steps are defined on the first key column in the statistics. The maximum number of steps is 200. |
|
unfiltered_rows |
bigint |
Total number of rows in the table before applying the filter expression. If Filter Expression is NULL, unfiltered_rows is equal to rows. |
|
modification_counter |
bigint |
Count of the total number of inserted, deleted, or updated rows since the last time statistics were updated for the table. |
Since sys.dm_db_stats_properties provides the opportunity for a better quality of understanding whether statistics are out-of-date, let’s take a look at the output to see how changes to values in a table affect the modification_counter column. To do this, you’ll start by creating the table dbo.SalesOrderHeaderStats, with Listing 3-6, and a number of indexes. To investigate modification_counter, you’ll use the query in Listing 3-7 to see the changes in the column. From Figure 3-5, you see there are 20,000 rows in the table with a current modification_counter value of 0 for every index and statistic listed.

Figure 3-5. Query results for sys.dm_db_stats_properties on dbo.SalesOrderHeaderStats
Now that you have a table to work with, let’s look at what happens when changes occur to the data in the table. For the examples, you’ll look at five different queries, provided in Listing 3-8. The first updates the OrderDate column resulting in 40 rows changed. The second query updates 50 rows where the SalesOrderNumber is updated to the same value it currently contains. The third query updates the SalesOrderNumber column again but reverses the value for the same 50 rows. The fourth query inserts 11,465 records into the table. The final query deletes the first 20,000 records from the table. Between each of the queries, execute the code in Listing 3-7; doing so will result in the output in Figure 3-6.

Figure 3-6. Query results for sys.dm_db_stats_properties for sameple queries on dbo.SalesOrderHeaderStats
Reviewing the results in Figure 3-6 provides some interesting insight into how the modification_counter column is populated. To summarize, any insert, update, or delete is considered a single change for the index and statistics. Looking at the results for query 1, the 40 rows changed the result in modification_counter for CIX_SalesOrderHeaderStats_OrderDate to increase to 40. Similarly, when SalesOrderNumber is changed in queries 2 and 3, each query results in an increase of 50 to modification_counter, whether the value changed or not. Increasing the number of records causes all three indexes to increase the modification_counter value by 11,465, which coincides with the number of records inserted. Finally, in the query 5 results, you see the 20,000 records were deleted. Interestingly enough, in the results for the last query, the statistics from CIX_SalesOrderHeaderStats were updated to better reflect the changes in values in the index.
While sys.dm_db_stats_properties doesn’t provide a list of all distinct records in a table and the impact that might have on statistics, it does provide details that identify the volume of change on an index and the statistics that support it. When determining whether an index has statistics that may be out-of-date, this DMO is extremely useful.
Statistics DDL
I have primarily been discussing index-level statistics in this chapter. Statistics can also be created and provide significant value on nonindexed columns. Index statistics are automatically created when an index is created and automatically dropped when the index is dropped. When manually creating or dropping statistics on nonindexed columns, there are two DDL statements that can be used to accomplish this: CREATE and DROP STATISTICS. Since they are outside the scope of this book, I will not be discussing them. The third DDL statement, UPDATE STATISTICS, applies to all statistics including the index-level statistics. Since UPDATE STATISTICS is primarily tied to index maintenance, it is discussed in Chapter 7.
Index-Level Statistics Summary
Query optimization statistics are a vital piece of indexing. They provide the information that the query optimizer requires in order to build cost-based query plans. Through this process, SQL Server can identify high-quality plans through their calculated costs. In this section, you looked at how statistics are stored and the tools you can use in order to investigate and begin to understand the statistics that are stored for an index.
Index Usage Statistics
The next domain of information to take a look at is index usage stats. Index usage statistics are accumulated through the DMO sys.dm_db_index_usage_stats. This DMO returns counts of different types of index operations and when the operation was last performed. Through this information, you can discern how frequently an index is being used and how current that usage is.
The DMO sys.dm_db_index_usage_stats is a dynamic management view (DMV). Because of this, it does not require any parameters. It can be joined to other tables or views through any of the JOIN operators. Indexes appear within the DMV after the index has been used for the first time or since the reset of the statistics.
![]() Note Along with restarting the SQL Server service, closing or detaching a database will reset all the statistics for an index that have been accumulated in sys.dm_db_index_usage_stats.
Note Along with restarting the SQL Server service, closing or detaching a database will reset all the statistics for an index that have been accumulated in sys.dm_db_index_usage_stats.
Within the DMV sys.dm_db_index_usage_stats, three types of data are provided: header columns, user statistics, and system statistics. In the next few sections, you will explore each to gain an understanding of what information they hold and how you can use it.
Header Columns
The header columns for the DMV provide referential information that can be used to determine for which index the statistics were accumulated. Table 3-7 lists the columns that are part of this. These columns are primarily used to join the DMV to system catalog views and other DMOs.
Table 3-7. Header Columns in sys.dm_db_index_usage_stats
|
Column Name |
Data Type |
Description |
|---|---|---|
|
database_id |
smallint |
ID of the database in which the table or view is defined |
|
object_id |
int |
ID of the table or view in which the index is defined |
|
index_id |
int |
ID of the index |
One of the first things that can be done with sys.dm_db_index_usage_stats is to check to see whether an index has been used since the last time the statistics in the DMV were reset. Using the header columns, similar to the T-SQL statement in Listing 3-9, can provide a list of the indexes that have not been used. If you are using the AdventureWorks2014 database, your results will look similar to those in Figure 3-7. In these results, indexes that have not been used are returned.

Figure 3-7. sys.dm_db_index_usage_stats header columns query results
This type of information can be useful for managing the indexes in your databases. It is an excellent resource for identifying the indexes that have not been used in a while. This strategy of index management is discussed further in later chapters.
The next set of columns in the DMV sys.dm_db_index_usage_stats is the user columns. The user columns provide insight into how indexes are being specifically used within query plans. The columns are listed in Table 3-8; they include statistics on how many times each operation occurred and the time at which the last one occurred.
Table 3-8. User Columns in sys.dm_db_index_usage_stats
|
Column Name |
Data Type |
Description |
|---|---|---|
|
user_seeks |
bigint |
Aggregate count of seeks by user queries |
|
user_scans |
bigint |
Aggregate count of scans by user queries |
|
user_lookups |
bigint |
Aggregate count of bookmark/key lookups by user queries |
|
user_updates |
bigint |
Aggregate count of updates by user queries |
|
last_user_seek |
datetime |
Date and time of last user seek |
|
last_user_scan |
datetime |
Date and time of last user scan |
|
last_user_lookup |
datetime |
Date and time of last user lookup |
|
last_user_update |
datetime |
Date and time of last user update |
sys.dm_db_index_usage_stats monitors four types of index operations. These are represented through the columns user_seeks, user_scans, user_lookups, and user_updates.
The first of the index usage columns is user_seeks. The operations for this column occur whenever a query executes and returns a single row or range of rows for which it has a direct access path. For instance, if a query executes and retrieves all the sales details records for a single order or a small range of orders, similar to the queries in Listing 3-10, the query plan for these would use a seek operation (see Figure 3-8).

Figure 3-8. Query plans for seek queries
After running the queries from Listing 3-10, the DMV sys.dm_db_index_usage_stats will be counted into the user_seeks column. The query in Listing 3-11 provides a query to investigate this. If you are following along, you should see the results in Figure 3-9. As the results show, the value in the user_seeks column is 2, which matches the count of operations from Listing 3-10. Based on this, you know that two queries were executed using the index, and both were able to utilize the index to go directly to rows that were requested.

Figure 3-9. Query results for index_seeks
The next usage column is user_scans. The value of this column is increased whenever a query executes, and it must scan through every row of an index. For instance, consider a query on sales details that is unfiltered and must return all records or a query that is filtered on a column that is unindexed. Both of these queries, shown in Listing 3-12, are asking SQL Server for either everything it has in a table or a few rows that it doesn’t have a location on. The only way to accommodate this request would be through a scan of the SalesOrderDetail table. Figure 3-10 shows the execution plans for these two queries.

Figure 3-10. Query plans for seek queries
When index scans occur, they can be seen in sys.dm_db_index_usage_stats. The query in Listing 3-13 provides a view in the DMV to see the accumulation of the scans. Since there were two scans, one for each of the two queries, the results in Figure 3-11 show that there have been two operations under user_scans. This information can be useful when trying to troubleshoot situations where there are large numbers of scans on a table. By looking at this information, you are able to find the indexes with high scans and then begin to look at why queries using those indexes are using scans over more optimal operations such as index seeks.

Figure 3-11. Query results for index_scans
The third column in the DMV is user_lookups. User lookups occur when a seek on a nonclustered index occurs but does not have all of the required columns in it to satisfy the query. When this happens, the query must look up the columns from the clustered index. An example would be a query against the SalesOrderDetail table that is returning the ProductID and CarrierTrackingNumber columns, which query is filtered on ProductID; Listing 3-14 shows this query. Figure 3-12 shows the query plan from this query. The query plan shows a seek on the nonclustered index and a key lookup on the clustered index.

Figure 3-12. Query plans for seek and key lookup
In sys.dm_db_index_usage_stats, there will be a tally of one for both user_seeks and user_lookups. To access these values, use Listing 3-15, which will return the results in Figure 3-13. Patterns between these columns can help with determining proper clustering keys or identifying when to modify indexes to avoid the key lookups. Key lookups aren’t necessarily bad but can be a performance bottleneck if overused and left unchecked. I’ll discuss more on what to look for in regard to user_lookups in later chapters.

Figure 3-13. Query results for index_lookups
The last of the index operations is user_updates. The user_updates column is not limited to update operations on a table. In actuality, it covers all INSERT, UPDATE, and DELETE operations that occur on a table. To demonstrate this, you can execute the code in Listing 3-16. This code will insert a record into the SalesOrderDetail table, then update the record, and finally delete the record from the table. Since the execution plans for these are complex because of foreign key relationships, they have not been included in this example.
At the completion of the execution of the code listing, there were three operations that occurred on the table. For each of these operations, sys_dm_db_index_usage_stats accumulated one tick in the user_updates column. Execute the code in Listing 3-17 to see the activity that occurred on the index. The results will be similar to those in Figure 3-14. Besides the changes made to the clustered index for SalesOrderDetail, the updates made to the nonclustered indexes are also included. Being able to see the effects of an insert, update, or delete on a table can help provide an understanding of the impact of users and the volatility of your data.
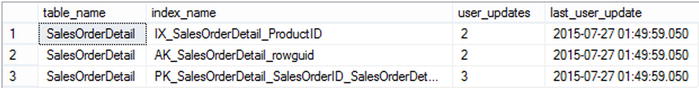
Figure 3-14. Query results for index_updates
System Columns
The last set of columns in sys.dm_db_index_usage_stats is the system columns. The system columns return the same general information as the user columns, except these values are from the perspective of background processes. Whenever something triggers within SQL Server, such as a triggered statistics update, that activity will be tracked through these columns. Table 3-9 lists the system columns.
Table 3-9. System Columns in sys.dm_db_index_usage_stats
|
Column Name |
Data Type |
Description |
|---|---|---|
|
system_seeks |
bigint |
Number of seeks by system queries |
|
system_scans |
bigint |
Number of scans by system queries |
|
system_lookups |
bigint |
Number of lookups by system queries |
|
system_updates |
bigint |
Number of updates by system queries |
|
last_system_seek |
datetime |
Time of last system seek |
|
last_system_scan |
datetime |
Time of last system scan |
|
last_system_lookup |
datetime |
Time of last system lookup |
|
last_system_update |
datetime |
Time of last system update |
For the most part, these columns can be ignored. It is good, though, to understand how they are aggregated. To see an example, execute the code in Listing 3-18. This will change a majority of the rows in the SalesOrderDetail table. Since more than 20 percent of the rows have changed, an automatic statistics update will be triggered. The statistics update is not directly related to user activity and is instead a background, or system, process.
After the update has completed, run the T-SQL statements in Listing 3-19. This code will return all the system columns. Within these is the system_scans column, shown in Figure 3-15. During the statistics update, SQL Server performed a scan twice on the table to retrieve the information necessary to complete the statistics update.

Figure 3-15. sys.dm_db_index_usage_stats header columns query results
From a usefulness perspective, there isn’t much of anything that can be gleaned from these columns. They are just the result of background processes and are more there to inform what is happening with indexes in the background.
Index Usage Stats Summary
In this section, I discussed the statistics found in DMV sys.dm_db_index_usage stats. This DMV provides some extremely useful statistics about how and if indexes are being used in the database. By monitoring these statistics over the long run, you will be able to understand which indexes are providing some of the most value. Strategies for using all these columns to index for performance will be discussed in Chapter 8.
The third area of statistics to consider is index operational stats. These statistics are presented to users through the DMO sys.dm_db_index_operational stats. From a high level, this DMO provides low-level information on I/O, locking, latching, and access methods that occur on indexes. Through this low-level information, you can identify indexes that may be encountering performance issues and start to understand what is leading to those performance issues. At the end of this section, you will understand the statistics provided in the DMO and know how to investigate indexes through these statistics.
Unlike the DMO in the previous section, sys.dm_db_index_operational_stats is a dynamic management function (DMF). Because of this, the DMF requires a number of parameters to be supplied when it is used. Table 3-10 details the parameters for the DMF.
Table 3-10. Parameters for sys.dm_db_index_operational_stats
|
Parameter Name |
Data Type |
Description |
|---|---|---|
|
database_id |
smallint |
ID of the database where the indexes reside. Providing the values 0, NULL, or DEFAULT will return index information for all databases. The function DB_ID can be used in this parameter. |
|
object_id |
int |
Object ID of the table or view for which statistics should be returned. Providing the values 0, NULL, or DEFAULT will return index information for all tables or views in database. |
|
index_id |
int |
Index ID of the index for which statistics should be returned. Providing the values -1, NULL, or DEFAULT will return statistics for all indexes on the table or view. |
|
partition_number |
int |
Partition number on an index in which statistics should be returned. Providing the values 0, NULL, or DEFAULT will return statistic information for all partitions on an index. |
Through the parameters, statistics on indexes can be as widely or narrowly focused as necessary. This flexibility is useful since sys.dm_db_index_operational_stats does not allow the use of the CROSS APPLY or OUTER APPLY operators. When passing the parameters into the DMF, the syntax for doing so is defined in Listing 3-20.
![]() Note The DMF sys.dm_db_index_operational stats can accept the use of the Transact SQL functions DB_ID() and OBJECT_ID(). These functions can be used for the parameters database_id and object_id, respectively.
Note The DMF sys.dm_db_index_operational stats can accept the use of the Transact SQL functions DB_ID() and OBJECT_ID(). These functions can be used for the parameters database_id and object_id, respectively.
Header Columns
To start looking at the statistics, you need to identify the header columns that will be used with all the resulting queries. For every row that is returned through the DMF, there will be a database_id, object_id, index_id, and partition_number. These columns are defined further in Table 3-11. As is implied through the partition_number, the granularity of the results for this DMF is at the partition level. For nonpartitioned indexes, the partition number will be 1.
Table 3-11. Header Columns in sys.dm_db_index_operational_stats
|
Column Name |
Data Type |
Description |
|---|---|---|
|
database_id |
smallint |
ID of the database on which the table or view is defined |
|
object_id |
int |
ID of the table or view on which the index is defined |
|
index_id |
int |
ID of the index |
|
partition_number |
int |
1-based partition number within the index or heap |
The header columns provide the basis for understanding to which indexes the statistics apply. This will help provide perspective regarding the statistics returned. Also, they can be used to join to catalog views, such as sys.indexes, to provide the names of the indexes.
The useful statistical information in this DMF comes in the rest of the columns returned by the function. The information that can be returned provides insight into DML activity, the page allocation cycle, data access patterns, index contention, and disk activity. In the following sections, you’ll look into the columns of the DMF that provide statistics for this information.
DML Activity
The place to begin when investigating the operation stats on an index is with the DML activity on the index. Table 3-12 lists the columns that represent this activity. These columns provide a count of the number of rows that are affected by DML operations. The statistics that follow are similar to those in sys.dm_db_index_usage but with a few differences in perspective that will be discussed next.
Table 3-12. DML Activity Columns in sys.dm_db_index_operational_stats
|
Column Name |
Data Type |
Description |
|---|---|---|
|
leaf_insert_count |
bigint |
Cumulative count of leaf-level rows inserted. |
|
leaf_delete_count |
bigint |
Cumulative count of leaf-level rows deleted. |
|
leaf_update_count |
bigint |
Cumulative count of leaf-level rows updated. |
|
leaf_ghost_count |
bigint |
Cumulative count of leaf-level rows that are marked to be deleted but not yet removed. |
|
nonleaf_insert_count |
bigint |
Cumulative count of inserts above the leaf level. For heaps, this value will always be 0. |
|
nonleaf_delete_count |
bigint |
Cumulative count of deletes above the leaf level. For heaps, this value will always be 0. |
|
nonleaf_update_count |
bigint |
Cumulative count of updates above the leaf level. For heaps, this value will always be 0. |
Within sys.dm_db_index_operational_stats, there are two areas where DML activity can be tracked. These are at the leaf and nonleaf levels. These areas of DML activity were discussed in Chapter 2; for more information on leaf and nonleaf pages, refer to that chapter.
The difference between these two types of data changes are important to help identify whether there are changes as a result of DML operations. This means that leaf-level DML activity is a direct result of INSERT, UPDATE, and DELETE statements. The nonleaf level DML activity happens when leaf-level activity results in a change in how the index is structured and isn’t something that can be directly impacted with an INSERT, UPDATE, or DELETE statement.
Both leaf-level and nonleaf-level DML activities are broken apart into statistics based on the type of DML operation that has occurred. As previously indicated, DML activity monitors INSERT, UPDATE, and DELETE activity. For each of these operations, there is a column in sys.dm_db_index_operational_stats. Additionally, there is a column that counts records that have been ghosted off the leaf-level DML activity.
During DELETE operations, rows affected by the statement are deleted in a two-phase operation. Initially, the records are marked for deletion. When this occurs, the records are referred to as being ghosted; the rows in this state are counted in leaf_ghost_count. At regular intervals, a cleanup thread within SQL Server will go through and perform an actual delete operation on rows marked as ghosted. At that point, the records will be counted in the lead_delete_column. This process helps in the performance of delete operations since the actual delete of a row happens after the transaction is committed. Also, in the event of transaction rollback, the ghost flag on a row is all that needs to change rather than an attempt to re-create the row in the table. This activity occurs only at the leaf level; nonleaf pages are deleted whenever all the rows associated with the page have been deleted or otherwise removed.
As mentioned, this DML activity on this DMF is similar to that found in sys.dm_db_index_usage_stats. While it is similar, there are some stark differences. The first difference is that the information in sys.dm_db_index_operational_stats is much more granular than sys.dm_db_index_usage_stats. Operational stats report down to the leaf and nonleaf levels; usage stats do not. Along with the granularity is the difference in how the counts are tabulated. Usage stats count one for every plan that performs the operation on the index; whether 0 or 100 rows, the stats are collected. Operational stats differ in that the count increments for every row that has the DML operation performed. To summarize the difference, usage stats aggregate when the index is used, and operational stats aggregate based on how much of the index is used.
The code in Listing 3-21 illustrates how operational stats are tabulated. In the listing, 72 rows are added to the table dbo.KungFu. Then 28 rows are deleted from the table. This is followed by 44 rows being updated in the table. The last query returns operational stats based on the DML activity. Figure 3-16 shows the results of the final query.

Figure 3-16. DML activity query results (result may vary on your system)
The value in looking at the DML activity in an index is to help you understand what is happening to the data in an index. For example, if a nonclustered index is being updated often, it may be beneficial to look at the columns in the index to determine whether the volatility of the columns matches the benefit of the index. It is good to look at the indexes with high amounts of DML activity and consider whether the activity matches your own understanding of the database platform.
After DML activity, the next area of information that can be looked at is the information on SELECT activity. The SELECT activity columns, shown in Table 3-13, identify the type of physical operation that was used when queries were executed. There are three types of access that SQL Server collects information on: range scans, singleton lookups, and forwarded records.
Table 3-13. Access Pattern Columns in sys.dm_db_index_operational_stats
|
Column Name |
Data Type |
Description |
|---|---|---|
|
range_scan_count |
bigint |
Cumulative count of range and table scans started on the index or heap |
|
singleton_lookup_count |
bigint |
Cumulative count of single row retrievals from the index or heap |
|
forwarded_fetch_count |
bigint |
Count of rows that were fetched through a forwarding record |
Range Scan
Range scans occur whenever a range of rows or a table scan is used to access data. When considering a range of rows, it can be anywhere from 1 to 1,000 or more rows. The number of rows in the range is not material in how SQL Server accesses the data. With table scans, the number rows is also not important, but you already, likely, assume that it includes all records in the table. In sys.dm_db_index_operational_stats, these values are stored in the column range_scan_count.
To see this information collected in range_scan_count, execute the code in Listing 3-2 and Listing 3-4 from the previous section. In these two code samples, four queries will be executed. The first two will result in index seeks in the query plan, shown in Figure 3-2. And the second two queries result in index scans, as shown in the execution plans in Figure 3-4. Running the code in Listing 3-22 will show, as displayed in Figure 3-17, that all four queries used a range scan to retrieve the data from the table.

Figure 3-17. Query results for range_scan_count
Singleton Lookup
The next statistics column collected on SELECT activity is singleton_lookup_count. Values in this column are increased whenever the key lookup, formerly bookmark lookup, is used. In general terms, this is the same type information as collected in the column user_lookups in sys.dm_db_index_usage stats. There is a significant difference, though, between user_lookups and singleton_lookup_count. When a key lookup is used, user_lookups will increment by one to indicate that the index operation had been used. With singleton_lookup_count, for every row that uses the key lookup operation, the value in this column will increase by one.
For instance, running the code in Listing 3-10 will result in a key lookup. This can be validated by examining the execution plan, shown in Figure 3-12. The statistics from this were discussed previously and shown in Figure 3-18. The new information to look at can be investigated by running the T-SQL statement in Listing 3-23. In the results, you can see that instead of there being a value of 1 in singleton_lookup_count, the value is 243. This is an important distinct for this column. Rather than knowing that key lookups have occurred, this statistic provides information on the scope of the lookups. You could consider that if the ratio of singleton lookups to range scans was high, there may be other indexing alternatives to consider.

Figure 3-18. Query results for singleton_lookup_count
Forwarded Fetch
The last column of statistics collected on SELECT activity is forwarded_fetch_count. As discussed in Chapter 2, forwarded records occur in heaps when a record increases in size and can no longer fit on the page that it is currently on. The column forwarded_fetch_count increases by one every time a record forward operation occurs.
To demonstrate, the code in Listing 3-24 builds a table with a heap and populates it with some values. Then an UPDATE statement increases the size of every third row. The size of the new row will exceed the available space on the page, resulting in a forward record.
Once the script is completed, the sys.dm_db_index_operational_stats script in Listing 3-25 can be used to view the number of times that forwarded records have been fetched. In this case, the 193 records that were forwarded resulted in a forwarded_fetch_count of 193, shown in Figure 3-19. This column is useful when looking into the performance counter Forwarded Records/sec. Reviewing this column will help identify which heap is leading to the counter activity, providing a focus on the exact table to investigate.

Figure 3-19. Query result for forwarded_fetch_count
Locking Contention
As data is used within SQL Server databases, it is locked to provide consistency in the data that users are requesting and to prevent others from receiving incorrect results. At times, locking for one user can interfere with another user. To best monitor locking, sys.dm_db_index_operational_stats provides columns that detail the counts on locks and time spent waiting for locks to occur. Table 3-14 lists the columns in this group of columns. There are three type of locks that are tracked in sys.dm_db_index_operational_stats to provide insight into locking contention: row locks, page locks, and index lock promotion.
Table 3-14. Index Contention Columns in sys.dm_db_index_operational_stats
|
Column Name |
Data Type |
Description |
|---|---|---|
|
row_lock_count |
bigint |
Cumulative number of row locks requested |
|
row_lock_wait_count |
bigint |
Cumulative number of times the database engine waited on a row lock |
|
row_lock_wait_in_ms |
bigint |
Total number of milliseconds the database engine waited on a row lock |
|
page_lock_count |
bigint |
Cumulative number of page locks requested |
|
page_lock_wait_count |
bigint |
Cumulative number of times the database engine waited on a page lock |
|
page_lock_wait_in_ms |
bigint |
Total number of milliseconds the database engine waited on a page lock |
|
index_lock_promotion_attempt_count |
bigint |
Cumulative number of times the database engine tried to escalate locks |
|
index_lock_promotion_count |
bigint |
Cumulative number of times the database engine escalated locks |
Row Lock
The first set of columns consists of the row lock columns. These columns include row_lock_count, row_lock_wait_count, and row_lock_wait_in_ms. Through these columns you are able to measure the number of locks that occur on a row and then whether there was any contention when acquiring the row lock. Row lock contention can often be observed by its effect on transaction performance through blocking and deadlocking.
To demonstrate how this information is collected, execute the code in Listing 3-26. In this script, rows from the Sales.SalesOrderDetail tables are retrieved based on ProductID. In the AdventureWorks2014 database, the query retrieves 44 rows.
To observe the row locks that were acquired by the query, use the row lock columns in the query provided in Listing 3-27. In these results, you see that for each row that was returned by the query against Sales.SalesOrderDetail, there is one lock included in the results of sys.dm_db_index_operational_stats, shown in Figure 3-20. As a result, there were 44 row locks placed on the index IX_SalesOrderDetail_ProductID.
Note that there is no information returned for the row_lock_wait_count and row_lock_wait_in_ms columns. This is because the script was not blocked by any other query. Had the query in Listing 3-26 been blocked by another transaction, then the values in these columns would have incremented.

Figure 3-20. Query results for row locks
Page Lock
The next set of columns are the page lock columns. The columns in this group have similar characteristics to the row lock columns, with the exception that they are scoped at the page level instead of the row level. For every page that relates to an accessed row, a page lock is acquired. These columns are page_lock_count, page _lock_wait_count, and page _lock_wait_in_ms. When monitoring for locking contention on an index, it is important to look at both the page and row levels to identify whether the contention is on the individual rows being accessed or possibly different rows accessed on the same pages.
To review the differences, let’s continue with the query from Listing 3-26 but retrieve the page lock statistics that were collected in sys.dm_db_index_operational_stats for the query. This information is available using the script in Listing 3-28. The results this time are a bit different than those for the row locks. For the page locks, see Figure 3-21; there are only two page locks on the index IX_SalesOrderDetail_ProductID. Along with that, there are 44 page locks on PK_SalesOrderDetail_SalesOrderID_SalesOrderDetailID, which did not encounter any row locks.

Figure 3-21. Query results for page locks
The statistics for the locking behavior may not make sense initially, until you consider the activity that occurred when the query (from Listing 3-26) executed. When query executed, it utilized an index seek and a key lookup (see the execution plan in Figure 3-22). The index seek on IX_SalesOrderDetail_ProductID accounts for the 2 page locks and the 44 row locks. There were 44 rows that matched the predicate for the query, and they spanned two pages. The 44 page locks on PK_SalesOrderDetail_SalesOrderID_SalesOrderDetailID are the result of the key lookup operations that occurred for all the rows from IX_SalesOrderDetail_ProductID. Together the row and page lock columns help describe the activity that occurred.

Figure 3-22. Query results for page locks
While row locking and page locking are useful for identifying when contention exists, there is one piece about locking that it does not provide. There is no information collected in the DMO about the types of locks that are being placed. All the locks could be shared locks, or they could also be exclusive locks. The lock wait count provides scope around the frequency of incompatible locks on the tables and the duration of those locks, but the locks themselves are not identified.
The last piece with locking contention to pay attention to is the amount of lock escalation that is occurring in the database. When the number of locks acquired for an transaction exceeds the locking threshold on a SQL Server instance, the locks will escalate to the next higher level of locking. This escalation can happen at the page, partition, and table levels. There are a number of reasons for escalating locks on a database. One reason is that locks require memory, so the more locks there are, the more memory is required and the more resources are needed to manage locks. Another reason is that many individual low-level locks open the opportunity for blocking to escalate into deadlocking. For these reasons, it is important to pay attention to lock escalations.
To help provide an understanding of lock escalation, let’s use a modification of the demo query that was used previously in this section. Instead of selecting 44 rows, though, you’ll update all the rows where ProductID is less than or equal to 712 (see Listing 3-29). The update will just change ProductID to its current value so as not to permanently change the data in AdventureWorks2014.
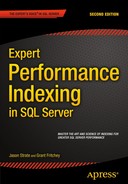
Now with the example script execution, you’ll need to review the statistics in sys.dm_db_index_operational_stats to see whether there were any lock escalations by using the script in Listing 3-30. As the output from the script shows (Figure 3-23), the column index_lock_promotion_attempt_count recorded four events for PK_SalesOrderDetail_SalesOrderID_SalesOrderDetailID and IX_SalesOrderDetail_ProductID. This means that there were four opportunities for lock escalation that were triggered. Looking at the column index_lock_promotion_count, there was one lock escalation on IX_SalesOrderDetail_ProductID. Translating the results into less technical terms, for the two indexes there were four times when SQL Server considered whether a lock escalation was appropriate for the query. At the fourth check on IX_SalesOrderDetail_ProductID, SQL Server determined that a lock escalation was needed and the lock was escalated.

Figure 3-23. Query results for lock escalation
Monitoring lock escalation goes hand in hand with monitoring row and page locks. When row and page lock contention increases, either through increased frequency or through duration of lock waits, evaluating lock escalation can help identify the number of times SQL Server considers escalating locks and when those locks have been escalated. In some cases where tables are improperly indexed, locks can escalate more frequently and lead to increased blocking and potentially deadlocking.
Latch Contention
Locking isn’t the only type of contention that indexes can encounter. In addition to locking, there is latch contention. Latches are short, light-weight data synchronization objects. From a high level, latches provide controls on memory objects while activities are executing. One example of a latch is when data is transferred from disk to memory. If there are disk bottlenecks while this occurs, latch waits will accumulate while the disk transfer completes. The value in this information is that when latch waits are occurring, these columns (shown in Table 3-15) provide a mechanism to track the waits down to specific indexes, thus allowing you to focus on where indexes are stored as part of index management.
Table 3-15. Latch Activity Columns in sys.dm_db_index_operational_stats
Page I/O Latch
When it comes to page I/O latches, two sets of data are collected: page-level latching and tree page latching. Page-level latching occurs when data pages at the leaf levels of an index, the data pages, need to be retrieved (as opposed to tree page latching, which happens at all the other levels of the index). Both of these statistics are measures of the number of latches created while moving data into the buffer and any time related to delays. Whenever time is accumulated in page_io_latch_wait_in_ms or tree_page_io_latch_wait_in_ms, it correlates to increases in wait times for the PAGEIOLATCH_* wait types.
To better understand how page I/O latches occur and the statistics you can collect, you’ll review an example that will cause these waits to occur. In this demonstration, you’ll return all the data from Sales.SalesOrderDetail, Sales.SalesOrderHeader, and Production.Product via the script in Listing 3-31. Before executing the script, the buffer cache will be purged to force SQL Server to have to retrieve the data for the pages from disk. Be sure to use this script only on a nonproduction server where clearing the buffer cache will not impact other processes.
When the query completes, a number of page I/O latches will have occurred while populating the pages for the tables and indexes into the buffer cache. To review the page I/O latches, query against sys.dm_db_index_operational_stats on the page I/O latch columns using the script in Listing 3-32. The results, shown in Figure 3-24, indicate that there were page I/O latches issues on all three of the tables in the example query, including more than 1 millisecond of waits incurred on Sales.SalesOrderHeader.

Figure 3-24. Query results for page I/O latch
Page Latch
The other kind of latching related to indexes that can occur in databases is page latching. Page latching covers any latching that occurs on nondata pages. Page latches include allocation of GAM and SGAM pages and DBCC and backup activities. As pages are allocated by different resources, contention can occur, and monitoring page latches can uncover this activity.
When it comes to an index, one common scenario in which page latches can occur is when a “hotspot” develops on an index because of frequent inserts or page allocations. To demonstrate this scenario, you’ll create the table dbo.PageLatchDemo in Listing 3-33. Next, using your preferred load generator tool, execute the code in Listing 3-34 continuously and a few simultaneous sessions. To generate the load for this example, I had five sessions with 500 total executions. Through this example, hundreds of rows will be inserted quickly into the same series of page, and numerous page allocations will be made. Since these inserts will be so close, a “hotspot” will be created, which will lead to page latch contention.
To verify that the page latch contention did occur, use the script provided in Listing 3-35. The results, provided in Figure 3-25, show that there were numerous page latches and delays associated with them. In this example, the delayed per page latch was a bit under 6 milliseconds. In more critical situations, these values will be much higher and will help you identify when an index is interfering with access or writing data to an index.
![]()
Figure 3-25. Query results for page latch
![]() Note Page I/O and page latch contention are highly dependent on hardware. Your results for the demonstration queries in this section will not identically match the results shown.
Note Page I/O and page latch contention are highly dependent on hardware. Your results for the demonstration queries in this section will not identically match the results shown.
Page Allocation Cycle
As a result of the DML activity, leaf and nonleaf pages are allocated or deallocated from indexes from time to time. Monitoring page allocations is an important part of monitoring an index (see Table 3-16 for options). Through this monitoring, it is possible to get a handle on how an index is “breathing” between maintenance windows. This breathing activity is the relationship between pages allocated to indexes through inserts and page splits and then the removal, or merging, of pages through deletes. By monitoring this activity, you can better maintain your indexes and get an idea of when it would be useful to increase the index FILLFACTOR value.
Table 3-16. Page Allocation Cycle Columns in sys.dm_db_index_operational_stats
|
Column Name |
Data Type |
Description |
|---|---|---|
|
leaf_allocation_count |
bigint |
Cumulative count of leaf-level page allocations in the index or heap |
|
nonleaf_allocation_count |
bigint |
Cumulative count of page allocations caused by page splits above the leaf level |
|
leaf_page_merge_count |
bigint |
Cumulative count of page merges at the leaf level |
|
nonleaf_page_merge_count |
bigint |
Cumulative count of page merges above the leaf level |
As an example of how page allocation occurs on a table, execute the script in Listing 3-36. In this script, the table dbo.AllocationCycle is created. Afterward, 100,000 rows are inserted into the table. Since this is a new table, there is no contention on page allocations, and data is added in an orderly fashion. At this point, pages have been allocated to the table, and the allocations relate specifically to these inserts.
To verify the allocations, you can check the leaf and nonleaf allocation columns leaf_allocation_count and nonleaf_allocation_count from sys.dm_db_index_operational_stats. Using the script in Listing 3-37, you see that there are 758 allocations at the leaf level and 3 at the nonleaf level (see Figure 3-26). This is an important point to remember whenever using these columns: a portion of the pages allocated can be insert-related.
![]()
Figure 3-26. Query results for page latch
At the start of this section, there was a reference to using page allocations to monitor for page splits and to identify where modifications to the fill factor can be useful. To understand this, you first need to generate page splits on the dbo.AllocationCycle table. You can do so using the script in Listing 3-38. This script increases the length of the FillerData column on every third row to 1,000 characters.
Once the data is modified, the results from executing the sys.dm_db_index_operational_stats query in Listing 3-37 change drastically. With the size of the rows expanding, the number of pages allocated jumps up to 9,849 with a total of 35 nonleaf pages (Figure 3-27). Since the order of the rows hasn’t changed, this activity is related to page splits from expanding the sizes of the rows. By monitoring these statistics, indexes affected by this pattern of activity can be identified.
![]()
Figure 3-27. Query results for page latch
Compression
While not the most exciting set of columns, there are two columns in sys.dm_db_index_operational_stats that are used for monitoring compression. These columns, listed in Table 3-17, count the number of attempts that have been made at compressing a page and then the number of successful attempts in doing so. The primary value in these columns is providing feedback on PAGE-level compression. Failures can lead to decisions to remove compression because it is usually not practical to have compression enabled when there is a high rate of failure with compression.
Table 3-17. Compression Columns in sys.dm_db_index_operational_stats
|
Column Name |
Data Type |
Description |
|---|---|---|
|
page_compression_attempt_count |
bigint |
Number of pages that were evaluated for PAGE-level compression for specific partitions of a table, index, or indexed view. Includes pages that were not compressed because significant savings could not be achieved. |
|
page_compression_success_count |
bigint |
Number of data pages that were compressed by using PAGE-compression for specific partitions of a table, index, or indexed view. |
Page compression can fail when the cost to compress the data exceeds the value in uncompressing that data later. This is typically found in data that has low patterns of repeating data, such as images. When image data is compressed, it often does not receive sufficient benefit from the compression, and SQL Server will not store the page as a compressed page. To demonstrate this, execute the code in Listing 3-39, which creates a table with page compression enabled and inserts a number of images into it.
The insert into the table doesn’t fail, but are all the pages compressed? To find out, execute the script in Listing 3-40; it returns the page_compression_attempt_count and page_compression_success_count columns. As the results show (Figure 3-28), seven pages were successfully compressed, but another 46 pages failed to compress. With this ratio of success-to-failures for page compression, it is easy to see that the value of page compression on the clustered index on dbo.PageCompression is not very high.

Figure 3-28. Query results for page latch
LOB Access
The last group of columns in sys.dm_db_index_operational_stats pertains to large objects (LOBs). They provide information on the number of pages fetched and the size of those pages. Also, there are columns that measure the amount of LOB data that is pushed off and pulled into rows. Table 3-18 lists all these columns and others in this group.
Table 3-18. LOB Access Columns in sys.dm_db_index_operational_stats
|
Column Name |
Data Type |
Description |
|---|---|---|
|
lob_fetch_in_pages |
bigint |
Cumulative count of LOB pages retrieved from the LOB_DATA allocation unit. These pages contain data that is stored in columns of type text, ntext, image, varchar(max), nvarchar(max), varbinary(max), and xml. |
|
lob_fetch_in_bytes |
bigint |
Cumulative count of LOB data bytes retrieved. |
|
lob_orphan_create_count |
bigint |
Cumulative count of orphan LOB values created for bulk operations. |
|
lob_orphan_insert_count |
bigint |
Cumulative count of orphan LOB values inserted during bulk operations. |
|
row_overflow_fetch_in_pages |
bigint |
Cumulative count of row-overflow data pages retrieved from the ROW_OVERFLOW_DATA allocation unit. |
|
row_overflow_fetch_in_bytes |
bigint |
Cumulative count of row-overflow data bytes retrieved. |
|
column_value_push_off_row_count |
bigint |
Cumulative count of column values for LOB data and row-overflow data that is pushed off-row to make an inserted or updated row fit within a page. |
|
column_value_pull_in_row_count |
bigint |
Cumulative count of column values for LOB data and row-overflow data that is pulled in-row. This occurs when an update operation frees up space in a record and provides an opportunity to pull in one or more off-row values from the LOB_DATA or ROW_OVERFLOW_DATA allocation units to the IN_ROW_DATA allocation unit. |
The LOB access columns can be useful in determining the volume of large object activity and when data may be moving from large object to in-row overflow storage. This is important when you are seeing performance issues related to retrieving or updating LOB data. For instance, the column lob_fetch_in_bytes measures the bytes from LOB columns retrieved by SQL Server for the index.
To demonstrate some LOB activity, run the script in Listing 3-41. This script doesn’t represent all the possible activity, but it does cover the basics. At the start of the script, the table dbo.LOBAccess is created with the column LOBValue, which uses a large object data type. The first operation against the table inserts ten rows that are narrow enough that the LOBValue values can be stored on the data page with the row. The second operation increases the size of the LOBValue column forcing it to expand outside the 8KB max for a data row. The final operation retrieves all the rows from the table.
Using the LOB access columns listed in Table 3-18, you can observe what happens under the covers with the script in Listing 3-42. As the output in Figure 3-29 shows, the column column_value_push_off_row_count tracked ten row operations on the index where the row moved in-row data off into large object storage. The operation coincided with the update that increased the length of the rows. The other two statistics that were accumulated, lob_fetch_in_pages and lob_fetch_in_bytes, detail the amount of pages and the size of the data retrieved during the SELECT statement. As these statistics show, the LOB access statistics provide granular tracking of LOB activity.
![]()
Figure 3-29. Query results for page latch
Index Operational Stats Summary
This section discussed the statistics available in the DMO sys.dm_db_index_operational_stats. While it isn’t a DMO that is widely used, it does provide a lot of low-level detail regarding indexes that can be leveraged to dig deep into how indexes are behaving. From the columns on DML and SELECT activity to locking contention to compression, the columns in this DMO provide a wealth of information.
The last area of statistics that SQL Server collects is the index physical stats. These statistics report the information about the current structure of the index along with the physical effect of insert, update, and delete operations on indexes. These statistics are collected in the DMO sys.dm_db_index_physical_stats.
Just like sys.dm_db_index_operational_stats, sys.dm_db_index_physical_stats is a dynamic management function. To use the DMF, a number of parameters need to be supplied when it is used. Listing 3-43 details the parameters for the DMF.
The mode parameter for sys.dm_db_index_physical_stats accepts one of five values: DEFAULT, NULL, LIMITED, SAMPLED, or DETAILED. DEFAULT, NULL, and LIMITED are in effect the same value and will be described together. Table 3-19 lists the parameters.
Table 3-19. Parameters for sys.dm_db_index_physical_stats
|
Parameter Name |
Description |
|---|---|
|
LIMITED |
The fastest mode that scans the smallest number of pages. For an index, only the parent-level pages of the B-tree are scanned. In a heap, only the associated PFS and IAM pages are examined. |
|
SAMPLED |
This mode returns statistics based on a 1 percent sample of all the pages in the index or heap. If the index or heap has fewer than 10,000 pages, DETAILED mode is used instead of SAMPLED. |
|
DETAILED |
This mode scans all pages, both leaf and nonleaf, of an index and returns all statistics. |
![]() Note The DMF sys.dm_db_index_physical_stats can accept the use of the Transact SQL functions DB_ID() and OBJECT_ID(). These functions can be used for the parameters database_id and object_id, respectively.
Note The DMF sys.dm_db_index_physical_stats can accept the use of the Transact SQL functions DB_ID() and OBJECT_ID(). These functions can be used for the parameters database_id and object_id, respectively.
When executed, there are three areas of information that are reported from the DMF: header columns, row statistics, and fragmentation statistics. One word of caution: this DMF gathers the information that it reports as it is executed. If your system is heavily used, this DMF can interfere with production workloads.
Header Columns
The first set of columns returned from sys.dm_db_index_physical_stats are the header columns. These columns provide metadata and descriptive information around the types of information that are included in that row of the results. The header columns for this are listed in Table 3-20. The most important information to pay attention to when looking at the header columns are the alloc_unit_type_desc and index_level. These two columns provide information on what type of data is being reported on and where in the index the statistics are originating from.
Table 3-20. Header Columns for sys.dm_db_index_physical_stats
|
Column Name |
Data Type |
Description |
|---|---|---|
|
database_id |
smallint |
Database ID of the table or view |
|
object_id |
int |
Object ID of the table or view that the index is on |
|
index_id |
int |
Index ID of an index |
|
partition_number |
int |
1-based partition number within the owning object: a table, view, or index |
|
index_type_desc |
nvarchar(60) |
Description of the index type |
|
alloc_unit_type_desc |
nvarchar(60) |
Description of the allocation unit type |
|
index_depth |
tinyint |
Number of index levels |
|
index_level |
tinyint |
Current level of the index |
Row Statistics
The second group of columns in sys.dm_db_index_physical_stats is the row statistics columns. These columns provide statistics on the rows contained in the index, shown in Table 3-21. From the number of pages in the index to the record count, these columns provide some general statistics along these lines. There are a few items of interest in these columns that can be quite useful.
Table 3-21. Row Statistics Columns for sys.dm_db_index_physical_stats
|
Column Name |
Data Type |
Description |
|---|---|---|
|
page_count |
bigint |
Total number of index or data pages |
|
record_count |
bigint |
Total number of records |
|
ghost_record_count |
bigint |
Number of ghost records ready for removal by the ghost cleanup task in the allocation unit |
|
version_ghost_record_count |
bigint |
Number of ghost records retained by an outstanding snapshot isolation transaction in an allocation unit |
|
min_record_size_in_bytes |
int |
Minimum record size in bytes |
|
max_record_size_in_bytes |
int |
Maximum record size in bytes |
|
avg_record_size_in_bytes |
float |
Average record size in bytes |
|
forwarded_record_count |
bigint |
Number of records in a heap that have forward pointers to another data location |
|
compressed_page_count |
bigint |
The number of compressed pages |
The first items of interest are the columns ghost_record_count and version_ghost_record_count. These columns provide a breakdown of the ghost_record_count found in sys.dm_db_index_operational_stats.
The next column to check is forwarded_record_count. This column provides an accounting to the number of forwarded records in a heap. This was discussed some in sys.dm_db_index_operational_stats with the forwarded_fetch_count column. In that DMF, the count was because of the number of times that forwarded records were accessed. In sys.dm_db_index_operational_stats, the count refers to the number of forwarded records that exist within the table.
The last column to look at is compressed _page_count. The compressed page count provides a count of all the pages in an index that have been compressed. This helps provide a measure of value in having pages compressed by PAGE-level compression.
Fragmentation Statistics
The last group of statistics in the DMF are the fragmentation statistics. For the most part, fragmentation is what most frequently turns people to looking at sys.dm_db_index_physical_stats. Fragmentation occurs in indexes when rows are inserted or modified in an index where the row no longer fits on the page where the index should be placed. When this happens, the page is split to move half of the page to another page. Since there usually isn’t a contiguous page available after the page that has been split, the page gets moved to an available free page. This results in gaps in an index where pages are expected to be continuous, preventing SQL Server from completing sequential reads while reading an index on disk.
There are four columns, shown in Table 3-22, that provide the information needed to analyze the state of fragmentation within an index. Each of these helps provide a view on the extent of the fragmentation and assists in determining how to resolve or mitigate the fragmentation.
Table 3-22. Fragmentation Statistics Columns for sys.dm_db_index_physical_stats
|
Column Name |
Data Type |
Description |
|---|---|---|
|
avg_fragmentation_in_percent |
float |
Logical fragmentation for indexes or extent fragmentation for heaps in the IN_ROW_DATA allocation unit |
|
fragment_count |
bigint |
Number of fragments in the leaf level of an IN_ROW_DATA allocation unit |
|
avg_fragment_size_in_pages |
float |
Average number of pages in one fragment in the leaf level of an IN_ROW_DATA allocation unit |
|
avg_page_space_used_in_percent |
float |
Average percentage of available data storage space used in all pages |
The first fragment column is the avg_fragmentation_in_percent. This column provides a percent count of the amount of fragmentation in an index. As fragmentation increases, SQL Server will likely see an increase in the amount of physical I/Os required to retrieve data from database. Using this column, you can build a maintenance plan to mitigate fragmentation by either rebuilding or reorganizing the index. The general guideline is to reorganize indexes with less than 30 percent fragmentation and to rebuild indexes with more than 30 percent fragmentation.
The next column, fragment_count, provides a count of all the fragments in an index. For each fragment created in an index, this column will summarize a count of those pages.
The third column is avg_fragment_size_in_pages. This column represents the average number of page that is in each fragment. The higher this value is and the closer it is to page_count, the less I/O that SQL Server requires to read the data.
The last column is avg_page_space_used_in_percent. This column provides information on the amount of space available on pages. An index with little DML activity should be as close to 100 percent as possible. If there are no updates expected on an index, the goal should be to have the index as compacted as possible.
Index Physical Stats Summary
The primary purpose in looking at sys.dm_db_index_physical_stats is to help guide index maintenance. Through this DMF, statistics at every level of an index can be analyzed. Through this, the appropriate amount of maintenance for each level of an index can be identified. Whether the need is to defragment the index, modify the fill factor, or pad the index, the information in sys.dm_db_index_physical_stats can help guide this activity.
Summary
In this chapter, you looked at the statistical information available in SQL Server on indexes. From statistics on cardinality to the physical layout of an index, you learned what information is available and how to retrieve it. For the most part, this information is the tip of the iceberg. In upcoming chapters, you’ll leverage this information by looking at the statistics that have been captured and leveraging them to improve your ability to index your database.