
CHAPTER 13
Technical Analysis
I always laugh at people who say they’ve never met a rich technician.
—Martin Schwartz
I’ve never met a rich technician.
—Jim Rogers
Disclaimer: This chapter is not meant to provide a tutorial in technical analysis. There are a number of classic references on this subject: John Murphy’s Technical Analysis of the Financial Markets, Martin Pring’s Technical Analysis Explained, and Jack Schwager’s Getting Started in Technical Analysis. What we hope to do here is to ensure that the reader knows the names of some of the more popular approaches, to try to explain why it may be worthwhile gaining some familiarity with one or more of these techniques, especially in the FX markets, and to identify how this “art” is evolving into a “science.”
INTRODUCTION
As we mentioned briefly in our discussion of marketmaking, there are two primary avenues of analysis that attempt to gain an insight into whether a market is going up or going down: fundamental analysis and technical analysis. Fundamental analysis (also known colloquially as “demand and supply”) purports to provide an understanding of the underlying economic factors that are influencing buyers and sellers, and, thereby, to gain some insights or advantages in predicting future price movements. Technical analysis is an entirely different paradigm. Utterly eschewing the underlying economic drivers, technical analysts focus solely on past price movements, trends, and patterns in an effort to gain an understanding of where markets are headed next.
When I was studying economics and finance at the University of Chicago, most of my professors (most of whom had Nobel Prizes in Economic Science) told us that technical analysis was (using singularly stronger language than what I report here) “nonsense”; their justification usually turned on an argument set forth by Milton Friedman, who reasoned that it would take only a very small number of entrepreneurial individuals to exploit any market inefficiency and, in doing so, to make the markets efficient (in the sense that consistent arbitrage would not be possible). Or, at the very least, if the data were conscientiously obtained and analyzed properly, this would reinforce the notion that there is “no free lunch” available in the financial markets.
Because past price data is now generally and widely available and because there are presumably a large number of smart market participants looking at it, examining it, modeling it, searching for patterns, opportunities, signals, recurring themes, the thought that there might be value for any one individual in analyzing that same information is, at best, tenuous. The notion behind efficient markets—that the market’s best guess of where the price is going next is where it is right now—suggests that technical analysis cannot “work.” Friedman might even add that, if someone did stumble across a process that purported to identify a profitable trading strategy based on reviewing some past price history, then the act of trading on that information would tend to eliminate the profitability of that strategy and the informational content of the data.
What was I to think, then, when I left the academic community (still brandishing my University of Chicago “efficient markets” tattoo) and entered the rank and file of market practitioners, who every morning, often before the sun came up, pulled out their charts, examined their resistance and support levels, analyzed their Elliott waves, reviewed their Japanese candlesticks (“Oh my, it’s a shooting star!”), consulted their Fibonacci numbers, and looked at their flags, pennants, relative strength indices, momentum figures, and so on?
My professors, for the most part (independent of their million dollar Nobel prizes), were living in unimpressive homes and apartments on the south side of Chicago and drove old Chevy Impalas; these traders drove brand new Jaguars and Ferraris and lived in multi-million dollar estates in the suburbs. Is there something to technical analysis? I believe that there is probably some value to this discipline, but we have to ask, “What and why?”
Bill Gross, CIO of PIMCO, has written, “Technical analysts are the witch doctors of our business,” but, in the same breath, Gross confesses, “Well, there’s something to it, I’ll admit . . .”1
WHAT IS TECHNICAL ANALYSIS?
Technical analysis is that umbrella-like characterization associated with the various methods of examination of past price data (in one representative form or another) with a view to gleaning from that information some insight into where that market price is headed. Most of those who practice this art will describe it as such (that is, “an art”), but increasingly “(i)n recent years . . . more open minded academics and practitioners have joined forces and created the nascent field . . . (s)upported by advanced risk management techniques, mathematical theories, and the power of modern computers”.2 There are sometimes more efficient ways of looking at data and, increasingly, market participants have employed the following modern tools as they have become more widely accessible: artificial intelligence, neural networks, and genetic algorithms.
Traditionally, technical analysis was synonymous with charting. If one traded, say, soybeans, then one could attempt to discern the direction of their market price based on the past price history of soybeans (and usually one only looked at the past price history of soybeans). There are some aphorisms that tend to circulate around the financial markets. One of the most common is, “The trend is your friend.” If the price of soybeans has been rising, buy them, because the trend is positive or upward; if the trend were southerly, sell them. Prior to the availability of modern computers and access to historical price databases, many market participants kept track of (i.e., recorded) these prices themselves. The most common form of representation for this data was a chart—a picture of the numbers transmitted to graph paper. Many of the approaches employed by technicians (those engaged in the practice of technical analysis) involve attempting to identify the trend (and patterns within the trend, and deviations from that trend, and reversals of the trend, and so on).
METHODS OF TECHNICAL ANALYSIS
There are many ways to summarize past price information. The simplest approach is simply to connect the dots (i.e., to look at a continuous graph of past prices). See Figure 13.1.
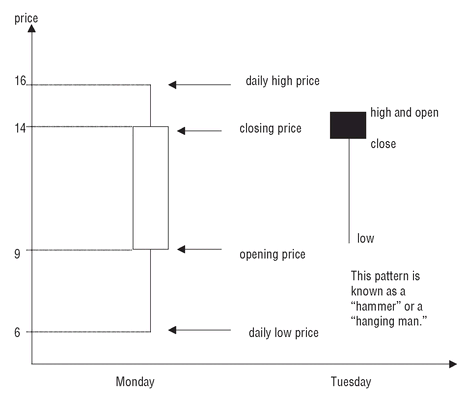
Whenever you analyze data, though, one must make a number of decisions (i.e., “judgement calls”). Will you look at continuous data or high frequency data (sometimes called “tick data”) or periodic data (e.g., prices at 10-minute intervals) or daily closing prices or weekly price moves? Will the prices you examine be trade prices or the bid-ask spread or midmarket prices? If looking at periodic trade data, what will you do if there was no trade? Can you look at prices and traded volume simultaneously? If you decide to summarize or compress daily data, what might you like to be able to see? You might like to know where the asset price opened that day, the highest price realized that day, the lowest price realized that day (and, obviously, knowing the high and the low, you would know the daily range in which that price moved), where the asset price closed on the day. How to summarize all these facts? One approach that is very popular is known as Japanese candlesticks. This method summarizes a time interval’s price action in a simple picture. The body of the candlestick is white if the end (closing) price is higher than the start (opening) price; it is black when the close is lower than the open. The range is identified by the height of the candlestick—including the wick(s) or shadow(s) that extend from the top and bottom of the candle. See Figure 13.2.
FIGURE 13.1 A Chart of Past Price History

In condensing the day’s trading data from a time series of prices into a vertical pictogram, you lose detail (as is always the case when you summarize information). In other words, the precise path that the prices followed is unknown. To see this, observe the very different looking price paths in Figure 13.3, which generate the same candlestick.
Moreover, looking at the shape and “color” of one Japanese candlestick is said not to be, in any way, sufficient to indicate market direction. A candlestick history (a collective pattern of shapes and trends) is presumably needed to really tell the whole story.
FIGURE 13.2 Japanese Candlesticks
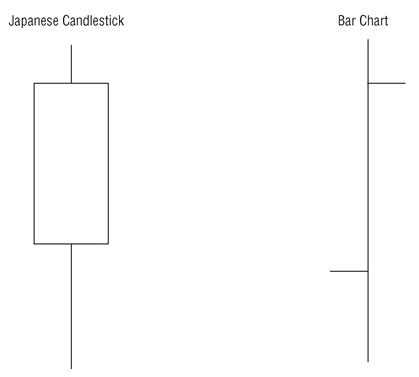
Bar charts, summarizing similar information (open, high, low, and close) are also used by technicians, but the ease of reading Japanese candlesticks presumably makes them an attractive (and often preferred) graphing or charting instrument. The difference between a Japanese candlestick and a bar chart can be seen in Figure 13.4.
Other Approaches
Data can be represented in many forms. If one believes that trade or market data is “noisy” (in the sense that there are a great deal of fluctuations about the true underlying trend), then the technician may be inclined to try to “smooth” the time series. This can be done with the assistance of moving averages. A moving average simply summarizes the running “statistical mean,” which, if a set of consecutive data points are used to generate each average “point,” will tend to smooth the numbers and presumably help identify a trend. Significance (market, not statistical) is often attributed to that point in time when a moving average of a certain length (say, the 30-day moving average) “crosses” a moving average of another length (say, the 90-day moving average). Just as identifying a trend is one of the goals of technical analysis, so, too, is the identification of the reversal of a trend; a 30-day moving average crossing a 90-day moving average might be said to possibly confirm a trend reversal. This approach is said to help “time the market.” Timing the market (i.e., identifying entry or exit points) is one area in which technicians attempt to add value for traders and portfolio managers.
Both of the following price histories would result in the same Japanese candlestick.
FIGURE 13.3 Different Data—Same Candlestick (Some Pictures Summarizing Data Lose Detail)

FIGURE 13.4 Japanese Candlestick versus Bar Chart
Similarly, if prices are subject to a degree of randomness, then one might acknowledge that there is some range of uncertainty associated with the data at which one looks; the source of the variability arises from a variety of sources, including fickle investors, delayed data reporting, bad information, and so on. Some techniques seek to identify when prices break out of a range. One of the more popular approaches involves Bollinger bands, but there are also cloud patterns and other techniques that help define breakouts to the upside and downside.
One of the more popular schools of technical analysis is Elliott Wave Theory. This discipline, pioneered by Ralph Nelson Elliott in the 1930s, examines price data in an effort to discern a certain commonly recurring configuration; this pattern is generally thought to consist of five waves with the trend (e.g., in the case of a “bullish” market, up-down-up-down-up) known as a “motion wave” followed by three corrective waves (e.g., a “bearish” retracement, down-up-down). These waves are given identifying labels; the trend wave is generally designated 1-2-3-4-5 and the corrective wave, A-B-C or a-b-c. It is most easily described on a graph; see Figure 13.5.
It is said that financial data often exhibits this pattern in a “fractal” way in the sense that you can identify the five up waves followed by three down waves within each leg of a larger five-upward, three-downward pattern.
There are other methods of analysis for cyclical financial data such as Dow Theory. Another common technical analysis approach is pattern recognition that look at some commonly recurring shapes or tendencies in financial data, identified by such names as head-and-shoulders, pennants, flags, double tops, triple bottoms, and so on. As an example, a formulating head-and-shoulders pattern may suggest, as in Figure 13.6a, that the price will continue rising until the “shoulder” or “neck line” and then “retrace” (as suggested by the dotted line). A “pennant” is a “consolidating” pattern that supposedly suggests that the price will run (one way or the other—again suggested by the dotted lines) once either the upper resistance line or lower support line is broken; see Figure 13.6b.
FIGURE 13.5 A Typical Elliott Wave

Patterns may be one way to understand qualitative price behavior, but having some quantitative sense of where those prices may go, or, having an understanding of what a specific percentage price move might mean for future directional price changes, one needs a numerical foundation. The most cited numbers in technical analysis are Fibonacci numbers. Attributed to Leonardo Fibonacci’s work of the 1200s, a Fibonacci sequence is formed by adding the two previous numbers in a sequence. For example:
1, 2, 3, 5, 8, 13, 21, 34, 55, 89, 144, 233, 377, . . .
In the limit, the ratio of one term to the following term is approximately .618. Followers of Fibonacci place great significance on relative price moves of .618, .382 (which happens to be 1 – .618), and .50.
The analyses, techniques, or theories that we have mentioned so far are in no way exhaustive. There are also Gann Studies or Gann Angles, point and figure charts, stochastics, relative strength indices (RSI), and a number of other approaches.
FIGURE 13.6a A Head-and-Shoulders Pattern

FIGURE 13.6b A Pennant Pattern

TECHNICAL ANALYSIS IN FOREIGN EXCHANGE
It would be difficult to find many market professionals in foreign exchange who do not look at technicals in one way or another. Some of the more sophisticated may identify their approach as “statistical arbitrage” at the same time others (who are less convinced of the “free lunch”) refer to “black-box trading.” Is there more to technical analysis in foreign exchange than in other markets? Good question.
At the end of the day, I am an economist and I believe that if you see USD|JPY bouncing off 120.00 from below, there’s a reason for that. If net buying drives prices up, then it must be selling that forces the exchange rate down. How do I know that somebody is selling Dollars at 120? As an institution that accepts limit orders for contingent execution, we may know there will be selling at 120 because we are going to sell (on behalf of one of our clients) if USD|JPY ever gets there. Furthermore, there is occasionally, though less frequently, central bank intervention (and this may transpire because the Bank of Japan has decided to sell U.S. Dollars at 120). Moreover, in order to hedge an exotic out-strike (that is, a large position from a barrier option with an out-strike, for example, at 120), market participants (like UBS) may have to sell a huge amount of Dollars as we approach that level in order to maintain a dynamically “delta neutral” position or “flat” book. If our counterparties were to randomly choose their barriers (at, for example, 119.73), perhaps we would not see the large trading activity at 120, but market participants often choose their barriers at nice round (or significant) numbers (e.g., 120, the figure). For all of these reasons, ultimately founded on and explainable by the actual underlying trading activity, there may well be a resistance level at 120.00. See Figure 13.7. Finally, over and above limit orders, central bank intervention, and barrier options, there may also be some psychology at work in the market; this is the notion of a “self-fulfilling prophecy” in which, because a sufficiently large number of foreign exchange participants think something will happen, then it actually will happen.3
Technical analysts sometimes suggest that if a significant resistance level (like 120) is breached, then there could be a sharp rise in the exchange rate. If the Bank of Japan were to stop defending that level (120) or if all the limit orders (to sell Dollars at 120) were filled, perhaps it would be no surprise that there would be an upward jump in the exchange rate (possibly to the next significant level).
FIGURE 13.7 USD|JPY Resistance Level at 120.00

Even some of those client-facing individuals at banks/broker dealers who are not believers in technical analysis still look at the charts—for two reasons. First, they know that some of their clients are watching these numbers and patterns; they want to be involved in that exchange and they also want to be informed when discussing market strategy. Just because a waiter can’t stand Brussels sprouts, it should not preclude him from serving them to a customer who does want them. Second, some salespeople understand that technical analysis may provide them with something interesting to talk about (a “story”) that may lead to a positive interaction with a client (e.g., “Did you see that the three-month moving average just crossed the one-month moving average?”).
TECHNICAL ANALYSISTODAY
The number of individuals who are actively involved in the FX markets has exploded [as a result of ubiquitous computing power, electronic communications networks (ECNs), direct market access tools and firms, the proliferation of information, and so on]. The market has responded by supplying trading tools to these day traders and smaller investors. There are more technical systems available than one can count. Each presumes to represent the holy grail for the individual investor/trader (up to the fiduciary responsibility disclaimer, that is). Nevertheless, technical analysis software seems to be proliferating at an incredible rate. Even the professional traders and marketmakers are engaging in “algorithmic trading,” which, at its core, attempts to expedite market orders at a lower cost and in more efficient ways by taking into account patterns, such as trends, trading volumes, and other data.
Dave Toth, former U.S. head of technical analysis at UBS (who has gone on to manage money himself at CEC Capital, LLC in Chicago) stressed that the different approaches or theories on technical analysis do not compete with one another, but rather are simply different ways of saying the same thing. After all, Dave notes, “various technical theories like Elliott Wave, Dow, and candlesticks, for the most part, simply use different terminology to describe where any market may be within one of its three technical states—trending, consolidating, or reversing.” “Elliott is to Dow is to candlesticks as English is to French is to Spanish.”
SUMMARY
There is no doubt that one would be hard-pressed to find a trader, portfolio manager, hedge fund principal, or investment professional who would not want an edge or advantage over the market if such was legally available and cost effective. For that reason alone, many individuals in the financial markets look at some sort of technical analysis.
The representations, tools, techniques, systems, graphs, and screens may take on very different looks, but, in the end, they are all intended to summarize past price action with the goal of obtaining some insight into where the price will be in the future.
Whether one looks at charts, Japanese candlesticks, Elliott waves, Fibonacci numbers, moving averages, pattern recognition, Dow cycles, Gann Studies, relative strength indices (RSI), stochastics, cloud patterns, Bollinger bands, or some other more statistically-grounded approach, technical analysis is meant to discern market direction.
Ultimately, Jason Perl, global head of the technical strategy group at UBS has stated that although some may have the impression that technical analysis assumes some sort of market inefficiency, he starts from the presumption that the FX markets are extremely efficient, which is why he feels very comfortable focusing on past prices and does not feel the need to employ multifactor econometric models. I might add that, as an economist, I believe the foreign exchange markets are very efficient (by just about any criteria one might consider). Furthermore, as an economist, I am a believer in the theory of “revealed preference”; this means that you can infer an individual’s or organization’s preferences (what they value) by observing what they do, how they spend, and so on. Most of the major currency dealing banks employ a team of technical analysts who serve as a resource for their employees and their clients. Somebody believes in the value of technical analysis.4
For a discipline that purports to be quantitative in nature, though, one would think that technical analysis and its predictions could be utterly and directly evaluated by simple (or at least straightforward) statistical analyses, but these techniques, for years, avoided the scrutiny of careful and sophisticated statistical analyses driven, I believe, in large part by two factors: the disdain held for technical analysis on the part of the academic community, which is responsible for the majority of published research, and the fact that there are very few schools that seriously teach these approaches, techniques, and disciplines (and so the academic world has remained extremely ignorant of technical analysis).5 Blake LeBaron and others in the academic community have only relatively recently (and increasingly) sought to either confirm or rule out the effectiveness (as gauged by overall net expected, and statistically significantly, positive returns) associated with a variety of classes of FX trading rules.6 But things are changing; Felix Gasser writes:
Technical analysis (TA) is defined as the analysis of pure market price movement as time series called charts. Although this is a clear definition, anyone who has read a book on TA knows it’s not necessarily straightforward. If we include all the tools and theories labeled technical—from the highly scientific to the rather esoteric—the subject can become controversial and confusing. The flood of technical instruments has turned TA into an alchemist’s melting pot, resulting in skepticism especially among the academic community. On the other hand, the influx from other disciplines, most of all statistics and the computer sciences, have added powerful analytical tools, strengthening the position of TA as a valid discipline in the investment community and increasingly in academia as well.7
..................Content has been hidden....................
You can't read the all page of ebook, please click here login for view all page.