
2
Computer Science
The Incredible Shrinking Woman
Computer science only recently emerged as a discipline with its own identity during the latter half of the 20th century. In that short time, it has experienced both incredible growth and serious growing pains, particularly with respect to the representation of women. The percentage of women has steadily increased over the last 40 years in almost all science, technology, engineering, and math (STEM) disciplines. However, what is uniquely perplexing about computer science is that the proportion of women undergraduates has been steadily dropping for 20 years. This long-term drop in the proportion of women is counter to the trends in all other STEM disciplines, and the causes have largely been a mystery.
The primary aims of this chapter are to present data from national data sets on the representation of women in multiple STEM fields over time (1966–2006), so as to characterize the extent and depth of this phenomenon, and propose a possible explanation for the recent decline in the proportion of undergraduate women in computer science. Additionally, the chapter will outline continuing research questions important for better understanding the phenomenon, and discuss several approaches for change.
The breadth of data presented in this chapter is intended to provide a numerical “big picture” of the status of women in computer science education over a 40-year time span. The data will be used to show the following:
- The growth of computer science as an educational discipline,
- The changing representation of women at multiple levels of educational achievement (undergraduate, graduate, and faculty), and
- The changing representation of women in the computing workforce, illustrating parallels between computing education and the workforce.
These data reveal a complex and multilayered picture of computer science. It grew rapidly from an esoteric field of study in the mid-1960s to a popular major by the mid-1980s, only 20 years later. However, once established, the proportion of women earning computer science undergraduate degrees started to fall in the mid-1980s and has continued to do so for 20 years. While there are many possible explanations for why this might be so, this chapter proposes that as the popularity of computer science increased, so did the general public awareness of stereotypes depicting computer scientists as male “computer nerds” and “hackers.” The increasing prevalence of these stereotypes from the 1980s through the present day may have contributed to a decline in the proportion of women choosing computer science.
Other chapters in this volume provide further insights into this issue through a variety of qualitative data sources. Chapters 8 and 9 suggest that news, advertising, and other media have played a large role in establishing, spreading, and perpetuating images of men as the decision makers, experts, and innovators in computing, and women as “computer phobes” or users who merely execute the instructions of men. Furthermore, Chapters 10 and 11 show that the reality of many women’s experiences in computing have been quite different from these stereotypes.
Finally, if an overly masculine image is part of the problem, then an image “makeover” may be just what is needed to bring more gender balance to computer science, as well as to other historically male-dominated disciplines such as engineering (see Chapters 12 and 13).
UNEXPLAINED DIFFERENCES
Over the last 40 years, there have been great increases in the number of women in many traditionally male-dominated professions such as law and medicine. However, women have not entered all such professions at the same rates. For example, in 2007 medical schools in the United States graduated 49% women [1] while computer science programs graduated only 20% women with bachelor of science degrees and 21% women with doctoral degrees [2]. Literature on women in STEM fields (science, technology, engineering, and math) documents many factors that have made it difficult for women to gain acceptance in traditionally male-dominated professions, including a dearth of female role models [3,4], stereotypes of women and their skills which are often at odds with stereotypes of people working in traditionally male fields [5], implicit gender biases [6], and reluctance, often unconscious, from people in positions of power to include women in their informal networks or to act as their professional allies [7].
However, since these factors apply to all historically male-dominated disciplines, they do not adequately explain why fields such as law, medicine, psychology, and biological sciences have achieved higher representation of women than has computer science. Women are still dramatically underrepresented in computer science, as well as in disciplines such as engineering and physics. However, what is most unusual about computer science is that the representation of women undergraduates has been falling steadily for 20 years, and this trend shows no signs of reversing. While a few other fields experienced small temporary drops in the percentage of women undergraduates during the late 1980s and early 1990s, none have experienced a decline of this size or duration. If this trend were to continue at the rate experienced from 1986 to 2006, there will be no women bachelor degree graduates in computer science by 2032.
Many existing hypotheses for the small proportions of women in computer science do not explain why computer science has followed a trend so different from other STEM disciplines. For example, it is often stated that women avoid computer science because they don’t like math. However, statistics show that since 1985 between 45% and 50% of the bachelor degrees in math have been awarded to women (see Fig. 2.2), which certainly does not suggest that women stay away from math intensive curricula. Another explanation offered by Margolis and Fisher is that the male-oriented culture of computer science is not welcoming to women [5]. While this is true, Blum and Frieze report a case study in which the culture within the undergraduate computer science program at Carnegie Mellon University became more equitable as the proportions of men and women students became more balanced [8]. So is the male-oriented culture in computer science a reason for—or a result of—the lack of women? Furthermore, all historically male-dominated fields started out presumably with male-oriented cultures. Yet many have achieved gender parity (if not equity) and none have shown large, long-term declines in the representation of women. There must be additional factors that explain the unprecedented decline in computer science.
A critical step toward understanding and changing a situation is assessment of the past and current situation. Toward this end, this chapter will present and analyze data on the representation of women from several national data sets over time (1966–2006), across multiple STEM fields, and at multiple levels (undergraduate, graduate, and faculty). Data sources used in this work include the National Science Foundation, the National Center for Women and Information Technology, Nelson’s data on women and minorities in STEM disciplines at research universities, and the Bureau of Labor Statistics [9–13]. This analysis focuses primarily (but not exclusively) on higher education in the United States because of the ready availability of these data sets, the potential for higher education to impact the career choices of both men and women, and the need to limit the scope of this study to make it manageable.
It is essential that we, as a society, understand and overcome the barriers for women in computing; it is necessary to develop as much potential talent as possible if we are to have a sufficient number of computing professionals to support continuing and future development of the high-tech information technology intensive economy [12]. It is also necessary to have a diverse information technology workforce to maximize the vibrancy and creativity of the ideas it produces. Finally, as Blum and Frieze discovered, strategies for change that can attract highly talented women will likely attract diverse and talented computer scientists of both genders and improve the climate for all [8,14].
STATUS OF WOMEN IN PROFESSIONAL LIFE
There are several trends that appear to be common across practically all fields. First, the proportion of women has been steadily increasing for 40 or more years. Second, regardless of whether a field is male dominated or not, there are proportionately fewer women holding management and leadership positions relative to other positions. Third, women continue to be promoted more slowly and paid less, even at comparable levels of accomplishment. Thus, while the situation is changing for both men and women, equal numbers may not mean equal status.
From the beginning of the 20th century, women earned degrees at colleges and universities, although the proportion of women graduates earning STEM degrees was relatively small prior to 1960 [4]. However, between the late 1960s and today the participation of women in STEM fields has increased dramatically, with particularly rapid changes occurring during the 1970s and early 1980s. In 1960, slightly more than 40% of bachelor degrees and roughly 8% of doctoral degrees were awarded to women at American educational institutions. Now, more than 60% of all bachelor degrees and almost 50% of all doctoral degrees are awarded to women in the United States [15].
However, even in such fields as law, medicine, and publishing, where women are relatively well represented among the graduates, they are not as well represented in the higher prestige, higher paying subfields. Furthermore, they are rare in leadership roles such as upper management [3,4]. In fields such as computer science, where women are scarce, the number of women in high-level leadership roles is very small. For example, in the author’s own science and engineering college, there has never been a woman department head or dean in its 75-year history [16]. Thus, to get a complete picture of the status of women in any field it is necessary to look at more than just the numbers of male and female graduates. Ideally, one must also examine what happens after graduation [15]. What type of positions do women hold? How receptive and supportive is the working environment for women? What salaries do they command? Are there opportunities for them to take leadership roles capable of shaping a field? While it would be difficult to examine all of these factors in this chapter, it will examine leadership roles held by women in higher education (faculty positions).
In fields where there are relatively few women, such as computer science and engineering, all of the challenges above can be exacerbated. Evaluation biases favoring men may be particularly strong in fields where there are few women [17]. Evaluation bias is the tendency to judge people’s talents more positively when they match the stereotype for a discipline; such biases can differentially impact the rates at which men and women are hired, retained, or promoted in male-dominated fields. Nelson reports that women in science and engineering are tenured at half the rate as men [11]. Other women drop out voluntarily, citing a variety of reasons ranging from an inhospitable climate to overwhelming pressure from a combination of professional and family demands [15]. Those who do stay are paid, on average, less than their male counterparts, even after controlling for variables including institution type, discipline, rank, teaching, and publications [15].
CHANGING REPRESENTATION OF WOMEN IN COMPUTER SCIENCE
Women and Computer Science Degrees
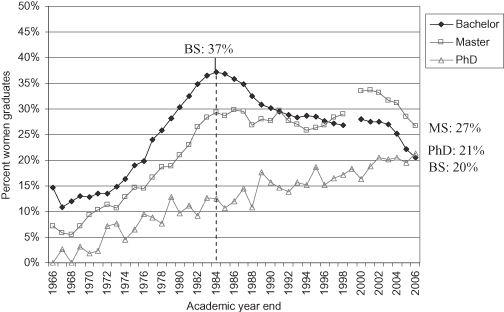
Figure 2.1 shows the proportion of women earning bachelor, master, and doctoral degrees in computer science [9]. The interval between 1972 and 1984 was a period of rapid growth in the proportion of women earning all types of degrees, including computer science (CS), possibly as a result of the women’s movement. However, 1984 marked a turning point and the start of a long and statistically significant period of decline in the proportion of women earning CS bachelor degrees, and this decline has continued through the current day [18,19].
Figure 2.1. Proportions of women receiving BS, MS, and Ph.D. degrees in computer science in the United States [9].
The central question to be explored in the remainder of this chapter is “Why?” While this is too large of a question to answer completely in one chapter or even one book, by exploring numerical trends in education and workforce across multiple STEM fields, this study will identify differences between computer science and other fields. These differences provide clues to why computer science has followed such a different path than other disciplines with respect to gender composition, and may suggest areas in which to focus future investigations.
The following are several numerical “snapshots” at roughly 20-year intervals illustrating the changes in the representation of women over time:
- 1967: Only 11% of the people receiving computer science bachelor degrees were women; 24 were awarded to women out of a total of 222 earned that year.
- 1984: The proportion of women earning CS bachelor degrees peaked; women were earning 37% of all CS bachelor degrees (12,066 out of a total 32,435).
- 2006: After the turning point in 1984, the proportion of women earning CS bachelor degrees fell over a period of 22 years to only 20% (14,406 out of 57,405). A recent Taulbee survey of North American computer science departments shows this downward trend has continued into 2007 [19].
On a positive note, the HERI/USC freshmen survey, in which freshmen are asked to state their intended major, suggests that this decline may level out over the next few years, but it is not yet clear at what level [20].
These data raise many questions, such as “Why did the proportion of women undergraduates in computer science programs fall after 1984?” and “Is the problem isolated to CS undergraduates, or does it extend to other areas such as the workforce and leadership levels as well?” However, to answer these, one must first ask “Is the situation in computer science unusual relative to other disciplines?” and if so, “How unusual?”
Women and Undergraduate STEM Degrees
Figure 2.2 shows the National Science Foundation’s data on the changing proportions of bachelor degrees awarded to women in a variety of STEM and non-STEM disciplines over the past four decades (1966 to 2006) [9]. Computer science is represented by the solid black line almost at the bottom. (Solid or dotted lines in the figure represent individual disciplines, while lines marked with symbols, squares, triangles, and so on represent aggregates of several disciplines.) As a baseline for comparison, the dark line marked with circles (close to the top of the graph) shows the percentage of bachelor degrees earned by women across all fields offered in the United States. Note that this baseline has changed over time; women earned 44% of all bachelor degrees in 1966, but they were earning 58% by 2006.
Figure 2.2. Proportions of BS degrees awarded to women in the United States for various disciplines [9].
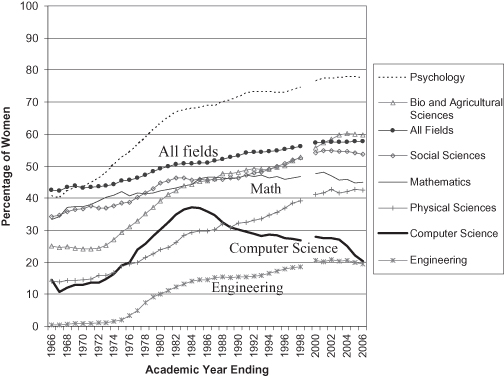
This graph reveals that computer science is unusual in several respects:
- Between 1972 and 1984, the proportion of women earning bachelor degrees increased more rapidly in computer science than in any of the 21 individual STEM disciplines [21] tracked by the National Science Foundation.
- After 1984, computer science was the only one of the 21 STEM disciplines which experienced a marked and prolonged decrease in the participation of women.
Thus, computer science has paradoxically been both a vanguard and a throwback during different time periods.
Looking at overall trends across many fields, the proportion of women has increased in almost all fields at the bachelor’s level, due to increasing participation of women in higher education. Their percentage has grown much faster in STEM than in other fields, particularly during the time period roughly between 1972 and 1984. Surprisingly, the fastest changing field during this time was computer science (which increased 24% between 1972 and 1984) followed closely by economics (which increased 22%).
Increased female participation in the 1970s and early 1980s in all professions may have been a reflection of the feminist movement, which increased women’s interest in having a professional career. The greater increases in STEM fields may have resulted because the feminist movement additionally raised popular awareness that women could have careers in traditionally male-dominated fields. A woman entering college today is much more likely to choose a STEM major than she would have been in 1966; in 1966, 20% of all women bachelor degree graduates were STEM majors, while in 2006, 28% were. This indicates a significant change in the way women are selecting majors; they are choosing traditional “male” STEM fields far more than in former times. However, the exceptional gains in women’s participation in computer science are more difficult to explain. Perhaps, given that computer science was a relatively new and expanding field, women viewed it as a frontier in which the rules had not yet been entirely set; where there were still opportunities to get in on the “ground floor.”
Despite the rapid increases in the 1970s and early 1980s, the percentage of women in computer science started to drop rapidly after 1984, falling 17% over the 22 years between 1984 and 2006. Figure 2.2 makes clear just how unusual this drop is when set in the context of other fields, almost all of which show steady growth in the percentage of women receiving bachelor degrees. However, most lines in Figure 2.2 are actually aggregates of several fields, which might possibly obscure similar behavior in the individual fields. Might one find other STEM fields that follow a pattern similar to computer science if one examined them individually? To find out, we examined 21 STEM fields [21] from the NSF data set, but found none that showed such dramatic or prolonged drops as computer science. Six other STEM fields (biological sciences, earth science, economics, electrical engineering, industrial science, and material science) experienced small drops in the proportion of women ranging from 2% to 5%, over periods ranging from 5 to 11 years starting in the mid- to late 1980s, but they have all since rebounded while computer science has not. These small drops may represent temporary backlash reactions to the large changes of the 1970s and early 1980s. Several fields show almost no change since the 1980s, such as mathematics and sociology, but mathematics has reached almost balanced proportions of men and women at the bachelor’s level (45% women as of 2006), and sociology now has 70% women (as of 2006). More women would create a greater gender imbalance, and great imbalance in either direction is not necessarily healthy in any field.
When examined in the context of other STEM disciplines, computer science appears to be a field of extremes, being both the fastest growing and declining in different time periods with respect to representation of women. The deep decline that has continued over more than 20 years is an alarming trend distinct from any other STEM field examined, and it appears to be continuing still. Has this trend also occurred in the computing workforce, or is it isolated to undergraduate computer science education? Certainly, it has not impacted growth in the proportion of women earning CS doctoral degrees (see Fig. 2.1). Furthermore, the computing workforce has traditionally been augmented by people who may have bachelor degrees in areas other than computer science, or no college degrees, so it does not necessarily follow that the computing workforce must follow the same pattern as undergraduate education.
Women in the Computing Workforce
Figure 2.3 estimates the percentage of women holding various types of computing jobs: computer systems analyst, computer software developer, and data processing and equipment repair. These data were collected by the Bureau of Labor Statistics (BLS) through surveys given to a sample of the general population. Survey respondents were asked to self-report their job category from a list supplied by the BLS [13]. The first two are considered “white-collar” professions; the majority of people holding these positions have 4-year degrees. The last one, data processing and equipment repair is considered more of a trade; the majority of workers do not hold 4-year degrees [22]. All three job categories show rapid increases in the proportion of women up through the late 1980s (or even the mid-1990s for data processing and equipment repair) followed by rapid falloffs continuing through 2006. Thus, it appears the computing workforce does indeed follow a pattern similar to that in undergraduate computer science education, particularly the professional segments (systems analysts and software developers).
Figure 2.3. Percentage of women in the computing workforce in the United States 1971–2006 [13].

It is also worth saying a word about each of the two professional computing job categories. In 1987, computer systems analysts comprised 34% women, while computer software developers (e.g., programmers) comprised 42% women. Incidentally, computer systems analysts have also been better paid on average than computer software developers on average, between 1971 and 2006.
In order to assess just how similar the patterns are (or are not), Figure 2.4 juxtapositions educational data from Figure 2.1, with Bureau of Labor Statistics data estimating the proportion of women in the professional “white-collar” computing workforce (a weighted average of systems analysts and software developers). We chose to focus on the professional jobs (excluding managerial positions) because they are the type most likely to be relevant to the new computer science bachelor degree graduates. The two curves for bachelors and professional workforce follow each other closely, with the workforce trailing 3 years behind the bachelor’s. Thus, when the proportion of women earning bachelor’s degrees rose or fell, the proportion of women in the computing workforce also rose or fell to those same levels three years later.
Figure 2.4. Proportion of women in a sample from the computing workforce [13].
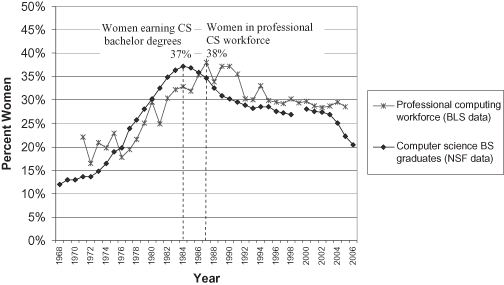
Similarly, the proportion of women earning CS bachelor degrees reached its peak at 37% in 1984, while the professional computing workforce reached its peak at a very similar level of 38% in 1987, 3 years later. A simple set of correlations verifies that this lag is indeed 3 years (and not 2 years, 4 years, or otherwise); the strongest correlation between education and workforce (0.94) is achieved when the workforce data is shifted backwards by 3 years. At the time of this writing, the author has workforce data for only one other comparison field, electrical engineering; the proportion of women working as electrical engineers is also highly correlated with the proportion earning electrical engineering bachelor degrees (correlation 0.89), but with no obvious lag between the two.
What do these data suggest? They may indicate that computer science graduates comprise most of the workers in professional computing jobs, and after some delay as older workers are replaced by new, the proportion of women in the workforce shifts to match the proportions among the newer graduates. However, given that only around 60% of the computing professionals report having 4 years of college education, it suggests that the people in computing jobs are not necessarily the same people who graduated with computer science degrees some year earlier (although perhaps those without college degrees have come from 2-year technical programs in computing). Alternatively, the data may indicate that both the undergraduate and professional populations are shaped by similar social biases about who can or should be a computer scientist. These biases may impact not only the rate at which both women and men choose computer science as a major, but also the rate at which they choose to enter (or leave) computing jobs, regardless of their college training.
More investigation is needed in order to assess whether these or other hypotheses may be true, and to what degree. Our society must better understand the relationship between the demographics of higher education and the workforce if we are to formulate effective interventions. In particular, it is critical to understand to what degree, if any, educational institutions can shape the future computing workforce by influencing more women to choose computer science as their major.
GROWTH OF COMPUTER SCIENCE AS A DISCIPLINE
In looking for possible reasons for and influences on the long and significant decline in the proportion of women in undergraduate computing degrees and computing professions, it is important to understand the larger context. This section examines changes in the overall numbers of people taking computer science degrees and employed in computing professions. While overall numbers without regard to gender do not directly tell the story of women in computer science, they set the stage and provide the context in which it happened.
Growth and Decline as a Field of Undergraduate Study
Early Growth (1966–1986).
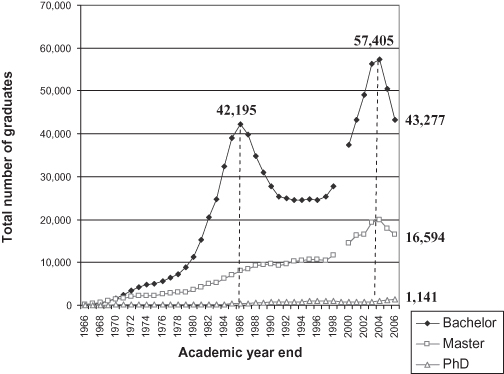
In the 1960s, computer science was a tiny field of study. The first U.S. computer science department was established at Purdue University in 1962 [23]. By 1966, there were still only a handful of colleges and universities that offered computer science degrees; only 89 graduates earned bachelor degrees in computer science, and 19 earned doctoral degrees that year. However, computer science BS programs expanded explosively from the mid-1960s through the mid-1980s, peaking at 42,195 bachelor degree graduates in 1986, as shown in Figure 2.5. This represents a 474-fold increase in only 20 years. This rate of growth is not only unusual relative to other disciplines, it is perhaps unprecedented.
Figure 2.5. Total number of computer science bachelor, master, and doctoral degrees awarded in the United States [9].
A Slump (1986–1996).
For the 10 years between 1986 and 1996, the number of bachelor degrees awarded in CS fell sharply from a peak of 42,195 in 1986 down to 24,545 in 1996, a drop of 41%. Interestingly, this slump in bachelor degrees was not accompanied by a corresponding drop in graduates from computer science MS or Ph.D. programs (see Fig. 2.1), nor in the workforce, which kept right on growing (see Fig. 2.2). We will return to this point later.
Later Growth and Decline (1996–2006).
A second growth period of roughly 8 years peaked at 57,405 bachelor degree graduates in 2004, surpassing the 1986 peak and more than doubling the 1996 numbers. This later period of growth and decline may reflect the “dot.com bubble,” which lasted roughly from 1995 to 2001 [24]. Two years after the end of the dot.com bubble, the number of bachelor degrees granted started to drop again; growth in the workforce also leveled out. This educational trend shows no signs of turning around in the near future. The Taulbee Survey indicates that numbers continued to drop in 2007, and the HERI/USC freshman survey indicates that they are likely to drop further still, down to 1% of all U.S. bachelor degree graduates by 2010, compared with 3% in 2006 (see Fig. 2.3) [19,25]. Historically, this survey has been an accurate predictor. Computer science MS degrees have also dropped off, but doctoral degrees have continued to grow, suggesting that the factors that influence students to earn doctoral degrees may be quite different from those that influence them to earn bachelor and master degrees.
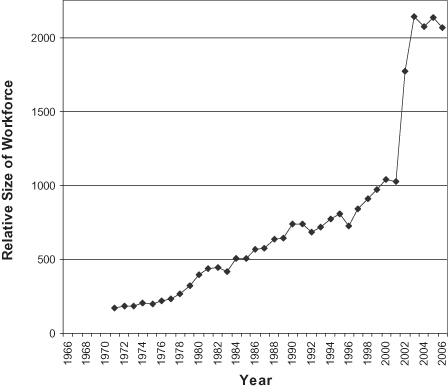
Growth of the Computing Workforce
Figure 2.6 shows that the computing workforce grew rapidly and continually from 1971 through 2003, experiencing a 12-fold expansion during this time period. The computing workforce only recently leveled off after 2003. The data in Figure 2.2 starts at 1971 because the Bureau of Labor Statistics only started tracking computing related professions in 1971, although their database goes back to 1968 for other job titles. The computing workforce expanded more slowly than computer science bachelor degrees, which increased 24-fold in the same time period, but it was a significant expansion relative to professions such as electrical engineering, which remained comparatively level during the same time period [26]. Interestingly, the largest gains ever in the computing workforce occurred immediately after the end of the dot.com bubble, in 2002 and 2003. While dot.coms may have offered some of the most glamorous computing jobs for a time, they did not necessarily represent the majority of computing jobs, given that information technology has become a necessity in most organizations and software is an essential part of many products. Thus, the dot.com crash may have had less impact on computing jobs opportunities than it did on public perceptions of opportunities.
Figure 2.6. Growth in the computing workforce in the United States [13].
Since the proportion of men and women in the white-collar computing workforce closely follows the proportion of men and women earning computer science bachelor degrees, one might also expect total growth in the computing workforce to parallel or in some way mirror total growth in computer science bachelor degrees, but they are only roughly related to each other. Both expanded rapidly in the latter half of the 20th century but the workforce did not experience the large fluctuations seen in education. There are many possible reasons for this; for example, students may use different criteria in choosing majors than jobs; not all computing jobs are filled by people with computer science degrees (“I graduated in English, but now I have to make a living somehow”), and not all computer science majors go on to work in computing jobs (“I graduated in CS but I am burned out on programming now. I prefer technical management.”)
However, this insight impacts interpretation of the previous figure, Figure 2.4. Why did the percentage of women in the computing workforce follow the percentage of women CS bachelor degree graduates, with a 3-year lag? Were these graduates going out and filling these programming and computer analyst jobs, with turnover occurring over a period of 3 years? To some extent this may be true, but Figures 2.5 and 2.6 indicate that the people in the computing workforce do not all come from computer science backgrounds: how else could the computing workforce grow while bachelor degrees stagnate? Social forces may also be independently shaping who chooses to study computer science, as well as who chooses to take computing jobs (regardless of their undergraduate training), and stay.
Growth Relative to Other Disciplines
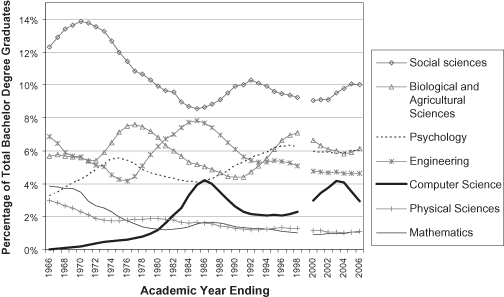
Computer science has undergone many ups and downs over the past 40 years. Undergraduate degrees in CS grew from almost nothing to 4% of all bachelor degree graduates in the United States in only 20 years (1966 to 1986), which is more than twice the graduates in all the physical sciences put together in 1986. Since then, CS bachelor degree graduates have fluctuated between 4% and 2%. Are these fluctuations meaningful? In other words, are they unusual (and therefore possible factors in the drop in female CS representation), or are they typical of other fields? To help answer these questions, Figure 2.7 shows the proportion of bachelor degrees awarded in computer science and other STEM fields, out of all bachelor degrees awarded in the United States. Most of the comparison lines in Figure 2.7 are aggregates of several fields; aggregates are shown as lines augmented with symbols—squares, triangles, and so on—while individual disciplines are shown as unadorned solid or dotted lines (e.g., computer science, psychology, and mathematics).
Figure 2.7. Fluctuations in bachelor degrees earned across many fields.
These data suggest the following.
1. The rapid growth in CS bachelor degrees awarded before 1986 is unusual, reflecting the “start-up” status and subsequent success of computer science as a professional field. All other disciplines shown in Figure 2.7 were established prior to 1960. This is not to say that there were not plenty of other disciplines establishing themselves during the last 40 years (e.g., robotics); however, they did not reach the size or receive the national attention that computer science did. Computer science appears unique among STEM fields during this time period in that it was a start-up that became sufficiently sizable and economically important to receive broad public attention.
2. The fluctuations occurring in computer science after 1986 are typical of many established fields. Engineering experienced proportionately similar swings, rising from 4% up to 8% of all U.S. bachelor degrees graduates in only 9 years (1976–1985) and down again to 5% by 2000; the social sciences have fluctuated between 14% and 8% (1970–1985); and mathematics has experienced a long decline over 40 years, falling from 4% in 1966 down to only 1% in 2006.
Development of a Public Identity
The first point is important because one outcome of professionalization (the process of declaring oneself to be a discipline and formalization of training) is the emergence and solidification of internal and external (public) identities for the discipline. Internal identities reflect how people within a discipline see the discipline and themselves; public identities reflect how people outside a discipline view it and the people who work within it, and these two viewpoints are not always in alignment. Of particular concern in this discussion are the public identities that emerged for computer science as it grew, including public attitudes and the images and stereotypes of computer scientists, such as the geek and the hacker.
It is relevant to bring stereotypes into a discussion that is otherwise primarily about numbers, because before computer science became prevalent, few people had opinions about what computer scientists were like, if they even knew what it was. However, as the profession grew and its social and economic impact became apparent, the general public was exposed more and more frequently to images of computer scientists. Numbers provide indictors of growing public awareness of the discipline. We will return later to discussion of how stereotypes of computer scientists may have begun to turn women away in disproportionate numbers as those stereotypes began to take hold in the public consciousness, starting in the mid-1980s and continuing through the current day.
The second point is important because some have suggested that the drop in total computer science graduates after 1986 may have caused the drop in the representation of women in computer science. However, this does not seem likely since the fluctuations in computer science post-1986 are proportionately no bigger or smaller than those seen in other disciplines, yet the representation of women has been growing steadily in most other disciplines. The changing popularity of an established discipline appears to have little impact on the representation of women in that discipline.
LEADERSHIP: WOMEN AT HIGHER LEVELS
The previous sections have focused mainly on women at the bachelor degree level and on computing jobs held primarily by people with bachelor degrees. However, phenomena that occur at one “level” may or may not be common to all levels; ideally one would like to know if the dramatic drop in the representation of women among computer science undergraduates also occurred at other levels—faculty, administration, and management. This section will examine the percentage of women attaining doctoral degrees in CS and faculty positions.
Increasing Rank, Shrinking Representation
Across almost all disciplines, the representation of women shrinks as the educational level and prestige of the position increases, as is illustrated in Figure 2.8.
Figure 2.8. Women students and faculty in various disciplines at American colleges and universities, 2002; sorted from highest to lowest percentage of women undergraduates.
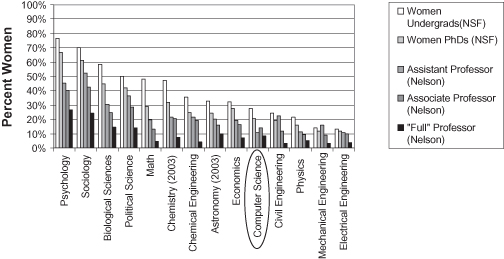
The disciplines in Figure 2.8 are sorted from the largest to smallest percentage of women undergraduate degrees. With few exceptions, all disciplines follow a very similar pattern in which the percentage of women shrinks (and the percentage of men grows) as rank increases. This is true even in disciplines dominated by women at the undergraduate and doctoral level, such as psychology, where men still comprise the majority of faculty in all ranks. Other studies indicate that this phenomenon is not isolated to faculty positions: it is also true for management positions.
This suggests that general societal impedances cutting across all disciplines have made it difficult for women to attain high status positions [3]. This has resulted in a “layering” effect, seen in Figure 2.8, in which the lower levels of any discipline are relatively “richer” in women, while the upper levels exist in an atmosphere rarified of women. Many have suggested that there are fewer women at the higher levels primarily because there were fewer women in the “pipeline” at the time at which these people entered the profession. While this is true to an extent, in most disciplines the percentage of women faculty is significantly smaller than the historical pipeline of women with doctoral degrees. This is true for computer science, and it is also true for disciplines such as psychology that have been female dominated at the graduate level for many years. Interestingly, the primary exceptions are many of the engineering disciplines that have very few women either historically or currently. It is not clear why this is so.
Women and Computer Science Doctoral Degrees
The percentage of women earning computer science doctoral degrees has risen continually from 1966 through 2006 at an average rate of about 0.5% a year as shown in Figure 2.9; women with CS doctoral degrees have continued to increase even while the proportion of women with CS bachelor degrees has been shrinking over the past 20 years. But does this mean that women’s representation in computer science Ph.D. programs has been unaffected? Figure 2.9 puts this question into a larger context by showing the National Science Foundation data on the proportion of women receiving doctoral degrees in a variety of disciplines. Computer science is shown as the solid dark line near the bottom of the graph, with only engineering and mathematics below it. As in Figure 2.2, individual disciplines are shown as simple lines, and aggregates of several disciplines are shown as lines marked with symbols (circles, triangles, etc.)
Figure 2.9. Percentage of women with doctoral degrees in computer science relative to other fields, United States 1966–2006 [9].
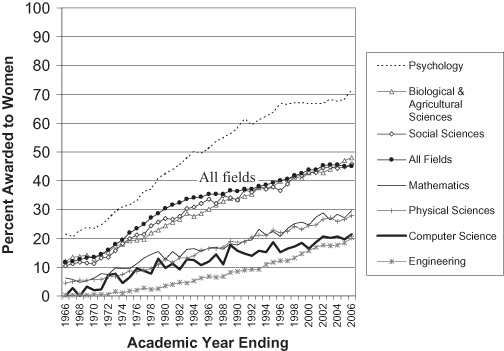
The percentage of women earning doctoral degrees has increased greatly in all fields since 1966, growing from 12% in 1966 to 45% in 2006. This is an enormous increase of 33%, with the most rapid growth occurring in the 1970s and early 1980s during the women’s movement. In contrast, the percentage of women earning bachelor degrees has grown more slowly, increasing by a relatively modest 14% over the last 40 years (from 44% in 1966 to 58% in 2006). Computer science, the physical sciences, mathematics, and engineering grew more slowly than average, while psychology grew much faster, increasing its percentage of women with doctoral degrees by an amazing 50% over 40 years.
What is notable about doctoral degrees in computer science is that in the 1970s through the early 1980s, the percentage of women with doctoral degrees in CS closely followed that of the physical sciences and mathematics. But after the mid-1980s it started to move toward engineering, converging in 2005 at the same levels of approximately 20% women.
This could be interpreted several ways. It could mean that the factors causing the decline in women CS undergrads may also have slowed growth in the percentage of women earning CS doctorates. It may also reflect a cultural shift in computer science, from alignment with one set of disciplines, such as mathematics and the physical sciences, toward engineering influences. At the undergraduate level in computer science, the percentage of women has also recently converged with that of engineering at approximately 20% (as shown in Figure 2.2).
While having similar percentages of women does not necessarily imply any relationship between computer science and another discipline, it is worth examining how the relationships between computer science, mathematics, and engineering programs have changed over time as computer science has become professionalized and educational programs have been established. In particular, educational programs in new areas (such as computer science) often exist in some related department long before that area is identified formally as a “discipline” with its own department. Anecdotal reports indicate that many undergraduate computer science programs started out life under the wing of mathematics and other departments, housed in either liberal arts or physical sciences colleges, but later moved into computer science departments, which are often housed in engineering colleges. This is relevant because organizational shifts that occurred in the processes of becoming an established discipline may have had a strong cultural impact on computer science, causing it to shift from a discipline influenced by the cultures of mathematics and, to some extent, the physical sciences or liberal arts, to one that is more strongly aligned with engineering. Furthermore, of all the engineering disciplines, computer science is possibly most strongly aligned with electrical engineering.
A quick examination of the five top-ranked U.S. computer science departments [27] reveals that at least two of these undergraduate programs started out as programs within mathematics departments, which were housed in a college of liberal arts and a college of physical sciences, respectively. (It is not clear in what departments the other three programs began.) Currently, three of these five programs reside in departments of computer science and two in departments of electrical engineering and computer science. Four of these departments are housed in engineering colleges, and one, at Carnegie Mellon University, is housed in a separate school of computer science. If these top five departments are representative of the evolution of computer science departments more broadly, it lends weight to the hypothesis that shifts in the disciplinary “homes” of computer science programs may have contributed to shifts in the disciplinary culture and the percentage of women.
Women as Computer Science Faculty
While both male and female faculty can be role models and inspirations to all students, the presence of women faculty in a discipline where they are underrepresented may be particularly important to prospective women students. Figure 2.10 shows the data from the National Center for Women and Information Technology (NCWIT) on the percentages of women faculty at American colleges and universities holding assistant, associate, and full professor positions over the decade from 1995 to 2005 [10].
Figure 2.10. Percentage of women computer science faculty in American colleges and universities, 1995–2005.
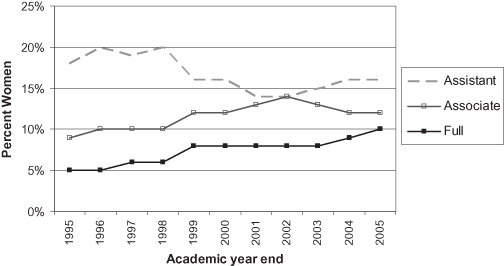
As a baseline for comparison, in 2002 women comprised 39% of all full-time faculty across all ranks and fields in the United States but only 11% of the computer science faculty [11,15]. Furthermore, women comprised 24% of all full professors across all fields, but only 8% in computer science [15]. When compared to other STEM fields, computer science falls somewhere in the middle, in terms of the proportion of women faculty: National Science Foundation data show it below psychology, social, and life sciences, but above mathematics, the physical sciences, and engineering fields [28].
It is worth noting that the proportion of assistant professors has recently dropped from 20% in 1998 to 16% in 2005. This is relevant because assistant professors are drawn from the CS Ph.D. pool, where the proportion of women has continued to rise. This may imply that fewer women Ph.D. graduates are seeking or attaining new faculty positions in computer science than in past years.
On the positive side, the proportion of women attaining the rank of associate and full professor in computer science has slowly but steadily risen over the course of a decade from 5% in 1995 to 10% in 2005. Thus, at first glance, it would not appear that a shrinking proportion of female faculty role models is responsible for the shrinking proportion of female undergraduates.
SUMMARY
A substantial and persistent drop has occurred over the last 20 years in the representation of women among computer science undergraduates and computing professionals at a time when the proportion of women has been steadily rising in all other STEM fields. This trend is all the more worrying because it comes at a time when overall interest in computing for both men and women is down, yet a strong and creative information technology workforce is needed for competition in the global economy. If computer science continues to become increasingly skewed, its appeal for all students choosing careers may sink even further. However, it is not clear how the situation in computer science arose, nor how to turn it around.
In order to gain insights into these phenomena, this chapter has examined national trends in the representation of women in STEM disciplines over a 40-year time period, and at multiple levels of achievement, in order to identify differences between the patterns followed in computer science and in other disciplines. These differences can provide clues as to possible causes and influences, and directions for further investigations.
Computer science is different from other STEM disciplines in the following ways.
1. It is the only STEM discipline in the United States to have experienced such a long and dramatic drop in the representation of undergraduate women over the past 40 years—falling 17% over 22 years between 1984 and 2006. There has also been a similar drop in the percentage of women in the computing workforce. However, at this time the author does not have the comparative workforce data to know if this drop is unique to the computing workforce, or whether the proportion of women in the workforce typically closely follows the proportion graduating several years prior. This would be important to know in order to assess to what degree it may be possible to change the demographics of the computing workforce by changing the demographics of the new CS graduates.
2. It is the only newly established STEM discipline in the last 40 years to grow so rapidly or achieve such prominence, increasing from just above 0% in 1966 to slightly over 4% of all undergraduate degrees granted in the United States only 20 years later. During this time, computer science oriented degree programs were being established, often initially in “host” departments like mathematics and other disciplines, and moving into separate departments established in colleges and universities across the country.
3. The proportion of women in computer science appears to be heading toward levels very close to those in engineering, as of 2006. This is true at both the undergraduate and graduate levels.
4. Large rates of change are possible. During the late 1970s, the percentage of women graduating with computer science bachelor degrees increased by 4% in a single year.
5. The percentage of women at some level in computer science has continued to grow, even while in other segments their proportion has been shrinking.
The current shrinking representation of women has primarily impacted undergraduate education and the computing workforce including programmers, systems analysts, and data processing and equipment repair. However, the proportions of women at higher levels—doctorates and faculty, have continued to grow overall. This analysis has not yet looked at trends in managerial positions in the workforce, but it is also an important segment to examine. The upper levels of computing, such as people with doctorates, faculty, and computing managers, may be particularly important in implementing change. While they represent only a small fraction of all people in computing, people in these roles can have a great deal of influence.
SOME POSSIBLE EXPLANATIONS
Two hypotheses that may explain factors contributing to the shrinking percentage of women in computer science are the following:
- As the discipline of computer science became established and known to the general public during the 1970s and 1980s, unappealing stereotypes of computer scientists as nerds and hackers also became established in the general consciousness. These stereotypes were probably unappealing to both men and women, but disproportionally so to women.
- As computer science professionalized, computer science programs were established in a range of departments, such as mathematics, physics, or electrical engineering and housed in a variety of colleges ranging from liberal arts to physical sciences and engineering. Gradually these programs became independent computer science departments, which are now often located predominantly in engineering colleges. Thus, computer science likely started out with a wide variety of disciplinary cultural influences, and it has gradually moved closer to a culture reminiscent of engineering, with similar proportions of women.
One or both of these hypotheses may be true. Both are consistent with the numerical trends presented in this chapter, but both will require further investigation before it is possible to assess their likelihood. The next section outlines some possible future directions that may help to clarify the current downward trend in computer science, and how to rectify it in order to create a healthier climate for all.
FUTURE RESEARCH QUESTIONS
1. When did images or stereotypes of computer scientists become prevalent in the public consciousness, and through what vehicles? Few news articles about “computer nerds” appear before the mid-1980s, but many appear after that date; likewise for movies featuring computer nerds. However, the public can hold multiple images, both positive and negative, simultaneously; for example, the “computer geek” and the “computer start-up entrepreneur/billionaire.”
2. How do images and stereotypes impact the career choices of both men and women? The stereotype that women “don’t like math” does not appear to have greatly deterred them from becoming math majors, as almost 50% of undergraduate mathematics bachelor degrees are awarded to women. Similarly, to what degree do “computer geek” stereotypes actually impact students’ choices when selecting a major?
3. Where did computer science programs find their first homes: in what departments and colleges? And where are the bulk of these programs now? These questions require some fairly deep digging at individual institutions to find the answers; many computer science departments’ histories state when the department was founded, and when graduate and undergraduate programs were established within their own units. However, even if earlier versions of these computer science programs were housed initially in other departments, the institutional memory of these predecessors may be seriously faded.
4. Are there models of the professionalization of disciplines to help explain the phenomena in computer science? Many other disciplines were established as fields of study in the last 100 to 150 years, including psychology and many of the engineering fields. Are there general patterns of growth and change that mirror some of those seen more recently in computer science that can help us to better understand its changes?
5. Can changing the demographics of computer science undergraduates alter the demographics of the computing workforce? More study of the relationships between the demographics of the two is needed across all STEM fields. The ultimate goal is to alter the workforce by changing education.
6. How important are female role models? It is strongly believed that it is important to have female role models, but to what degree do they matter? Are some role models more important than others? Mathematics departments have large numbers of women undergraduates despite the fact that most have very few women faculty. This raises the question, how critical are female faculty for attracting and retaining female students? Alternatively, are role models experienced in childhood, such as mothers, fathers, or favorite aunts, more important? Do media images provide early role models (or anti-role models) for children and young adults that impact their future career choices?
7. How important are female leaders? Leaders may also be role models, but additionally leaders are in positions to make systemic changes. In general, there are very few women leaders in STEM disciplines who have the roles of upper level managers, CEOs, department heads, deans, and so on. A lack of female leaders may mean that gender inequities are less likely to be seen as priorities, or changes implemented. Furthermore, it may turn ambitious women away from a discipline if they desire leadership opportunities.
STRATEGIES FOR CHANGE
Successful strategies for change are not well understood at this time. However, if indeed public perceptions and images of computer science are part of the problem, public perceptions can be changed through advertising, media, and examples. Furthermore, while existing stereotypes, such as the computer geek, may be remarkably hard to erase, multiple images and possibly contradictory stereotypes can coexist. For example, the computer geek stereotype coexisted with the hip 20-something entrepreneur during the dot.com bubble of the 1990s. These images were likely joint influences on students’ choices of discipline during the 1990s and may explain both the upsurge of (mostly male) computer science bachelor degree graduates in the 1990s and the following downswing shortly after the bubble burst (see Figure 2.5).
If a variety of male images, both positive and negative, can be created for computer scientists, presumably positive female images can be created as well. In recent discussions with a group of women computer science undergraduate and Ph.D. students, they described plans to create their own web-distributed drama/movie featuring a female computer scientist hero. They felt the need to do it themselves because Hollywood didn’t seem likely to do it any time soon.
Some strategies for improving gender balance do not focus on accounting for gender differences, but on encouraging diversity of background and ideas. Margolis and Fisher and later Blum and Frieze performed some very interesting studies of men and women in the Computer Science Department at Carnegie Mellon University, which may provide important insights [5,8]. Margolis and Fisher performed their study in the mid-1990s when the Carnegie Mellon Computer Science Department had a very gender-imbalanced environment. They interviewed approximately 100 students and found many differences between the male and female students in background, prior computer experience, computer programming skills, and feelings of satisfaction and inclusion in their program of study.
In the late 1990s the department made some changes to its admission standards with the goal of attracting more women. They kept high standards for GREs and grades, but added an emphasis on leadership qualities and dropped requirements for prior programming experience. Additionally, they added a few “catch-up” courses to the curriculum to level out background differences. None of these changes were inherently gender specific, but after implementing them the department increased the percentage of women students from somewhat less than 10% to more than 30%, and greatly changed the culture.
Another Blum–Frieze finding, discovered by interviewing students during and after these changes, was that as the environment became more gender balanced, many of the apparent differences observed earlier by Margolis and Fisher began to fade. The background of both male and female students became more diverse, and the level of satisfaction of both had increased. Since the time of that study, the proportion of female undergraduates has sagged again, but Frieze reports that the department has managed to keep the more diverse culture among the undergraduates [29]. If measures can be taken to improve the gender balance and culture of undergraduate computer science at Carnegie Mellon University, it may be possible to transfer these approaches to other undergraduate organizations so as to change its appeal not only for women but for men too.
CLOSING THOUGHTS
While the field of computer science has changed greatly over the past 40 years, women are still greatly underrepresented. Paradoxically, computer science changed more rapidly than most STEM disciplines during the late 1970s and early 1980s in the number of women represented; then, in a complete turnaround, it has been regressing since the mid-1980s while most other disciplines continued to increase their representation of women. The challenge ahead is to understand why representation has been falling and to identify approaches that may remedy the situation. Further change will likely require a sustained effort, simultaneously addressing multiple factors at multiple levels, from the ideas and examples taught to our children to the very highest levels of leadership.
It is likely that attaining and maintaining gender equity in computer science (or any discipline) will not be like maintaining the position of a rock once placed in a field. An analogy to a school of fish in a stream may be more appropriate. Keeping those fish in the center of the stream may be difficult. The school’s position will always be shifting somewhat from side to side, and smaller groups may break off and go their own way. There may be a constant current against which the fish must always swim; as well as dangerous eddies in the backwaters in which the fish may get caught. However, change is necessary if we are to have a diverse, fully productive, and creative computing workforce. Furthermore, if the Blum–Frieze study is any indicator, continued change will likely improve the climate and appeal of computer science for all.
ACKNOWLEDGMENTS
I would like to extend heartfelt thanks to Peter Meyer for donating his time to extract workforce data from Bureau of Labor Statistics databases.
REFERENCES
1. Association of American Medical Colleges, AAMC Data Book: Medical Schools and Teaching Hospitals by the Numbers 2008 (Washington, DC: Association of American Medical Colleges, May 2008), Table B-9. Web version: “U.S. Medical School Applicants and Students 1982–83 to 2007–08”; available at www.aamc.org/data/facts/charts1982to2007.pdf.
2. National Science Foundation, Division of Science Resources Statistics, Science and Engineering Degrees: 1966–2006; detailed statistical tables NSF 08-321 (Arlington, VA: National Science Foundation, 2008); available at www.nsf.gov/statistics/nsf08321/.
3. Virginia Valian, Why So Slow? The Advancement of Women (Cambridge: MIT Press, 1998).
4. Mary Ann Mason and Eve Mason Ekman, Mothers on the Fast Track: How a New Generation Can Balance Family and Careers (New York: Oxford University Press, 2007).
5. Jane Margolis and Allan Fisher, Unlocking the Clubhouse: Women in Computing (Cambridge: MIT Press, 2002).
6. Readers can test themselves by taking the Implicit Association Test (IAT) online at implicit.harvard.edu/implicit/. Mahzarin R. Banaji and Anthony G. Greenwald, “Implicit Gender Stereotyping in Judgments of Fame,” Journal of Personality and Social Psychology, Vol. 68, No. 2 (1995): 181–198.
7. Henry Etzkowitz, Carol Kemelgor, and Brian Uzzi, Athena Unbound: The Advancement of Women in Science and Technology (Cambridge, UK: Cambridge University Press, 2000). Pat Griffin, “Introductory Module for the Single Issue Courses,” in Maurianne Adams, Lee Anne Bell, and Pat Griffin, eds., Teaching for Diversity and Social Justice: A Sourcebook (New York: Routledge, 1997), pp. 61–109.
8. Lenore Blum and Carol Frieze, “The Evolving Culture of Computing: Similarity Is the Difference,” Frontiers: A Journal of Women Studies, Vol. 26, No. 1 (2005): 110–125.
9. National Science Foundation, Science and Engineering Degrees: 1966–2006.
10. National Center for Women and Information Technology, NCWIT Scorecard 2007: A Report on the Status of Women in Information Technology (University of Colorado, Boulder, 2007); available at ncwit.org/pdf/2007_Scorecard_Web.pdf (accessed March 2007).
11. Donna J. Nelson, “A National Analysis of Diversity in Science and Engineering Faculties at Research Universities,” 15 January 2004; available at cheminfo.chem.ou.edu/∼djn/diversity/briefings/Diversity%20Report%20Final.pdf.
12. Donna J. Nelson, “A National Analysis of Minorities in Science and Engineering Faculties at Research Universities,” October 31, 2007; available at cheminfo.ou.edu/∼djn/diversity/Faculty_Tables_FY07/FinalReport07.html.
13. Bureau of Labor Statistics Database, accessed May 2008, courtesy of Peter Meyer.
14. Mary C. Murphy, Claude M. Steele, and James J. Gross, “Signaling Threat,” Psychological Science, Vol. 3, No. 10 (2007): 879–885.
15. Martha S. West and John W. Curtis, “AAUP Faculty Gender Equity Indicators 2006,” American Society of University Professors, Washington, DC, 2006.
16. However, there have been two female associate deans of the Institute of Technology at the University of Minnesota, which is the college of science and engineering, founded in 1935.
17. Andrea M. Atkin, Ruth Green, and Laura McLaughlin, “Patching the Leaky Pipeline,” Journal of College Science Teaching, Vol. 32, No. 2 (2002): 102–108.
18. Jay Vegso, “Female CS/CE Students and Faculty,” Computing Research Association Bulletin (18 June, 2008); available at www.cra.org/wp/index.php?p=147.
19. Stuart Zweben, “2006–2007 Taulbee Survey: Ph.D. Production Exceeds 1,700, Undergraduate Enrollment Trends Still Unclear,” Computing Research News, Computing Research Association, May 2008.
20. Randall Stross, “What Has Driven Women Out of Computer Science?” New York Times (15 November 2008), Business section; available at www.nytimes.com/2008/11/16/business/ 16digi.html. Higher Education Research Institute at UCLA databases, available at www.gseis.ucla.edu/heri/gainaccess.php.
21. These 21 individual STEM disciplines (as defined by the National Science Foundation) are: Agricultural, Biological, Atmospheric, Earth, Ocean, and Computer Sciences; Mathematics, Astronomy, Chemistry, Physics, Psychology, Economics, Political Science, and Sociology; Aeronautical, Chemical, Civil, Chemical, Industrial, Materials and Metallurgy, and Mechanical Engineering.
22. Having at least 4 years of higher education was reported by 60% of the people who held software developer positions between 1971 and 2006, 63% of the systems analysts, and 13% of the data processing and equipment repair workers.
23. John R. Rice and Saul Rosen, “The History of the Computer Sciences Department at Purdue University,” in Richard DeMillo and John Rice, eds. Studies in Computer Science: In Honor of Samuel D. Conte (New York: Plenum Press, 1994), pp. 45–72.
24. Roger Lowenstein, Origins of the Crash (New York: Penguin Books, 2004).
25. Jay Vegso, “Freshman Interest in CS and Degree Production Trends,” Computing Research Association Bulletin (1 October 2007); available at www.cra.org/wp/index.php?cat=33.
26. Relative size of the electrical engineering workforce was estimated by the BLS job category “electrical engineer”; Bureau of Labor Statistics database, accessed May 2008, courtesy of Peter Meyer.
27. The top five computer science departments as ranked by U.S. News and World Report for 2008 are in order: Stanford, MIT, Berkeley, Carnegie Mellon, University of Illinois Champaign-Urbana.
28. Joan Burrelli, Thirty-Three Years of Women in S&E Faculty Positions, June 2008, NSF 08-308; available at www.nsf.gov/statistics/infbrief/nsf08308/.
29. Carol Frieze, phone conversation, March 2008.