
Chapter 5: Reversing Malware Using Ghidra
In this chapter, we will introduce reverse engineering malware using Ghidra. By using Ghidra, you will be able to analyze executable binary files containing malicious code.
This chapter is a great opportunity to put into practice the knowledge acquired during Chapter 1, Getting Started with Ghidra, and Chapter 2, Automating RE Tasks with Ghidra Scripts, about Ghidra's features and capabilities. To put this knowledge into practice, we will analyze the Alina Point of Sale (PoS) malware. This malware basically scrapes the RAM memory of PoS systems to steal credit card and debit card information.
Our approach will start by setting up a safe analysis environment, then we will look for malware indicators in the malware sample, and, finally, we will conclude by performing in-depth malware analysis using Ghidra.
In this chapter, we're going to cover the following main topics:
- Setting up the environment
- Looking for malware indicators
- Dissecting interesting malware sample parts
Technical requirements
The requirements for this chapter are as follows:
- VirtualBox, an x86 and AMD64/Intel64 virtualization software: https://www.virtualbox.org/wiki/Downloads
- VirusTotal, an online malware analysis tool that aggregates many antivirus engines and online engines for scanning: https://www.virustotal.com/
The GitHub repository containing all the necessary code for this chapter can be found at https://github.com/PacktPublishing/Ghidra-Software-Reverse-Engineering-for-Beginners/tree/master/Chapter05.
Check out the following link to see the Code in Action video: https://bit.ly/3ou4OgP
Setting up the environment
At the time of writing this book, the public version of Ghidra has no debugging support for binaries. This limits the scope of Ghidra to static analysis, meaning files are analyzed without being executed.
But, of course, Ghidra static analysis can complement the dynamic analysis performed by any existing debugger of your choice (such as x64dbg, WinDbg, and OllyDbg). Both types of analysis can be performed in parallel.
Setting up an environment for malware analysis is a broad topic, so we will cover the basics of using Ghidra for this purpose. Keep in mind that the golden rule when setting up a malware analysis environment is to isolate it from your computer and network. Even if you are performing static analysis, it is recommended to set up an isolated environment because you have no guarantee that the malware won't exploit some Ghidra vulnerability and get executed anyway.
The CVE-2019-17664 and CVE-2019-17665 Ghidra vulnerabilities
I found two vulnerabilities on Ghidra that could lead to the unexpected execution of malware when it is named: cmd.exe or jansi.dll. At the time of writing this book, CVE-2019-17664 is not fixed yet: https://github.com/NationalSecurityAgency/ghidra/issues/107.
In order to analyze malware, you can use a physical computer (restorable to a clean state via hard disk drive backups) or a virtual one. The first option is more realistic but slower when restoring the backup and more expensive.
You also have to isolate your network. A good example to illustrate the risk is ransomware encrypting the shared folders during analysis.
Let's use a VirtualBox virtualized environment, with read-only (for safety reasons) shared folders in order to transfer files from the host machine to the guest and no internet connection as it is not necessary for static analysis.
Then, we follow these steps:
- Install VirtualBox by downloading it from the following link: https://www.virtualbox.org/wiki/Downloads
- Create a new VirtualBox virtual machine or download it from Microsoft: https://aka.ms/windev_VM_virtualbox
- Set up a VirtualBox read-only shared folder, allowing you to transfer files from the host machine to the guest: https://www.virtualbox.org/manual/ch04.html#sharedfolders.
- Transfer Ghidra and its required dependencies to the guest machine, install it, and also transfer the malware you are interested in analyzing.
Additionally, you can transfer your own arsenal of Ghidra scripts and extensions.
Looking for malware indicators
As you probably remember from previous chapters, Ghidra works with projects containing zero or more files. Alina malware consists of two components: a Windows driver (rt.sys) and a Portable Executable (park.exe). Therefore, a compressed Ghidra project (alina_ghidra_project.zip) containing both components can be found in the relevant GitHub project created for this book.
If you want to get the Alina malware sample as is instead of a Ghidra project, you can also find it in the GitHub project (alina_malware_sample.zip), compressed and protected with the password infected. It is quite common to share malware in this way so that it does not accidentally get infected.
Next, we will try to quickly guess what kind of malware we are dealing with in general terms. To do that, we will look for strings, which can be revealing in many cases. We will also check external sources, which can be useful if the malware has been analyzed or classified. Finally, we will analyze its capabilities by looking for Dynamic Linking Library (DLL) functions.
Looking for strings
Let's start by opening the Ghidra project and double-clicking on the park.exe file from the Ghidra project in order to analyze it using CodeBrowser. Obviously, do not click on park.exe outside of the Ghidra project as it is malware and your system can get infected. A good starting point is to list the strings of the file. We'll go to Search | For Strings… and start to analyze it:

Figure 5.1 – Some interesting strings found in park.exe
As shown in the preceding screenshot, the user Benson seems to have compiled this malware. This information could be useful to investigate the attribution of this malware. There are a lot of suspicious strings here.
For instance, it is hard to imagine the reason behind a legitimate program making reference to windefender.exe. Also, SHELLCODE_MUTEX and System Service Dispatch Table (SSDT) hooking references are both explicitly malicious.
System Service Dispatch Table
SSDT is an array of addresses to kernel routines for 32-bit Windows operating systems or an array of relative offsets to the same routines for 64-bit Windows operating systems.
A quick overview of the strings of the program can sometimes reveal whether it is malware or not without further analysis. Simple and powerful.
Intelligence information and external sources
It is also useful to investigate the information found using external sources such as intelligence tools. For instance, as shown in the following screenshot, we identified two domains when looking for strings, which can be investigated using VirusTotal:

Figure 5.2 – Two domains found in strings
To analyze a URL in VirusTotal, go to the following link, write the domain, and click on the magnifying glass icon to proceed: https://www.virustotal.com/gui/home/url:
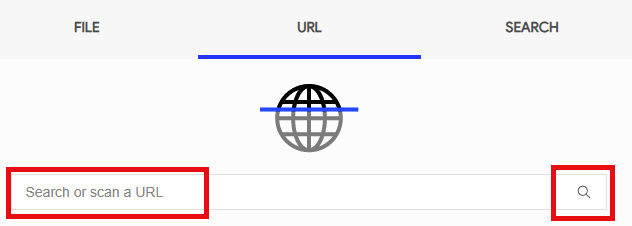
Figure 5.3 – Searching for the URL to be analyzed
Search results are dynamic and might change from time to time. In this case, both domains produce positive results in VirusTotal. The results can be viewed at https://www.virustotal.com/gui/url/422f1425108ae35666d2 f86f46f9cf565141cf6601c6924534cb7d9a536645bc/detection:

Figure 5.4 – Two domains found in strings
Apart from that, VirusTotal can provide more useful information that you can find by browsing through the page. For instance, it detected that the javaoracle2.ru domain was also referenced by other suspicious files:
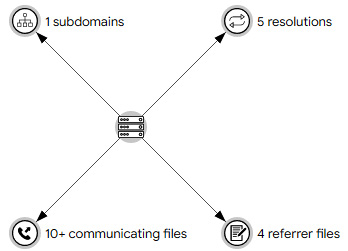
Figure 5.5 – Malware threats referencing javaoracle2.ru
When analyzing malware, it is recommended to review public resources before starting the analysis because it can bring you a lot of useful information for the starting point.
How to look for malware indicators
When looking for malware indicators, don't just try to look for strings used for malicious purposes, but also look for anomalies. Malware is usually easily recognized for multiple reasons: some strings will never be found in goodware files and the code could be artificially complex.
It is also interesting to check the imports of the file in order to investigate its capabilities.
Checking import functions
As the binary references some malicious servers, it must implement some kind of network communication. In this case, this communication is performed via an HTTP protocol, as shown in the following import functions located in Ghidra's CodeBrowser Symbol Tree window:

Figure 5.6 – HTTP communication-related imports
Looking at ADVAPI32.DLL, we can identify functions named Reg* that allow us to work with the Windows Registry, while others that mention the word Service or SCManager allow us to interact with the Windows Service Control Manager, which enables us to load drivers:
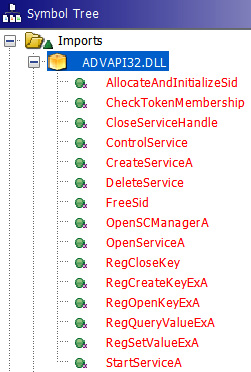
Figure 5.7 – Windows Registry- and Service Control Manager-related imports
There are really a lot of imports from KERNEL32.DLL, so, as well as many other things, it allows us to interact with and perform actions related to named pipes, files, and processes:

Figure 5.8 – HTTP communication
Runtime imports
Remember that libraries imported at runtime and/or functions resolved at runtime will not be listed in Symbol Tree, so be aware that the capabilities of the program may not have been fully identified.
We have identified a lot of things with a very quick analysis. If you are experienced, you will know malware code patterns, leading to mentally matching API functions with strings and easily inferring what the malware will try to do when given the previously shown information.
Dissecting interesting malware sample parts
As mentioned before, this malware consists of two components: a Portable Executable file (park.exe) and a Windows driver file (rk.sys).
When more than one malicious file is found on a computer, it is quite common that one of them generates the other(s). As park.exe can be executed by double-clicking on it, while rk.sys must be loaded by another component such as the Windows Service Control Manager or another driver, we can initially assume that park.exe was executed and then it dropped rk.sys to the disk. In fact, during our static analysis of the imports, we notice that park.exe has APIs to deal with the Windows Service Control Manager. As shown in the following screenshot, this file starts with the following pattern: 4d 5a 90 00. The starting bytes are also used as the signature of files; these signatures are also known as magic numbers or magic bytes. In this case, the signature indicates that this file is a Portable Executable (the file format for executables, object code, DLLs, and others used in 32-bit and 64-bit versions of Windows operating systems):

Figure 5.9 – rk.sys file overview
By calculating the difference between the start address and the end address, we obtained the size of the file, which is 0x51ff, which will be used later for extracting the rk.sys file embedded in park.exe. It is a great idea to use the Python interpreter for this simple calculation:
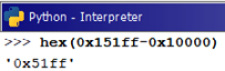
Figure 5.10 – rk.sys file size
Then, we open park.exe and look for the file by clicking on Search | Memory… and searching for the 4D 5A 90 00 pattern. Click on Search All to see all occurrences:

Figure 5.11 – Looking for PE headers
You will see two occurrences of this header pattern. The first one corresponds to the header of the file we are analyzing, which is park.exe, while the second one corresponds to the embedded rk.sys:

Figure 5.12 – PE headers found in park.exe
As we know now that it starts at the 0x004f6850 address and, as calculated before using the Python interpreter, is 0x51FF bytes in size, we can select those bytes by clicking on Select | Bytes..., entering the length in bytes to select, starting from the current address and, finally, clicking on Select Bytes:

Figure 5.13 – Selecting the rk.sys file inside park.exe
By right-clicking on the selected bytes and choosing Extract and Import…, which is also available with the Ctrl + Alt + I hotkey, we get the following screen, where a data file is added to the project containing the selected bytes:
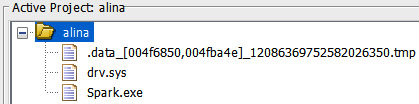
Figure 5.14 – The data chunk is added to the project as a *.tmp file
We identified all the malware components. Now, let's analyze the malware from the entry point of the program.
The entry point function
Let's analyze park.exe. We start by opening it with CodeBrowser and going to the entry point. You can look for the entry function in Symbol Tree to do that:
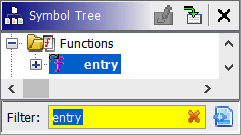
Figure 5.15 – Entry point function
The decompilation of this function looks readable. __security__init_cookie is a memory corruption protection function introduced by the compiler, so go ahead with __tmainCRTStartup by double-clicking on it. There are a lot of functions recognized by Ghidra here, so let's focus on the only function not recognized yet – thunk_FUN_00455f60:

Figure 5.16 – The WinMain function unrecognized
This is the main function of the program. If you have some C++ background, you will also notice that __wincmdln initializes some global variables, the environment, and the heap for the process, and then the WinMain function is called. So, the thunk_FUN_00455f60 function, following __wincmdln, is the WinMain function. Let's rename thunk_FUN_00455f60 to WinMain by pressing the L key while focusing on thunk_FUN_00455f60:

Figure 5.17 – Renaming the thunk_FUN_00455f60 function to WinMain
Ghidra allows you to rename variables and functions, introduce comments, and modify the disassembly and decompiled code in a lot of aspects. This is essential when reverse engineering malware:

Figure 5.18 – The WinMain function with some irrelevant code (lines 5–19) omitted
We took those steps to identify where the malware starts to analyze its flow from the beginning, but there are some functions in the decompiled code listing that we don't know anything about. So, our job here is to reveal their functionality in order to understand the malware.
Keep in mind that malware analysis is a time-consuming task, so don't waste your time with the details, but also don't forget anything important. Next, we will analyze each of the functions listed in the WinMain decompiled code. We will start analyzing the first function, which is located on line 20 and is named thunk_FUN_00453340.
Analyzing the 0x00453340 function
We will start by analyzing the first function, thunk_FUN_00453340:
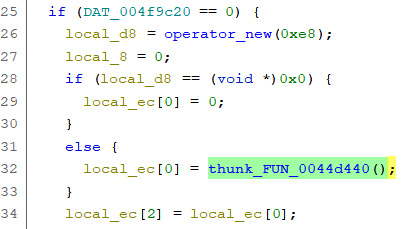
Figure 5.19 – Partial code of the FUN_00453340 function
It is creating a class using operator_new and then calling its constructor: thunk_FUN_0044d440.
In this function, you will see some Windows API calls. Then, you can rename (by pressing the L key) the local variables, making the code more readable:
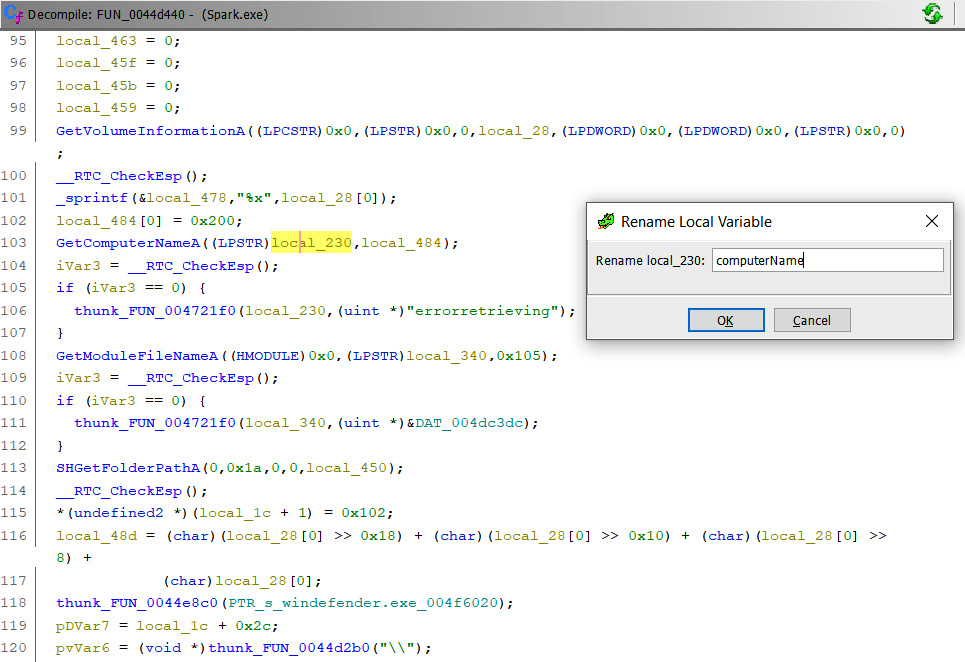
Figure 5.20 – Renaming a function parameter computerName
You can do this according to the Microsoft documentation (https://docs.microsoft.com/en-us/windows/win32/api/winbase/nf-winbase-getcomputernamea):

Figure 5.21 – Looking for API information in the Microsoft docs
In fact, it is also possible to fully modify a function by clicking on Edit Function Signature:
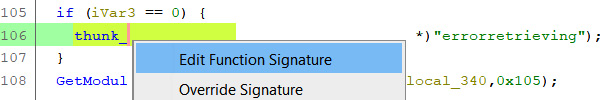
Figure 5.22 – Editing a function signature
In this case, this function is strcpy, which copies the errorretriving string to the end of the computerName string (which has a NULL value when this line is reached). Then, we can modify the signature according to its name and parameters.
We can also modify the calling convention for the function. This is important because some important details depend on the calling convention:
- How parameters are passed to the function (by register or pushed onto the stack)
- Designates the callee function or the calling function with the responsibility of cleaning the stack
Refer to the following screenshot to see how thunk_FUN_004721f0 is renamed to strcpy:
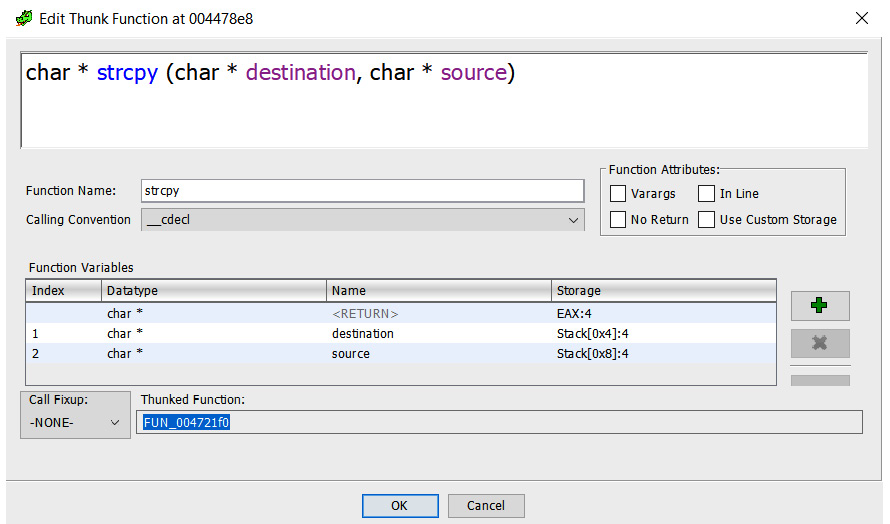
Figure 5.23 – Function signature editor
We can also set the following pre-comment on line 105 – 0x1a = CSIDL_APPDATA:

Figure 5.24 – Setting a pre-comment
This indicates that the second parameter of SHGetFolderPathA means the %APPDATA% directory:
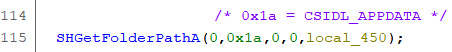
Figure 5.25 – Pre-comment in the decompiled code
After some analysis, you will notice that this function makes an RC4-encrypted copy of the malware as windefender.exe in %APPDATA% tkrnl.
Analyzing the 0x00453C10 function
Sometimes, the decompiled code is not correct and is incomplete; so, also check the disassembly listing. In this case, we are dealing with a list of strings representing files to delete but in the decompiled code, it is not shown:

Figure 5.26 – Showing a list of strings
This function is cleaning previous infections by deleting these files. As you can see, the malware tries to be a little stealthy using names of legitimate programs. Let's rename this function cleanPreviousInfections and continue with other functions.
Analyzing the 0x0046EA60 function
This function creates a named \\.\pipe\spark pipe, which is an Inter-Process Communication (IPC) mechanism:

Figure 5.27 – Creating a named pipe
Inter-process communication
IPC is a mechanism that allows processes to communicate with each other and synchronize their actions. The communication between these processes can be seen as a method of co-operation between them.
Since a named pipe is created, we can expect to see some kind of communication between malware components using it.
Analyzing the 0x0046BEB0 function
This function sets up the command and control URL:

Figure 5.28 – Command and control domains and endpoints
Analyzing the 0x0046E3A0 function
By analyzing this function, we notice that the pipe is used for some kind of synchronization. The CreateThread API function receives as parameters the function to execute as a thread and an argument to pass to the function; so, when a thread creation appears, we have to analyze a new function – in this case, lpStartAddress_00449049:

Figure 5.29 – Persisting the malware every 30 seconds
Interesting. An infinite loop iterates every 30000 milliseconds (30 seconds), performing persistence. Let's analyze the thunk_FUN_00454ba0 function:
Figure 5.30 – Persistence via the Run registry key
It is opening the Run registry key, which is executed when the Microsoft Windows user session starts. This is commonly used by malware to persist the infection because it will be executed every time the computer starts. Let's rename the function persistence.
Analyzing the 0x004559B0 function
This function deals with services via Service Control Manager APIs such as OpenSCManagerA or OpenServiceA:
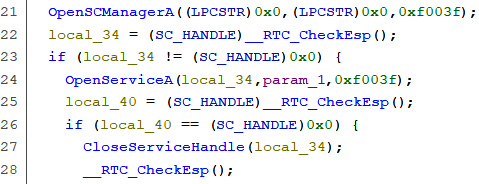
Figure 5.31 – Using the Service Control Manager to open a service
After some renaming, we notice that it checks whether users have the administrative privileges that are necessary to create services. If they do, it deletes previous rootkit instances (a rootkit is an application that allows us to hide system elements: processes, files, and so on… but in this case, malware elements), writes the rootkit to disk, and finally, creates a service with the rootkit again. As you can see, the service is called Windows Host Process and the rootkit is installed in %APPDATA% (or C: if not available) and named rk.sys:

Figure 5.32 – Installing the rootkit but deleting the previous one if it exists
So, let's rename this function installRookit.
Analyzing the 0x004554E0 function
It is trying to open the explorer.exe process, which is supposed to be the shell of the user:

Figure 5.33 – Opening explorer.exe
As you can see, it creates a mutex, which is a synchronization mechanism, and prevents opening the explorer.exe process twice. The mutex name is very characteristic and is hardcoded. We can use it as an Indicator of Compromise (IOC) because it is useful for administrators to quickly determine whether a machine was compromised: 7YhngylKo09H.
When analyzing malware, there are code patterns and API sequences that are like an open book:

Figure 5.34 – Injecting code into the explorer.exe process
In this case, you can see the following:
- VirtualAllocEx: To allocate 0x3000 bytes of memory to the explorer.exe process with the 0x40 flag meaning PAGE_EXECUTE_READWRITE (allowing you to write and execute code here)
- WriteProcessMemory: Writes the malicious code into explorer.exe
- CreateRemoteThread: Creates a new thread in the explorer.exe process in order to execute the code.
We can rename thunk_FUN_004555b0 to injectShellcodeIntoExplorer.
We now understand its parameters:
- The explorer process handler in order to inject code into it
- The pointer to the code to inject (also known as shellcode)
- The size of the code to inject, which is 0x616 bytes
Shellcode
The term "shellcode" was historically used to describe code executed by a target program due to a vulnerability exploit and used to open a remote shell – that is, an instance of a command-line interpreter – so that an attacker could use that shell to further interact with the victim's system.
By double-clicking on the shellcode parameter, we can see the bytes of the shellcode, but by pressing the D key, we can also convert it into code:

Figure 5.35 – Converting the shellcode into code in order to analyze it with Ghidra
By clicking on some string of shellcode, you can see the strings used stored in the same order as used by the program, so you can deduce what the program is doing by reading its strings:

Figure 5.36 – Quickly analyzing code by reading its strings
We have an encrypted copy of the malware in %APPDATA% tkrnl as we know from a previous analysis. It is decrypted using the password 7YhngylKo09H. Then, a windefender.exe-decrypted malware is created and finally executed via ShellExecuteA. This is performed in an infinite loop controlled by a mutex mechanism, as indicated in the final string, SHELLCODE_MUTEX.
Mutex
A mutex object is a synchronization object whose state can be non-signaled or signaled, depending, respectively, on whether it is owned by a thread or not.
So, we can rename thunk_FUN_004554e0 to explorerPersistence.
Analyzing the 0x0046C860 function
After initializing the class using operator_new, calls are made to its thunk_FUN_0046c2c0 constructor. As you can see, we have a thread to analyze here:

Figure 5.37 – Thread creation
The lpStartAddress_00447172 function consists of an infinite loop, which calls to our analyzed setupC&C function, so we can expect some Command and Control (C&C) communication. C&C is the server controlling and receiving information from the malware sample. It is administered by the attacker:
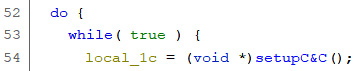
Figure 5.38 – C&C communication loop
Let's click on one of the function strings and see what happens. We can also make it a beautifier. Click on the Create Array… option to join null bytes by selecting these bytes and right-clicking on it:

Figure 5.39 – Converting data into types and structures
It seems to be strings of HTTP parameters for C&C communication as it is quite common to use this protocol. The most relevant string is cardinterval. What does card interval mean?

Figure 5.40 – C&C communication HTTP parameters
Let's rename this function C&Ccommunication and move on with the next function.
Analyzing the 0x0046A100 function
Again, we have a thunk_FUN_00464870 constructor calling an lpStartAddress_04476db thread function. Let's focus our attention on the thread function:

Figure 5.41 – A mathematical function
This function is a little bit complex. We can see a lot of math operations, and due to this, a lot of numeric data types. Don't waste your time! Instead, rename it to mathAlgorithm and come back to it later if needed.
The next function iterates over processes and uses the __stricmp function to skip processes of the blacklist, which contains Windows processes and common applications. We can assume it is looking for a non-common application:

Figure 5.42 – Blacklisted processes
By analyzing the lpStartAddress0047299 thread function located in FUN_0045c570, we notice that it scraps the process memory looking for something:
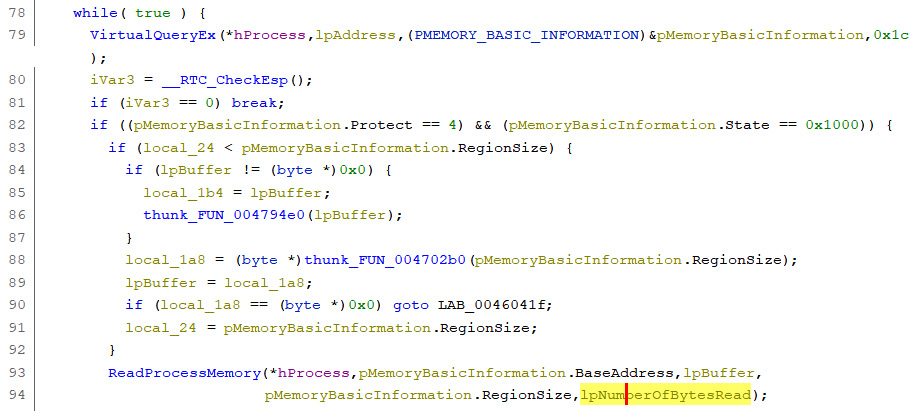
Figure 5.43 – Reading the process memory
It first obtains the memory region permissions via VirtualQueryEx and checks whether it is in the MEM_IMAGE state, which indicates that the memory pages within the region are mapped into the view of an image section. It also protects PAGE_READWRITE.
Then, it calls to ReadProcessMemory to read the memory, and finally, it looks for credit card numbers in FUN_004607c0:
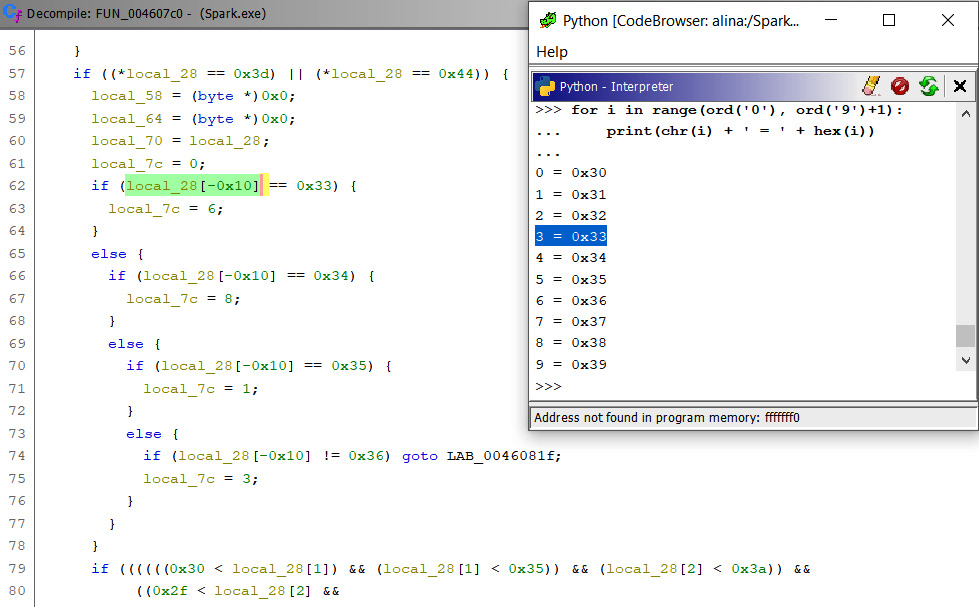
Figure 5.44 – Memory-scrapping the process
As you can see, the local_28 variable is 0x10 bytes (0x10 means the 16 digits of a credit card number) in size and the first byte of it is being compared with the number 3, as shown in the table I printed using the Python interpreter. This malware implements the Luhn algorithm for credit card number checksum validation during its scraping:

Figure 5.45 – Renamed functions in WinMain
Luhn makes it possible to check numbers (credit card numbers, in this case) via a control key (called checksum, which is a number of the number, which makes it possible to check the others). If a character is misread or badly written, then Luhn's algorithm will detect this error.
Luhn is well-known because Mastercard, American Express (AmEx), Visa, and all other credit cards use it.
Summary
In this chapter, you learned how to analyze malware using Ghidra. We analyzed Alina POS malware, which is rich in features, namely pipes, threads, the ring0 rootkit, shellcode injection, and memory-scrapping.
You have also learned how bad guys earn money every day with cybercriminal activities. In other words, you learned about carding skills.
In the next chapter of this book, we will cover scripting malware analysis to work faster and better when improving our analysis of Alina POS malware.
Questions
- What kind of information provides the imports of a Portable Executable file during malware analysis? What can be done by combining both the LoadLibrary and GetProcAddress API functions?
- Can the disassembly be improved in some way when dealing with a C++ program, as in this case?
- What are the benefits of malware when injecting code into another process compared to executing it in the current process?
Further reading
You can refer to the following links for more information on the topics covered in this chapter:
- During the analysis performed in this chapter, we didn't need to use all of Ghidra's features. Check out the following Ghidra cheat sheet for further details: https://ghidra-sre.org/CheatSheet.html
- Learning Malware Analysis, Monnappa K A, June 2018: https://www.packtpub.com/eu/networking-and-servers/learning-malware-analysis
- Alina, the latest POS malware – PandaLabs analysis: https://www.pandasecurity.com/en/mediacenter/pandalabs/alina-pos-malware/
- Fundamentals of Malware Analysis, Munir Njenga, March 2018 [Video]: https://www.packtpub.com/networking-and-servers/fundamentals-malware-analysis-video
- Hybrid analysis – analyze and detect known threats: https://www.hybrid-analysis.com/?lang=es