23
Improving Website Performance
Depending on the study cited, from 40 to 80 percent of users will abandon a website if it takes more than four seconds to load. According to one study, Amazon loses $1.6 billion per year for every second of load time (medium.com/@vikigreen).
While your losses won’t be quite that great (at least when you’re starting out), you should always look to improve the performance of your website because a slow website will cost you users. Aside from that, better performance will improve your site’s user experience (UX), increase user engagement with your content, and even help boost your site’s page rank in Google.
What Do We Mean by Performance?
Before getting too far into the weeds, you need to know what web professionals mean by performance. Getting to the heart of it, performance is measured by two criteria:
Load time: How long it takes for a website to be delivered to the user from the time they request it.
Interface efficiency: How long it takes for something to happen once a user interreacts with your website—clicking a link, filling out a form, and so on.
The goals in making your site perform as well as possible in terms of page load speed and how quickly it reacts to user interactions (referred to as being more performant) are a fast load time (under three seconds for any network speed) and to provide the user with feedback as soon as they do something on your website. This can be as simple as hover states on links.
Now that you know what performance means and why your website should be performant, let’s take a look at the how.
Know How Your Website Performs
Before you start optimizing for performance, you need to know how well your website performs in the first place. Often this has to do with the amount of data you’re sending from the server to the user’s browser. The more data, the slower a website loads.
Common performance factors
You’ll learn about some tools to help you pinpoint specific performance issues, but there are a few common culprits:
Images: Huge image files represent a lot of data that needs to be transmitted. And often, they don’t need to be as big as they are.
Other media: You might consider images first because they are more in your control. With other media, like audio and video files, you’re probably uploading them to a service like SoundCloud or YouTube, and those services work hard on improving performance. Even so, embedding too many videos or pieces of audio on a page can still slow down your website.
Bloated HTML and CSS: Using too much markup or too many styles can lead to bigger HTML and CSS files, which leads to slower load times. Later in this chapter I’ll talk about ways to diagnose those problems and find solutions to them. On top of that, as you include more files (like JavaScript libraries), downloading each one requires a separate request to the server. More requests also lead to longer load times.
Hosting: It’s easy to blame hosting for performance issues, but the truth is a bad host will result in a slower site. If you’re using a hosting company that overworks its servers or underinvests in resources for those servers, you can have a single line of text in a file load slowly. While you’re learning, it’s okay to skimp in this area because it’s the biggest cost to you, but once you’re ready to do this professionally, a good host is a must.
Performance Testing Tools
While media, bloated code, and hosting are all areas you can keep an eye on when developing your website, it’s worth using third-party tools to help you pinpoint performance issues on your website.
There are several web-based tests that will load your website and then give you a list of areas to fix. Popular ones include PageSpeed Insights from Google (FIGURE 23.1), GTmetrix (FIGURE 23.2), and Pingdom (FIGURE 23.3).

Figure 23.1 Google’s PageSpeed Insights for Casabona.org (developers.google.com/speed/pagespeed/insights/)

Figure 23.2 GTmetrix ratings for Casabona.org (gtmetrix.com/)
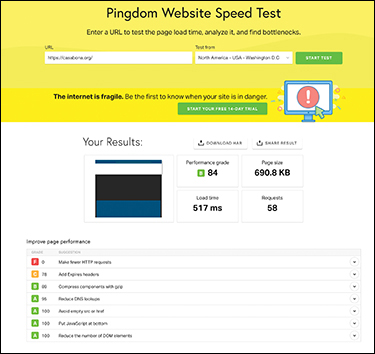
Figure 23.3 Pingdom’s rating for Casabona.org (tools.pingdom.com/)
They each use slightly different methods for measuring performance, but they’ll all help by pointing out what you can improve.
To use PageSpeed Insights:
In your browser, visit developers.google.com/speed/pagespeed/insights/.
In the text box labeled Enter A Web Page URL, type your website’s address (FIGURE 23.4).

Figure 23.4 PageSpeed Insights URL box
Click the Analyze button.
Once the tool completes analysis, you’re given two scores: one for mobile and one for desktop.
Click Desktop, on the left toward the top of the page (FIGURE 23.5).

Figure 23.5 The Mobile and Desktop buttons that reveal, and let you switch between, the scores on PageSpeed Insights
PageSpeed Insights gives you data based on how well your website has performed for other people. It then gives you detailed descriptions of each metric.
Click the three-line icon next to Lab Data to view those descriptions (
 ).
).Under both Opportunities and Diagnostics, you see scores and recommendations. Click the down arrow (
 ) to view the recommended fixes you can make.
The Chrome DevTools Network tab
Chrome DevTools, which you learned about in Chapter 22, has more than just tools for reviewing HTML, CSS, and responsive design.
You learned how to test in Chrome on low-speed internet connections, but the Network tab will give you a more detailed breakdown of your website’s performance (FIGURE 23.6).
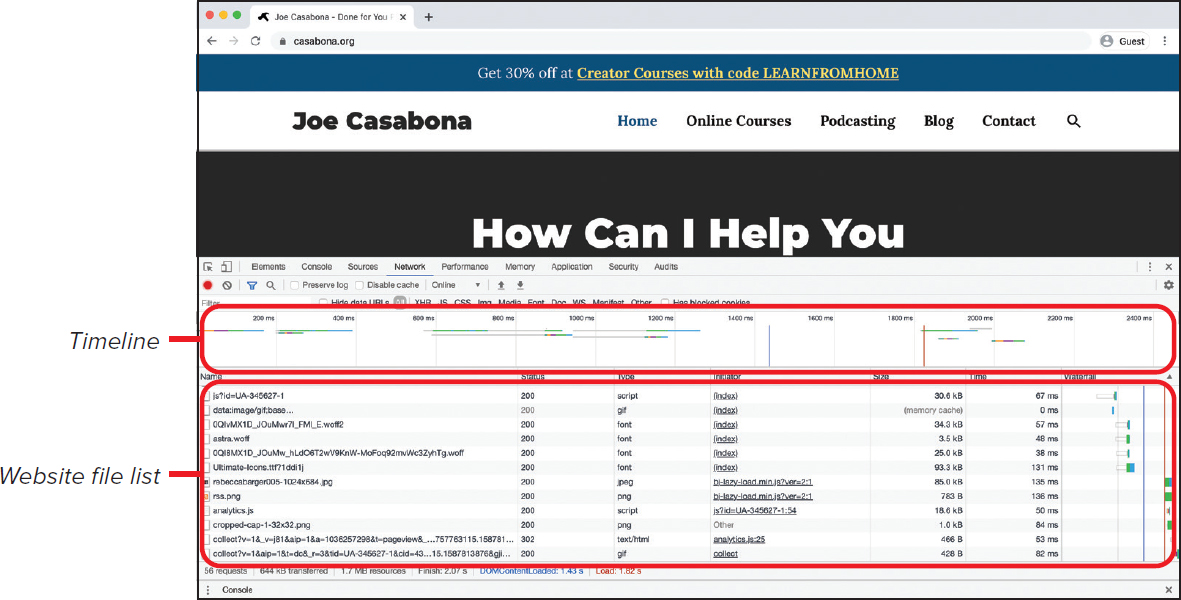
Figure 23.6 The Network tab in Chrome DevTools with results loaded from Casabona.org
To view results in the Network tab in Chrome DevTools:
Visit your website in Chrome.
Open Chrome DevTools by clicking the menu button and choosing More Tools > Developer Tools.
Click the Network tab.
On macOS, press Command-R to reload the page and see the network activity results. On Windows, press Ctrl-R.
Your website reloads, and the Network tab is populated with data organized into two sections: a timeline and a list of all the files (HTML, CSS, images, etc.) that your website loads, with load times.
Using the information from the Network tab, you can look at slow-loading files and determine how you can optimize your site.
Speaking of which, let’s look at a few techniques for optimizing your website, starting with some low-hanging fruit: making your HTML and CSS files smaller.
Minify HTML and CSS Files
Minifying HTML and CSS files is the act of removing unnecessary characters in order to make the files as small as possible.
When you write HTML, every character counts towards the total file size, even spaces and line breaks—the computer still needs to represent them as data. Generally, one character = one byte (though some characters use more). So “Hello World” has a size of 11 bytes. Since you generally see sizes in kilobytes (KB), megabytes (MB), or gigabytes (GB), TABLE 23.1 shows how many bytes are in each unit of measurement. You may see people use a simple power of 10 conversion (1000 bytes in a KB; 1,000,000 bytes in a MB, etc). However, when converting values to computer storage, you should use the exact values provided in the table.
Table 23.1 Byte Conversion Chart
Unit |
Size in Bytes |
|---|---|
Kilobyte (KB) |
1024 |
Megabyte (MB) |
1,048,576 |
Gigabyte (GB) |
1,073,741,824 |
In both HTML and CSS, spaces and line breaks are unnecessary; they are only there because it’s easier for us to read the files with proper spacing included. The same goes for comments. While they give cues to developers as to what’s going on in the code, they do not affect how the browser renders a site, so they aren’t needed. Removing spaces, line breaks, and comments can lead to considerable space savings (FIGURE 23.7).

Figure 23.7 On the left you see the CSS from Casabona.org, which is nearly 6400 lines of code and 129KB in size. On the right, you see the minified version, one (very long) line and 97KB. That’s 40 percent smaller!
There are lots of online tools for minifying both HTML and CSS. Some give you options for degrees of minification (just remove line breaks, remove all spaces, etc.). Make sure that whatever minification is done, it doesn’t end up breaking your code. I’ve gotten consistent (and good) results from Minify Code (FIGURE 23.8).

Figure 23.8 Minifycode.com allows you to minify HTML, CSS, and JavaScript.
To minify HTML using Minify Code:
Visit minifycode.com.
Click the HTML Minifier button.
If your browser window is a smaller size, you may see a blue icon in the top right. Click it to reveal the navigation menu.
Open the
index.htmlfile for your website in a text editor.Copy all the text from your
index.htmlfile.Paste the text into the textbox on the Minify Code page.
Click the Minify HTML button.
Your HTML is replaced with the minified version.
Copy that code.
Create a new folder called minified.
In that folder, create a new file called
index.html.Paste the minified HTML into the new index file and save the file.
Upload the new, minified version of
index.htmlto your web server.
Your mileage will vary depending on how much markup you have in your file. The bigger savings are often seen with minifying CSS. That process looks exactly the same as the previous task, but you’ll use the CSS minifier on minifycode.com instead of the HTML minifier.
Optimize Your Images
Another quick win for improving performance is optimizing your images. There are three ways you can do this.
First, when you can, use SVG for simple graphics, since they are inherently smaller than pixel-based images like JPEGs.
Second, if you are using pixel-based images, make sure your images are the appropriate size for the space they’re in. For example, if you have an image sized to 500x250, you shouldn’t be shrinking a 2000x1000 image by 75 percent; use a 500x250 image sized at 100 percent. You can do this easily in HTML using the techniques you learned in Chapter 7.
Another image format that has gained popularity is WebP. Developed by Google, the format makes images about 26 percent smaller than their PNG counterparts. It uses the .webp extension, and it’s supported by all major browsers except Safari at the time of this writing. You can learn more about how to use WebP at css-tricks.com/using-webp-images/.
Finally, you can compress your images. Compression is a way of shrinking a file size at the code level without altering what the file represents. In fact, minifying is a form of compression. We get a much smaller file size, but your website still looks the same. Another example is shorthand in text messaging or chat. Instead of “laugh out loud,” most people write “LOL.” It’s much shorter but means the same thing.
Why compress images?
Images often contain extra information that bloats the file size, like metadata about the image. This can be where the photo was taken, what camera was used, date and time, and more.
None of this matters to people visiting your website, especially when it’s loading slowly. So you can use compression and optimizing tools to remove that metadata and reduce image file sizes without losing quality (FIGURE 23.9).

Figure 23.9 On the left is the original image, and the compressed version is on the right. Notice that there’s no difference in quality.
There are several free image-optimizing tools for macOS and Windows, as well as web-based services. For macOS, I recommend ImageOptim (imageoptim.com/). It’s been around for a long time, it works well, and it can integrate with other services through its API (for a price).
For Windows, RIOT (riot-optimizer.com/) is a free tool that works well.
ImageOptim also has a web interface with limited functionality (FIGURE 23.10).

Figure 23.10 The interface for imageoptim.com/online has several options for optimizing your images.
To use ImageOptim to compress an image:
Go to imageoptim.com/online.
Keep all the settings at their default values for now.
You can always experiment with these settings!
Click Choose Files and select one of the images from your website folder.
This website supports selecting multiple images if you want to process more than one at a time.
Once you’ve selected your image, click Submit.
After ImageOptim finishes compressing the image, you’ll be prompted to download the new version. Save it to the minified folder you created in a separate task.
Upload the image to your website, replacing the old one.
Again, your mileage will vary depending on the image you use. But for the image used in Figure 23.9, the original was 4.3MB and the reduced version was 3.9MB.
Between using something like ImageOptim and sizing your images properly, your website should load a lot faster. But there’s something else you can do that will make a huge difference, which I cover in the next section.
Load Your Critical CSS First
Another term you’ll probably see, especially if you review your PageSpeed Insights results, is the term render-blocking resources. These are any files that need to be downloaded before the page can be displayed at all. The fewer render-blocking resources, the faster your page is perceived to load.
Imagine you’re going on a trip but you didn’t pre-pack a bag. Each time you get into your car, you realize you forgot something, so you run back inside to get it. It takes you much longer to get on the road. Each forgotten item is like a render-blocking resource. If you had packed a bag earlier, you would have been able to leave faster.
This is also known as time to first paint. The first paint is the very first render of your website. When users see a blank screen, they know the website is taking time to load. Your goal is to eliminate this blank screen as soon as possible, even if it’s not the full site (FIGURE 23.11).
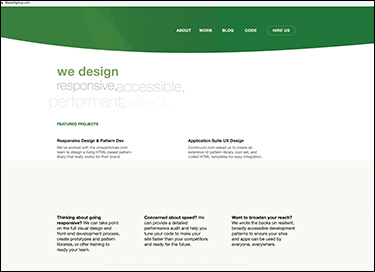
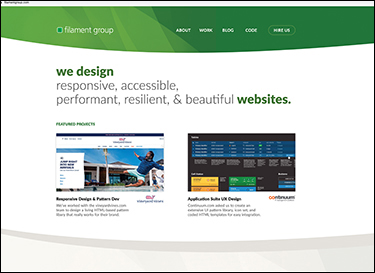
Figure 23.11 Filament Group’s site employs several performance boosters, including critical CSS. You can see its first paint, where you can start reading the content, versus the last paint, which includes all the images, bells, and whistles.
Part of the reason I left this until last in the chapter is that it’s more complicated than the other techniques we’ve covered. It’s not just shrinking a file or some other basic task.
The lazy loading technique from Chapter 10 is one way to remove certain render-blocking resources and get your website loaded faster. However, everything you include in the <head> element of your website is also, by default, render-blocking.
For the purposes of this book, render-blocking resources means your CSS file. If it’s absolutely massive, it will take your website longer to load. So you can employ the following technique:
Move the most important CSS—that is, the CSS required to style the first part of the website—to an internal style sheet (see Chapter 11). Load the rest of the CSS later in the document, like right before the </body> tag.
Determine your critical CSS
If you’re not using automated tools, your first job is to determine which CSS is critical and which is not. Many times, the determining factor is the fold (FIGURE 23.12). This is any content that shows up in the user’s browser before they scroll.

Figure 23.12 The fold is what loads in the browser without scrolling. Critical CSS should style for above the fold.
When working with many different devices, determining the fold is impossible, but for the purposes of this book, let’s work with your desktop browser window. Take a look at your website and see what renders in the browser before you do any scrolling. This is the stuff that you should target for your critical CSS.
You can also use a tool like the Critical Path CSS Generator by Sitelocity (FIGURE 23.13).

Figure 23.13 Sitelocity’s Critical Path CSS Generator will help you determine what your website’s critical CSS is (sitelocity.com/critical-path-css-generator).
CODE 23.1 shows a simple HTML example with a single comment denoting where I’ve determined the fold to be.
In this instance, you’ll want to include some body styles and the header and .primary-content styles in your critical CSS. Everything else can be put in the style.css file. For simplicity’s sake, CODE 23.2 includes the critical CSS.
To add critical CSS inline:
Open your HTML file (or create a new one using Code 23.1).
On the line after the opening
<head>tag, type<style>.Add your critical CSS. If you’re using the demo code, use Code 23.2 for this part.
On the next line, type
</style>.On a new line right before
</body>, add a reference to your CSS file by typing<link href="style.css" rel="stylesheet" type="text/css" />.Save your files and upload them to your server.
Visit the newly created HTML file. You should notice that some of the styles load initially, and then the rest of the styles finish loading once the browser gets to the
style.cssreference at the end of the document.
Wrapping Up
In this chapter you’ve learned some important principles and techniques for speeding up your website. A fast website is important because it keeps users from abandoning it, and we want as many people to use our site as possible.
In that same vein, another way to ensure anyone who wanted to view your website can is to make it accessible. Let’s take a look at how in Chapter 24.