
Let's take a look at how to run Gatling test suites by using the Gatling GUI. Start the Gatling GUI by double-clicking on the recorder.bat file on Windows or the recorder.sh file on Linux. Set up the configuration for the target simulation, as follows:
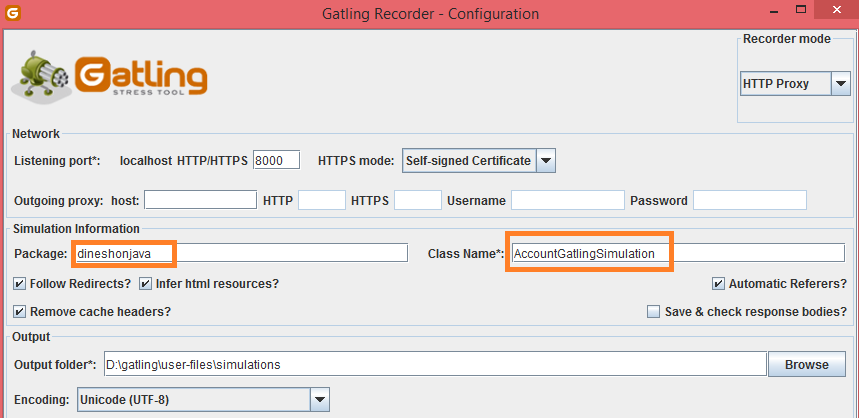
As you can see in the preceding screenshot, we have added the package name and the class name. Click on the Start button and run the Gatling tool by double-clicking the gatling.bat file on Windows or the gatling.sh file on Linux. After starting Gatling, it will look something like the following:

In the preceding screenshot, Gatling is asking us to select a simulation class for all of the available simulations. We have selected 6 for the dineshonjava.AccountGatlingSimulation class. You can also add a simulation ID and simulation description, but these are optional fields. Press the Enter button in the console; you will receive the following output:
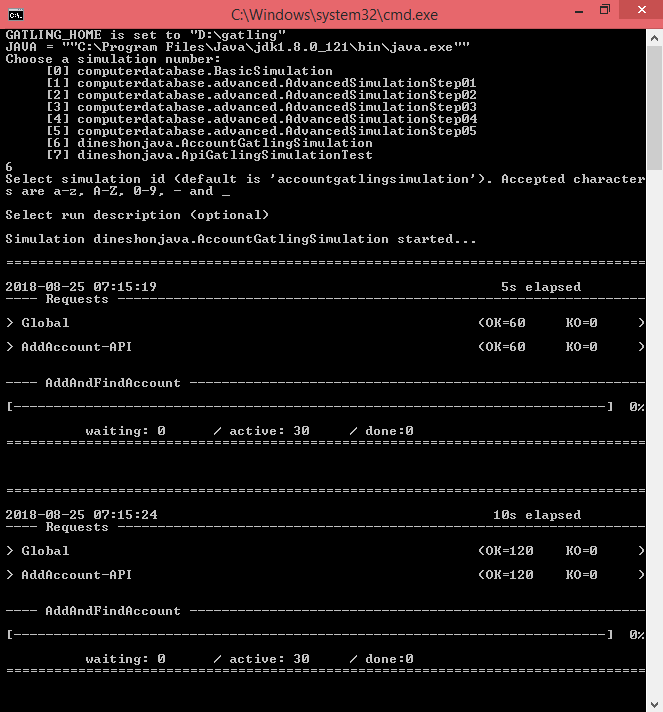
As you can see in the preceding screenshot, the test suites are running and printing logs in the console. They will start adding accounts into the database that contain all of the active users; these are the 30 clients we talked about previously.
After a while, the test will finish and print the following report to the console:
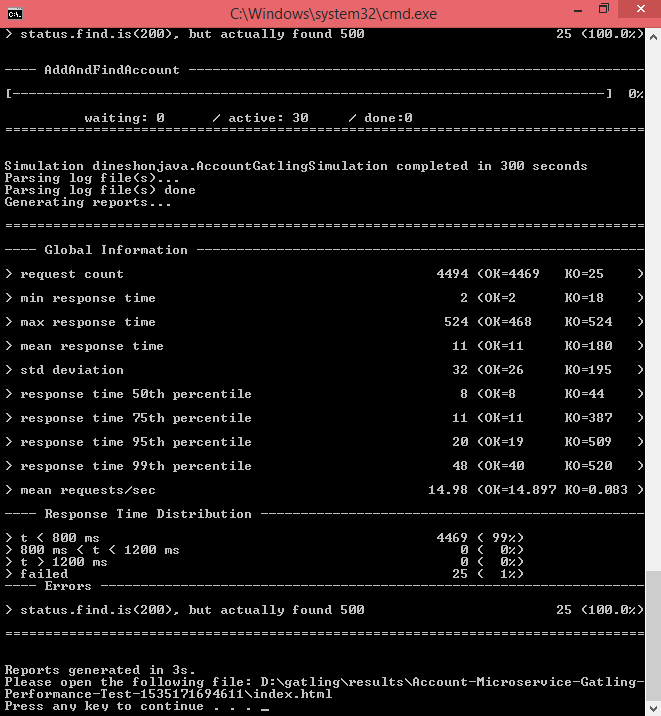
As you can see in the preceding screenshot, the load testing reports for the application are displayed in the console, which we will look at further in the following step.
After load testing has finished, Gatling will have generated the report in a particular location. In our case, the generated report will be saved to this location: D:gatling esultsAccount-Microservice-Gatling-Performance-Test-1535171694611. This is shown in the following screenshot:

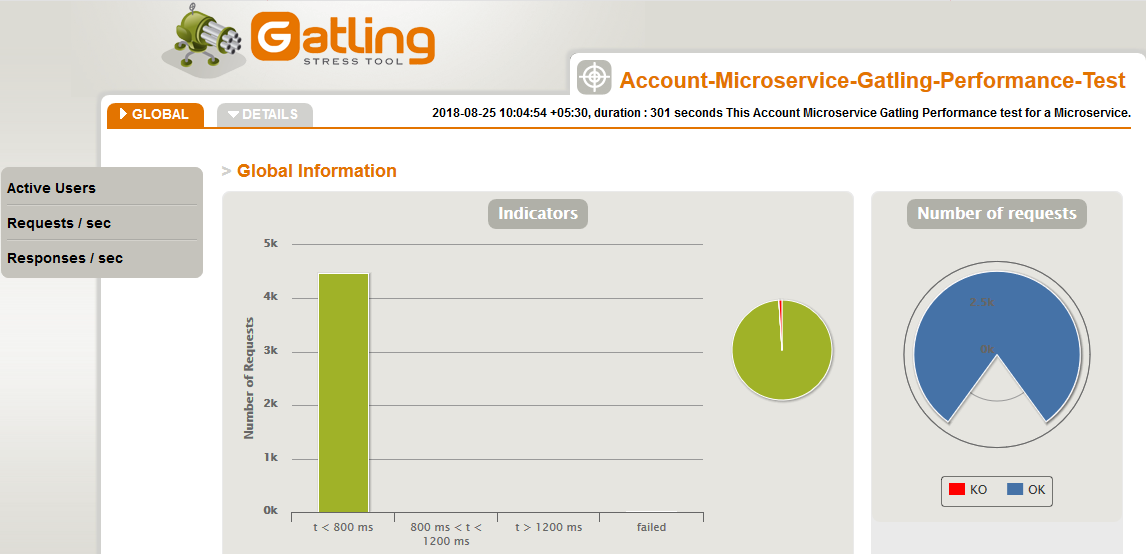
In the preceding screenshot, the index file of the generated report is index.html. If you open this file, you'll be able to view more details, as follows:
We can choose to look at a report for all requests or filter them to see only those that are generated by a selected API. In the following screenshot, we can see a report just for AddAccount-API:

Now, we'll take a look at the format of a few other reports. The following screenshot shows the percentage of requests grouped by their average response time:

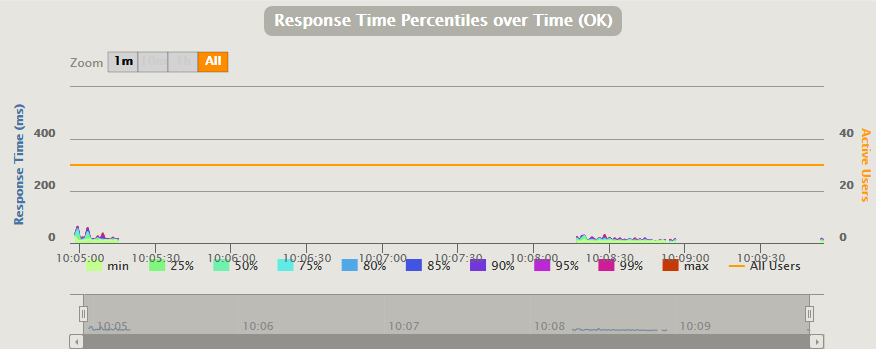
The following screenshot shows a graph that illustrates a timeline with the average response times. It also shows statistics by percentiles:
The following graph shows the number of requests that were processed successfully by the application in a second:

In this section, we have created a Gatling test suite and generated a performance testing report for a microservice. In the next section, we will discuss the Ready API.