CHAPTER 8
Leveraging Analytics in Quality Improvement Activities
Knowing is not enough, we must act.
—Johann Wolfgang von Goethe
Data and information alone are not sufficient to achieve transformation in healthcare. Information and insight need to operate within a framework or methodology for quality and performance improvement decision making. Such a framework is necessary to identify priorities for improvement and evaluating outcomes. This chapter will focus on how to leverage analytics within a quality improvement (QI) environment to assist the healthcare organization (HCO) in achieving its quality and performance goals.
Moving from Analytics Insight to Healthcare Improvement
When used in concert with QI methodologies such as PDSA, Lean, or Six Sigma, analytics helps to identify the most pressing quality issues facing the HCO based on needs defined by patient safety, the quality goals of the HCO, national standards, and legislative requirements. These improvement methodologies leverage the insights gained from analytics, within their respective structured approaches, to develop interventions and solutions for healthcare quality and performance issues and evaluate outcomes to ensure the long-term sustainability of improvements.
To gain maximum value from analytics, QI projects need to be able to:
- Retrieve and analyze baseline data to document current performance and/or quality measures against which to compare future performance;
- Utilize or develop well-defined performance indicators (PIs) that accurately reflect the processes, procedures, policies, or treatments being changed; and
- Perform ongoing evaluation and reporting of relevant PIs to quantify the impact of implemented changes and to identify if further revisions to processes or policies are required.
Chapter 4 outlines the necessity of clearly defining what quality means in the context of the HCO, and also provides an overview of several common QI methodologies, such as PDSA, Lean, and Six Sigma. Regardless of which methodology is chosen, analytics can be incorporated at many decision and analysis points throughout a QI project, and in most decision-making processes within the HCO. This chapter will focus on the key role that analytics plays throughout quality and performance improvement initiatives. Following are five phases of a QI project during which analytics can be leveraged to help move from analytics insight to healthcare innovation and improvement. The five phases are illustrated in Figure 8.1 and described in more detail here.
FIGURE 8.1 Five Quality Improvement Phases

Analytics is important in almost every phase of healthcare quality and performance improvement. Regardless of the QI framework chosen, the analytics needs of QI initiatives depend on:
- The phase of the initiative;
- Who is using analytics;
- What information and insight is required; and
- How that insight and information is being used.
Accurate information is necessary to understand the scope of the problem(s), identify the best possible solutions, evaluate those solutions once implemented, and monitor ongoing performance to help ensure that the improvements have been sustained.
The quality and performance problems that HCOs endeavor to address should, where possible, be in alignment with the quality and performance goals of the organization as stated in its quality and performance strategy. Those quality and performance goals serve as a kind of “true north” for keeping the organization on track as competing interests and requirements detract from strategic improvements. On occasion, problems will emerge that are not strictly aligned with the quality strategy but are nonetheless necessary to deal with. Because HCOs may have limited resources for undertaking multiple projects, the competing priorities need to be ranked in some way so that the highest-priority issues come first. Depending on the HCO’s needs, the importance of problems can be ranked in different ways; three common bases for ranking issues facing an HCO are:
When classifying problems into each group listed previously (or other types of issues not listed here), HCOs can calculate the cost (whether measured in financial, clinical outcomes, or other terms) of poor quality and performance and begin to estimate the potential value or benefit of addressing their root causes. Those with higher associated costs and/or greatest potential benefit or value are considered higher-priority than those with lower associated costs. Using this type of ranking rationale helps organizations to become more transparent and quantitative in their decision making so that a decision to address one or a few problems over others can be quantitatively supported.
Analytics in the Problem Definition Stage
Once a problem has been identified and selected as a priority for the organization to address, the first step is to start with a clear and detailed description of the quality or performance problem (or other issue) that must be improved. The important considerations of this step are:
- What are the goals/objectives to which this problem relates?
- What are the relevant indicators and metrics?
- What baseline data is available, and what data will be available moving forward for monitoring and evaluation?
One of the first steps is to quantify and measure the magnitude of the problem. The problem should relate to the strategic quality and performance improvement objectives of the organization and/or the tactical-level improvement goals of units, departments, and programs, and wherever possible be described and quantified in terms of the appropriate metrics and indicators. The results of this process help to filter all the possible metrics and indicators, based on possibly hundreds of available data points, down to the critical few indicators required for the success of a quality and performance improvement project.
The information-gathering and benchmarking phase typically sees QI team members obtaining data regarding the issue in question. Once metrics and indicators are decided upon, critical to any QI initiative is effective baseline performance information. Useful baseline information, however, is more than just the collection of historical data. Baseline performance is a quantitative description of some aspect of the HCO’s performance measured prior to the undertaking of an improvement initiative. (If no quantitative data is available, a qualitative description is sometimes helpful.) An accurate baseline is necessary for determining whether any actual change in performance has taken place, and what the magnitude of that change is.
Every QI project will require baseline data. In fact, baseline performance data is helpful in the everyday operations of the HCO. Baseline data can put current performance in perspective; for example, are the number of visits, lengths of stay, admission rates, or bed turnaround times today better or worse than typical? This has an important impact on dashboards and other similar tools, where baseline quality and performance information can add very valuable context to current real-time performance values.
In some cases, baseline data may not be available (for example, with the opening of a new unit or clinic, or with the adoption of a brand-new technology). In these cases, baseline data should be established as soon as possible into the improvement activity in order to gauge performance changes. The information gathered in this phase of the QI process is typically more static and historical in nature, may require some basic statistics to tease out actual performance values, and can be visualized in various types of statistical process control (SPC) charts to determine how “in control” a process is.
Knowing the true magnitude of a change requires both an accurate starting point and ending point. For example, almost any medical procedure performed on patients at a healthcare facility requires a complete baseline (including height, weight, lab results, and diagnostic imaging as necessary)—no healthcare provider would even consider performing a procedure without knowing as much about the patient as possible. Yet healthcare QI projects are undertaken too often without the benefit of clearly knowing current and/or historical performance, and this is why many of those projects fail.
Baseline data should be based on and measured in the exact same way as the indicators developed for the QI project. In order to ensure that baseline data is a true measure of existing performance, the following considerations should be made:
- Data source. Wherever possible, the source of baseline data should be the same as that used for ongoing measurement and evaluation; if the sources of data are different (for example, before and after the implementation of a new system), differences in the way data were recorded, processes were interpreted, and data was analyzed must be taken into account or there is a risk of performing an invalid comparison and perhaps reaching inaccurate conclusions.
- Data quality. If baseline data is drawn from legacy systems, or even collected from paper sources, data quality may be an issue. Ensure that the quality of baseline data is as high as possible prior to performing any analysis or comparisons.
- Time period. Baseline data must cover a long enough time to be an accurate reflection of performance, and must be recent enough to be a valid comparison. If baseline data is too old or does not cover a sufficient time period, processes, performance, and quality may have changed since the time encompassed by the baseline data.
- Indicators. Comparisons with baseline data work best if the baseline data is analyzed and reported using the same indicators that will be used moving forward for monitoring and evaluation.
Data used for the baseline should be reliable—it should be trusted as a true measure of performance, as future performance will be compared against this. If no data is available, it may be obtained manually (for example, via chart reviews), but this may have implications for what indicators are chosen for the actual improvement initiatives.
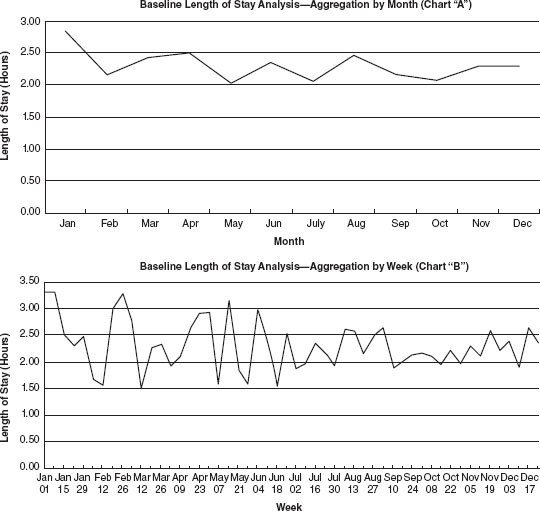
When reporting baseline data, one important consideration is how to aggregate the data. For example, when looking at a year’s worth of baseline data, the temptation might be to group the data by month. When grouping by month, however, it is possible that certain details are being lost that might be helpful to determine if a change is in fact occurring.
Consider Chart “A” in Figure 8.2, in which average clinic patient length-of-stay data is grouped by month over a 12-month period. During that time, the performance of the clinic appears to be relatively static. Chart “B” hints at a slightly different story—aggregating the data by week instead of month shows that midway through the baseline data, variation in the data seems to have decreased. A decrease in variation in performance is considered to be a step toward improvement. So even though on a monthly scale performance may appear to be static, when looked at through a weekly lens, it can be suggested that some improvement has already started to take place. The reverse is true as well; if baseline data shows increasing variability in a set of data, it is possible that capacity to perform at expected levels is deteriorating.
FIGURE 8.2 Baseline Data Showing a Change in Performance When Aggregated Differently
Using Analytics to Identify Improvement Opportunities
Once a problem has been identified and quantified, the next step is to identify improvement opportunities—that is, what steps an HCO can take to achieve the desired outcomes and levels of performance. To achieve these improvements requires specific actions and interventions on the part of QI teams. Of course, not all identified opportunities and resultant improvement activities will have the same impact, so HCOs need to establish ranking criteria with which to rank, evaluate, and select opportunities. At the problem definition stage, a cost (in financial, clinical, or other terms) associated with the quality or performance problem would have been calculated. The cost of actual improvement efforts can be compared to the cost of the problem, and a decision can be made to proceed with specific improvement initiatives that will have the greatest impact and require the least resources and effort—in other words, achieve maximum value.
The three steps in identifying and selecting improvement opportunities are as follows:
DETERMINING ROOT CAUSE
Healthcare QI teams often fall victim to addressing symptoms of problems, not the actual problems themselves. This will likely only result in the introduction of a workaround, not a solution to the problem. For example, if a medication cabinet in an observation area is regularly understocked, the “solution” may be for a healthcare aide or other staff member to raid (for lack of a better term) a medication cabinet of another area of the department. This not only results in additional inefficiency by requiring staff to move unnecessarily, but it may also cause problems downstream with other staff who rely on medications from the raided cabinet.
True QI requires healthcare professionals to move beyond “who” and “what” into “why” errors, defects, or waste occur. For real change to occur, we must change from being a blaming culture and into a solution-finding culture in healthcare by moving beyond responding to symptoms and start addressing actual root causes of problems.
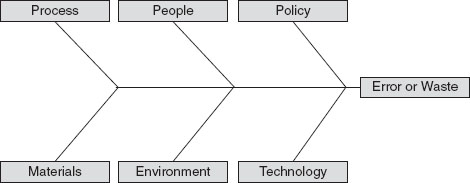
Because blaming seems to come more naturally than finding root causes, there are tools that can be employed within QI methodologies to help find root causes. One approach to identify root causes using an Ishikawa (or fishbone) diagram, as illustrated in Figure 8.3. A problem, error, or waste is identified and all possible causes for it are listed under various categories. (Typically, the categories are process, people, policy, materials, environment, and technology, although variations exist and oftentimes the categories are changed to fit the particular problem under investigation.)
FIGURE 8.3 Sample Ishikawa (Fishbone) Diagram Used for Identifying Causes of Problems, Errors, or Waste
Once possible root causes are identified, the contribution of each root cause can be mapped in a Pareto chart (see Figure 8.4). Pareto charts are very useful to highlight the most important contributing factors to a problem or issue. The main components of a Pareto chart are the identified causes of a quality or performance problem, vertical bars to represent the number (or percentage) of times the problem occurred as a result of that cause, and a line plotting the cumulative frequency of the causes (which should add up to 100 percent).
FIGURE 8.4 Sample Pareto Chart Used to Determine Important Contributing Factors to Quality Problems

Suppose an emergency department has implemented a new computerized triage tool and is experiencing an unacceptably high rate of triage overrides, which occur when the triage nurse does not agree with the triage score determined by the algorithm in the triage tool. During an investigation into the root causes of the overrides, triage nurses are asked to identify the reason they overrode the computer. The nurses identify five key issues that caused them to enter a score other than what the algorithm determined:
These five causes of triage overrides are then plotted on a Pareto chart (see Figure 8.4). By looking at the chart, the QI team is able to determine that approximately 70 percent of overrides are the result of two main issues: too many clicks, and confusing form design. With this information, the QI team can be reasonably sure that a significant percent of overrides can be prevented by addressing these two issues, which in fact would bundle nicely into a single triage form improvement project.
Analyzing the root causes of problems in a quantitative manner such as a Pareto chart can provide QI teams the insight they require to make a transparent, evidence-informed choice on which QI initiatives to undertake.
ESTIMATING IMPACT AND EFFORT
There may be some process changes that HCOs can make that would result in a large impact to the department or HCO but would require relatively little effort. Is there a way that we can quantify these high-impact changes? Consider Figure 8.5, which illustrates an impact/effort grid that can be used to help select QI projects. I have yet to encounter an HCO that has unlimited resources to dedicate to QI projects. Because of this, even though there may be many opportunities and needs for improvement, only a few projects are feasible to undertake at any one time.
FIGURE 8.5 Sample Impact/Effort Grid for Selecting Quality Improvement Projects

The impact/effort grid helps QI teams map projects according to estimated impact (that is, how much change or benefit can be expected) and what the anticipated effort to achieve that change might be. Projects that fall into quadrant 2 (high impact, low effort) are generally favored by HCOs, as these represent potential game changers, where big wins are possible with relatively little effort. Projects falling into quadrant 4 (low impact, high effort) should be avoided, as they can be a major drain on HCO resources and QI team morale, without any definite long-term positive impact on quality. Projects that fall into quadrant 1 (low impact, low effort) can be considered, but may detract resources from other projects that may have a bigger impact. Quadrant 3 projects, those that are high impact and high effort, should be evaluated carefully to determine whether the potential benefit of the project is worth the time and resources applied to achieve that benefit.
Analytics can be very helpful when mapping projects on an impact/effort grid, especially if relevant, detailed, and high-quality baseline data is available. For example, the anticipated impact of a project can be estimated by examining baseline levels of performance against anticipated targets, or, better yet, by looking at comparable performance metrics for other programs or sites that are performing better.
Estimating the impact of a change can be challenging; without any quantitative basis, impact estimates are little more than a mere guess. Various analytical approaches, including regression modeling and other predictive approaches, as well as simulation, can be helpful in better quantifying the effect of a change. See Chapter 11 for a discussion of various advanced analytics approaches.
Analytics in the Project Execution Phase
Executing improvement activities involves finding new ways of doing the required work to achieve the desired improvements (innovation), working with staff to implement the changes (intervention), and examining interim results to make any midcourse corrections (experimentation). During project execution, QI teams use analytics to closely monitor the processes that have been changed (or that have been impacted by changes to equipment, layout, or staffing levels, for example) to quantify differences in performance and quality.
During the execution phase, quality teams require detailed data with a rapid turnaround to make quick adjustments to their efforts to maximize the amount of positive change (or to mitigate any negative effects the changes might have introduced). This sees a shift in the type of analytics required. During this phase, QI teams will be much more directed in the information they are seeking. The QI teams are likely dissecting existing processes and workflows and developing new processes. Depending on the methodology used and the time frame of the initiative, the QI teams will likely be changing the actual workflows and processes that staff members are performing. It is therefore likely that QI teams will require data that is closer to real-time, and much more specific to the desired processes. As processes and workflows are changed, QI teams will need to be able to see if the changes have actually led to a change in performance.
QI projects (especially ones that employ a PDSA methodology) usually begin with small-scale, localized changes as part of an initial evaluation. During the execution phase of quality group initiative, the data requirements of the team become very specific. QI teams will often break down processes into very minute detail, and will seek available metrics to measure the performance of these process components. For that reason, data and utilization requirements on QI projects are different from higher-level monitoring.
Using indicators that are monitored at a departmental or organizational level may not be sufficiently granular to detect a localized change over a period of time. For example, a new process resulting in a reduction in hospital discharge times achieved over several days within a single unit may not even register on a more global indicator. For this reason, the output of analytics for a quality or performance improvement project in this stage should be:
- Relevant to the process or other change that is subject of the improvement effort.
- Focused locally on the department, unit, or other region where the change occurred.
- Available in near real time (or “short cycle”) to allow for rapid adjustments.
- Presented in appropriate formats (such as run charts or statistical process control [SPC] charts) to evaluate both variability in the data and the magnitude of change in performance. (Remember that a reduction in process variability is a key step toward improvement.)
It is possible, and indeed likely, that a lot of information during this phase will not be available from existing sources. Don’t be surprised if some required data is not even available in computerized form. For example, many improvement initiatives rely on audit data (that may not be available in electronic medical records or other systems) such as:
- Number of times a computer system (e.g., RIS/PACS) is not available (on downtime).
- Number of times a new process was followed correctly (as defined in standard work).
- Number of times a medical admission form was not completed properly.
Just because information may not be easily obtained or currently available does not mean that it is not important; in fact, very often these process components are overlooked. There are a few options to obtain this information. One option is to manually collect the data on audit forms placed throughout the unit and compile it in something like a spreadsheet. Although this may seem like a lot of work, often there is no other way to obtain such information. What may be possible is to link this manually collected and entered data to your current BI platform so that it can be integrated into existing dashboards or other performance reports for use by the team.
Using Analytics to Evaluate Outcomes and Maintain Sustainability
After the project execution phase and a change in performance or quality has been successfully implemented and tested on a smaller scale, the project team naturally will deploy the improvement throughout other applicable areas within the HCO. Once the project has been deployed, continued monitoring and evaluation are necessary to ensure that the desired changes in quality and performance are occurring on the new, larger scale.
There are several possible approaches for evaluating the impact of an improvement project. For example, the team might want to compare quality or performance before and after the implementation of a new process or other innovation to determine if a change occurred, and what the magnitude of that change was. Or they may compare the impact of two different changes to determine which has the greater magnitude. For example, a department manager may wish to evaluate the impact of a new type of staff member (such as nurse practitioner or physician assistant) and compare baseline department performance to performance since the new role was added to determine the overall impact.
Once the desired changes are in place, analytics can be used to quantify the impact of the changes based on the initial indicators, and comparisons with benchmarks can be used to gauge progress toward meeting the designated targets. There are many ways to monitor performance—usually in the form of performance dashboards or other reports. SPC charts are, once again, a very valuable tool to monitor the ongoing performance relating to changes being made. Just as is necessary during the project execution phase, evaluation results must be available quickly enough to take meaningful corrective action if necessary.
Sustaining Changes and Improvements
Careful analysis and redesign of healthcare processes can be successful at improving quality and performance. Without looking at the right data, or analyzing it correctly, it may be difficult to evaluate the impact of a change. And when a change does occur, it is less likely to be sustained without ongoing monitoring and corrective action.
Healthcare QI projects typically start off with a flourish, but all too often end with a whimper. This is because the excitement generated with a new project, new opportunities, and great expectations elevates QI teams with a feeling that anything is possible. This enthusiasm usually dies down by the end of a project, when team members look to other problems to address.
It is important not to lose sight of improvements that are made, so performance must continually be monitored to ensure that things don’t revert to previous (undesired) levels of quality or performance.
This final stage is critical for QI initiatives, because sustainability is in fact one of the most challenging objectives to achieve. Many initiatives appear initially successful, but the desired performance begins to tail off after a few weeks or a few months. Monitoring during this phase must allow QI teams (and the HCO’s leadership) to monitor ongoing performance of the improved processes. The actual metrics being followed during this phase may be fewer in number than during the execution phase, but the metrics chosen for monitoring and evaluation must be the most relevant to the performance desired. In addition to a performance dashboard highlighting the key indicators of a newly implemented improvement initiative, regular reports and automatic alerts that are e-mailed to key stakeholders draw the attention of QI team members when performance begins to deteriorate or otherwise deviate from desired parameters.
Note
1. Centers for Medicare and Medicaid Services, “EHR Incentive Programs,” www.cms.gov/Regulations-and-Guidance/Legislation/EHRIncentivePrograms/index.html.