CHAPTER 2
Fundamentals of Healthcare Analytics
If you always do what you always did, you will always get what you always got.
—Albert Einstein
Effective healthcare analytics requires more than simply extracting information from a database, applying a statistical model, and pushing the results to various end users. The process of transforming data captured in source systems such as electronic medical records (EMRs) into information that is used by the healthcare organization to improve quality and performance requires specific knowledge, appropriate tools, quality improvement (QI) methodologies, and the commitment of management. This chapter describes the key components of healthcare analytics systems that enables healthcare organizations (HCOs) to be efficient and effective users of information by supporting evidence-informed decisions and, ultimately, making it possible to achieve their quality and performance goals.
How Analytics Can Improve Decision Making
Healthcare transformation efforts require decision makers to use information to understand all aspects of an organization’s performance. In addition to knowing what has happened, decision makers now require insight into what is likely going to happen, what the improvement priorities of the organization should be, and what the anticipated impacts of process and other improvements will be. Simply proliferating dashboards, reports, and data visualizations drawn from the HCO’s repository of health data is not enough to provide the insight that decision makers need. Analytics, on the other hand, can help HCOs achieve understanding and insight of their quality and operational performance by transforming the way information is used and decisions are made throughout the organization.
Analytics is the system of tools and techniques required to generate insight from data. The effective use of analytics within an HCO requires that the necessary tools, methods, and systems have been applied appropriately and consistently, and that the information and insight generated by analytics is accurate, validated, and trustworthy.
In modern healthcare, substantial quality and performance improvement may be stymied without changes to the way information is used and acted upon. With this in mind, the fundamental objective of healthcare analytics is to “help people to make and execute rational decisions, defined as being data driven, transparent, verifiable and robust”:1
- Data driven. Modern healthcare standards demand that clinical decisions be based on the best possible evidence that is generated from extensive research and data. Yet administrative decisions, process and workflow design, healthcare information technology (such as EMRs), and even some clinical decisions are often not held to these standards. Analytics in healthcare can help ensure that all decisions are made based on the best possible evidence derived from accurate and verified sources of information rather than gut instinct or because a process or procedure has always been done in a certain way.
- Transparent. Information silos are still a reality in healthcare due to the belief by some that withholding information from other departments or programs best maintains autonomy and control. This belief, however, often has the opposite effect and invariably leads to misunderstandings and a deterioration of trust. A key objective of analytics in healthcare is to promote the sharing of information and to ensure that the resultant insight and information is clearly defined and consistently interpreted throughout the HCO.
- Verifiable. Consistent and verifiable decision making involves a validated decision-making model that links the proposed options from which to choose to the decision criteria and associated methodology for selecting the best available option. With this approach, the selected option “can be verified, based on the data, to be as good as or better than other alternatives brought up in the model.”2
- Robust. Because healthcare is a dynamic environment, decisions must often be made quickly and without perfect data on which to base them. Decision-making models must be robust enough to perform in nonoptimal conditions. That is, they must accommodate biases that might be introduced as a result of missing data, calculation errors, failure to consider all available options, and other issues. Robust models can benefit from a feedback loop in which improvements to the model are made based on its observed performance.
Analytics, Quality, and Performance
The techniques and technologies of analytics provide insight into how well an HCO is performing. Analytics enables healthcare leaders and QI stakeholders to make evidence-informed decisions through techniques, tools, and systems that:
- Clarify and improve understanding of patterns seen in data.
- Identify when (and why) change has occurred.
- Suggest (and help validate) the next logical steps to achieve desired change.
First and foremost, analytics must help answer questions and drive decision making related to achieving and maintaining safe, effective, and efficient delivery of healthcare. Effective healthcare analytics, however, consists of more than pointing statistical analysis software at large databases and applying algorithms and visualization techniques.
What distinguishes analytics from most currently deployed reports and dashboards are the graphical, mathematical, and statistical tools and techniques to better understand quality and performance issues, and more importantly, to identify what possible actions to take. Figure 2.1 illustrates the ways in which information can be used to support decision making for quality and performance improvement initiatives. Most HCOs use reports and dashboards to review past performance (circle 1). Although a solid understanding of past performance is essential in identifying quality issues and monitoring progress toward meeting targets, relying solely on retrospective data provides little insight into what an HCO should be doing now or in the future.
FIGURE 2.1 Reporting and Analytics Capabilities for Quality and Performance Improvement
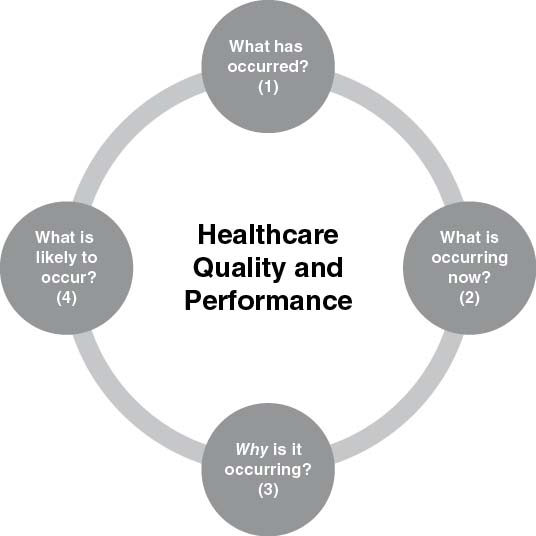
Many HCOs are adopting the capability for real-time performance monitoring, which may include real-time (or short-cycle) dashboards that provide a reasonable picture of what is currently happening within the HCO (circle 2). To be effective, real-time monitoring must encompass appropriate indicators that are aligned with strategic and/or tactical performance goals and be linked to triggers within business processes that can signal that an action or decision is required.
The reports and dashboards typical of circles 1 and 2 may help highlight what has occurred in the past, or what is currently occurring. But on their own, the information typical of circles 1 and 2 provides little insight into why performance is the way it is.
Analytics goes one step further and helps answer questions such as why problems likely are occurring, highlights relationships between events and issues (circle 3), and, given the right models and data, can even begin to anticipate future outcomes and occurrences (circle 4). Analytical approaches (such as regression modeling and data mining techniques, for example) help to highlight relationships between various factors that, to various degrees, may be impacting quality and performance.
For example, within existing reports and dashboards, an HCO might see that there has been a steady hospital-wide drop in patient satisfaction over the last quarter, and that an increase in central line infections has occurred over a similar period. Reports and dashboards may also highlight an increase in emergency department lengths of stay, and an increase in staff absenteeism rates. But most standard methods of reporting are incapable of providing any insight into why these issues are arising; charting methods such as basic bar or line graphs would be able to illustrate a trend over time and the amount of change in a measure that has occurred. Analytics tools and techniques go one step further to help provide better insight into why these quality issues are present, determine if they are related, and predict future trends and possible outcomes.
Applications of Healthcare Analytics
One benefit of analytics is to enable healthcare leaders, QI teams, and other decision makers to ensure that the decisions being made are evidence-based, transparent, verifiable, and robust. Most areas of healthcare can benefit from decision making that meets these expectations; a few examples are outlined next.
- Process and workflow improvement. Efficient, effective, affordable, and safe patient care begins with processes and workflows that are free of barriers to quality and from which waste is reduced or eliminated. Determining what to improve, and how to improve it, is the responsibility of dedicated multidisciplinary QI teams. The productivity of these QI teams, however, is greatly enhanced when they can leverage analytics to provide detailed insight into the processes and workflows that comprise the management and provision of healthcare.
QI teams rely on analytics for superior analysis of baseline data to identify bottlenecks and other causes of poor quality and performance. Analysis of baseline performance and quality data helps QI teams to identify and prioritize these causes so that the improvement initiatives selected are the most likely to have an impact and be successful. Analytics is also necessary for monitoring ongoing performance of processes and workflows, after improvements have been made, to ensure that the improvements are sustained in the long term.
- Clinical decision support (CDS). Many people incorrectly consider analytics as merely an extension of reporting. But analytics is not just a back-office capability. Analytics in support of clinical decision making can take on many roles, ranging from providing suggestions and evidence regarding the management of a single patient to helping manage an entire unit or department during a surge in patients. CDS is perhaps the ultimate use of healthcare analytics, which is disseminating timely, actionable information and insight to clinical providers at the point of care when that information is required and is the most useful. CDS leverages the information available within the entirety of the enterprise data warehouse (EDW) and clinical source systems to give providers insight into many clinical issues, ranging from possible diagnosis suggestions to predictions for excessive length of stay or adverse outcomes.
An example of analytics in CDS is computerized provider order entry (CPOE) systems. The best of these systems automatically check the order with medical guidelines and compare ordered medications with other medications a patient is taking to check for the possibility of adverse drug interactions. Benefits of CDS systems are already being realized; one study demonstrated a 40 percent reduction in adverse drug reactions and other critical events in just two months.3
Other examples of analytics in CDS include flagging a patient as being at risk for an extended emergency department visit, or assisting with the triage of multiple patients presenting with an unknown respiratory ailment during influenza season. In the first case, the patient may be placed on special protocols to prevent unnecessarily long stays in the emergency department. In the second, analytics can help fill gaps in patient information and identify which new cases may be high-risk, allowing care providers to take appropriate isolation and infection control precautions.
- Population health management. Population health management is “the coordination of care delivery across a population to improve clinical and financial outcomes, through disease management, case management and demand management.”4 Analytics helps HCOs achieve these improvements by identifying patient subpopulations, risk-stratifying the subpopulations (that is, identifying which patients are at highest risk of poor outcomes), and using CDS tools and best evidence to manage patients’ and populations’ care in the best way possible. Analytics also contributes to the ongoing tracking of patients to determine overall compliance and outcomes.
- Payer risk analysis and fraud prevention. One contributing factor to the high cost of healthcare is fraud and other improper billing to healthcare insurance. Healthcare data analytics is expected “to fundamentally transform medical claims payment systems, resulting in reduced submissions of improper, erroneous or fraudulent claims.”5 This transformation in fraud prevention is possible because computer algorithms are able to analyze healthcare databases, scanning for patterns and other clues in the data that might indicate fraudulent activity and other irregularities. Once a manual, painstaking, and imprecise process, this is now an automated, immensely more efficient process, saving healthcare systems billions of dollars. For example, the Centers for Medicare and Medicaid Services (CMS) achieved $4 billion in recoveries because of the fraud detection abilities possible with data analytics.6
In addition to improving understanding within each of these and other components of healthcare, analytics offers the potential to break through traditional barriers and allow understanding across so-called silos.
Components of Healthcare Analytics
Analytics consists of much more than back-office analysts applying computer algorithms to ever-growing volumes of data. Analytics exists in healthcare to enhance the quality and safety of patient care while reducing costs. Patient care is a human-driven endeavor, therefore healthcare analytics requires the input of stakeholders to define what is useful and necessary. The output that healthcare analytics provides must be utilized by leaders, QI teams, and other decision makers in order to have any effect. Between the initial input and the resultant output, there are many levels and components to an analytics system that make evidence-based decision making possible. Forrester Research, Inc., identifies the “business intelligence [BI] stack”7 to consist of the following layers:
- Infrastructure
- Performance management
- Supporting applications
- Analytics
- Discovery and integration
- Data
- Infrastructure
The Forrester Research BI stack (and similar models from other organizations) provides a highly detailed summary of the components required to construct a BI infrastructure within a business enterprise (of which healthcare is but one example). The purpose of this book is to focus on the essentials of analytics for healthcare quality and performance improvement, so I have employed a modified stack optimized for healthcare analytics that focuses on business problem identification and insight generation.
Figure 2.2 illustrates this “analytics stack,” a representation of what is required of an analytics system within an HCO to provide insight and support evaluation of outcomes. Although not strictly necessary for analytics, a well-developed BI infrastructure will definitely support and enable analytics and decision making throughout the HCO. For an excellent healthcare BI resource, I recommend Healthcare Business Intelligence: A Guide to Empowering Successful Data Reporting and Analytics.8 The analytics stack described here does not focus on the particulars of any one data warehouse model or technology but instead assumes that a mechanism is in place for data to be made available for analytics in a suitable format.
FIGURE 2.2 Components of the Healthcare Analytics “Stack”

The basic layers of this analytics system for performance and QI are:
- Business context
- Data
- Analytics
- Quality and performance management
- Presentation
- Business context layer. This layer is the foundation of an analytics system and represents the quality and performance goals and objectives of the HCO. Included in the business context is the “voice of the patient” as a reminder that, above all, the goal of HCOs is to provide value to patients by delivering effective, efficient, and safe medical care. Every organization will have its own set of goals and objectives because of varying circumstances, demographics, and other factors. The goals and objectives of the business, and the strategies the HCOs employ to achieve them, drive requirements at every other level.
- Data layer. This layer of the analytics stack represents the quality, management, integration, and storage of data and the associated infrastructure. With the generation and accumulation of healthcare data comes the need to extract and integrate data from source systems such as electronic medical records (EMRs), store the data securely, and make high-quality data available for analytics and BI uses. Aspects of the data layer include:
- Data sources. These are the source systems such as EMRs, plus financial, supply chain, and other operational systems, that providers and other staff utilize in their day-to-day work. By and large, data in source systems is optimized for transactions, not analysis. When more than one data source exists, the data sources must be integrated to achieve true enterprise-wide visibility.
- Operational data store. As part of the integration process of bringing multiple data sources together into a single enterprise view, an HCO may opt for an operational data store (ODS) as an intermediary level of data integration. The ODS forms the basis for additional data operations (such as cleaning and integrity checks).
- Enterprise data warehouse. An EDW is built when available sources of data must be cleaned, transformed, and integrated for analysis and reporting to provide an enterprise-wide view of data. The data warehouse contains key indicators and other performance data pertinent to the quality and performance of multiple domains throughout the HCO.
- Analytic sandbox. The data in the EDW may be stored in a way that is aggregated to allow for faster, more efficient queries and analysis. Analysts may require access to lower-level data (for example, line-level patient data) to test new business rules or to run data-mining algorithms. The analytic sandbox is an area set aside for data for these purposes that does not negatively impact the performance of other operations on the EDW outside the analytics sandbox.
- Data marts. It may not be necessary, or advisable, for somebody to see all the possible data from across the entire enterprise that is available in an EDW. In these cases, data marts are instantiated; data marts are subsets of data from the data warehouse (or the entire data set when only one source system exists), are usually organized by lines of business or healthcare domain, and represent what somebody within a particular line of business would need to see to best understand the performance of his or her program, department, or unit.
- Integration. Combining multiple source systems into a connected EDW is the process of integration. Without proper integration, an EDW would be nothing more than a collection of data points without any clear logic linking them. Integration can occur through a process of Extraction/Transformation/Load (ETL), which, in the most typical scenario, copies data from the source system(s), applies logic to transform it to the analysis needs of the organization, and loads it into an EDW. Other forms of integration, including virtualization, which defines a single interface that links to every point of data in the HCO, are increasingly common as volumes of data expand and new approaches to data management are required.
- Analytics layer. This layer is comprised of the tools and techniques that analytics teams use to generate information and actionable insight that drives decision making. Components of this layer include the intellectual knowledge of analytics teams and the computer software tools to apply that know-how. In this layer, analytics helps to identify quality and performance problems, develop analytical models appropriate to the problem, perform statistical analyses, generate insight into problem-solving approaches, and trigger necessary action.
The analytics layer requires strong involvement from stakeholders, who provide the requirements for analytics that link the strategic-level goals and objectives for the organization to more tactical-level analytics for decision making on the front lines by managers and QI teams. Consideration of how analytics projects and teams are to be managed to ensure a successful deployment is also necessary. There are several key features of the analytics layer:
- Online analytical processing (OLAP). OLAP tools typically accompany data sets that are preaggregated and stored in a multidimensional format (that is, based on dimensions and facts) that allows users to quickly and interactively analyze data from multiple perspectives. OLAP typically consists of three types of operations: drill-down, which allows users to obtain and navigate through additional detail (for example, viewing revenue from each line of business of an HCO), roll-up (the opposite of drill-down, or the consolidation or aggregation of data), and slice-and-dice (with which users can extract a subset of data and view it in multiple dimensions).
- Ad hoc analytics. When more complex analysis is required than is available through OLAP tools, analysts will use more statistical-based or other specialized tools to conduct deeper analysis. This type of analysis usually relies on nonaggregated data, and is often best performed in an analytics sandbox away from other EDW activities.
- Text mining. Text mining involves extracting value (by deriving patterns and trends) from unstructured text data. This is data that is stored in progress notes and wherever else codified data entry is not performed.
- Data mining/predictive analytics. These two disciplines consist of the process of determining patterns and trends in the data, and using the knowledge and understanding of those patterns and trends to make predictions about future performance or occurrences.
- Quality and performance layer. This layer aligns analytics to the processes that need to be improved, the indicators by which processes and outcomes will be evaluated, and the performance targets desired by the HCO. The actual improvement strategies and methodologies to be used (such as Lean and Six Sigma) should also be considered in this layer. This is important because improvement projects usually require extensive analysis of baseline performance and typically utilize indicators to evaluate project outcomes in order to sustain improvements in the long term.
- Processes. Data is a by-product of the work that clinical providers and other healthcare workers perform. When these workflows and processes are documented, data can be aligned with them to increase understanding of what the data means.
- Indicators. These are measures of certain aspects of an HCO’s performance.
- Targets. These are values that represent what the performance levels of a process or workflow should be, and represent the ideal range of an indicator.
- Improvement strategy. This describes how an HCO intends to address quality and performance issues, and what methodology the organization intends to employ (such as Lean or Six Sigma).
- Evaluation strategy. This is how organizations plan to monitor and evaluate the performance of key processes and indicators within the HCO.
- Presentation layer. This layer of the analytics stack can be considered the analytics “user interface.” The presentation layer manages the form in which insights and information are delivered to the decision makers. This layer is comprised of elements ranging from traditional reports to contemporary dashboards and can include more specialized tools such as geospatial visualization (or mapping). Although much of the heavy lifting of healthcare analytics is situated within the data, analytics, and quality management layers, the presentation layer is critical because how well information is communicated will impact its usefulness to decision makers, QI teams, and other stakeholders.
Given the different components that must work in concert to provide meaningful insight to decision makers, the effectiveness of an analytics system for quality and performance improvement will be greatly diminished without an analytics strategy. (See Chapter 3 for further information about developing an analytics strategy.) The purpose of the analytics strategy is to guide the HCO’s ability to rapidly respond to the information needs of stakeholders while maintaining a consistent direction in supporting the quality and business goals of the HCO. The analytics strategy provides a guide for sorting through the many and perhaps conflicting analytics needs of the HCO, and ensuring that each of these layers is configured, aligned, and/or developed appropriately to achieve the quality goals of the HCO. The strategy must guide decisions regarding what projects to undertake, what tools to invest in, and how to maximize return on investment in analytics tools. The analytics strategy will align with, or be a component of, the overall BI strategy, since many analytics capabilities will depend on the extent to which a BI infrastructure is in place.
Beyond the layers of data and technology of an analytics system is how the data is used—that is, the problem-solving that spans all of these layers. For example, many dashboards and reports merely reflect what has happened, and provide data in typical, predictable ways. But analytics encourages and assists people to think differently about the data they have and the problems they are solving. Sometimes a simple change such as applying a new visualization or applying a new statistic can help illuminate an existing problem in a whole new light. Other times, more sophisticated analytical techniques will be required to solve a particularly perplexing problem. All components of the analytics stack require careful consideration to ensure that the known questions of today are being addressed, and that an analytics infrastructure is being built that ultimately will address the unknown questions of the future.
Notes
1. Rahul Saxena and Anand Srinivasan, Business Analytics: A Practitioner’s Guide, International Series in Operations Research & Management (New York: Springer Science+Business Media, 2013), 9.
2. Ibid, 10.
3. Mike Cottle et al., Transforming Health Care through Big Data: Strategies for Leveraging Big Data in the Health Care Industry (New York: Institute for Health Technology Transformation, 2013), www.ihealthtran.com/big_data_in_healthcare.html.
4. The Free Dictionary, “population health management,” http://medical-dictionary.thefreedictionary.com/population+health+management.
5. Mike Cottle et al., Transforming Health Care through Big Data.
6. Ibid.
7. Boris Evelson. It’s Time to Reinvent Your BI Strategy (Cambridge, MA: Forrester Research, 2007), 4.
8. Laura B. Madsen, Healthcare Business Intelligence: A Guide to Empowering Successful Data Reporting and Analytics (Hoboken, NJ: John Wiley & Sons, 2012).