
Total Customer Value Management, Pricing and Preventing Commoditization
The reader has made a journey to understand Total CVM, how to measure Customer Value Added (CVA), and how to change mind-sets and incorporate various techniques such as Customer Strategy and Customer-Centric Circles. Now the reader is at a point to use Customer Value and CVA for advanced ideas.
One such idea is on pricing. If you create the value that the Customer is looking for, and if she perceives that you are creating value, what does she do? Does she choose your product first (show a preference for it) or be prepared to give you a higher price?
Her perception that you are creating value means she thinks you are creating a better benefits/cost ratio than competitive offers. That means, she is willing to consider your product and/or services over competitions’. Depending on the value you are creating, she may be willing to pay a higher price.
Let’s look at what she may be willing to pay.
We start again with the Value Map that was discussed in Chapter 7. The Value Map plots all competition’s data and our company data on a graph of the Customer’s perception on the overall cost versus the benefits. We draw a fair value line as shown in Chapter 7, and then compare ourselves to competition. Those companies falling below the fair value line are adding value to Customers, and those above the line are depleting value.
Let us assume we are company AA. In this example, the product is a commodity. You can see we are adding value, as we fall below the fair value line. So we can increase price to reduce the value, or reduce the benefits to decrease the value. Let’s decide to increase the price to reduce the value we are giving away (Fig. 14.1).
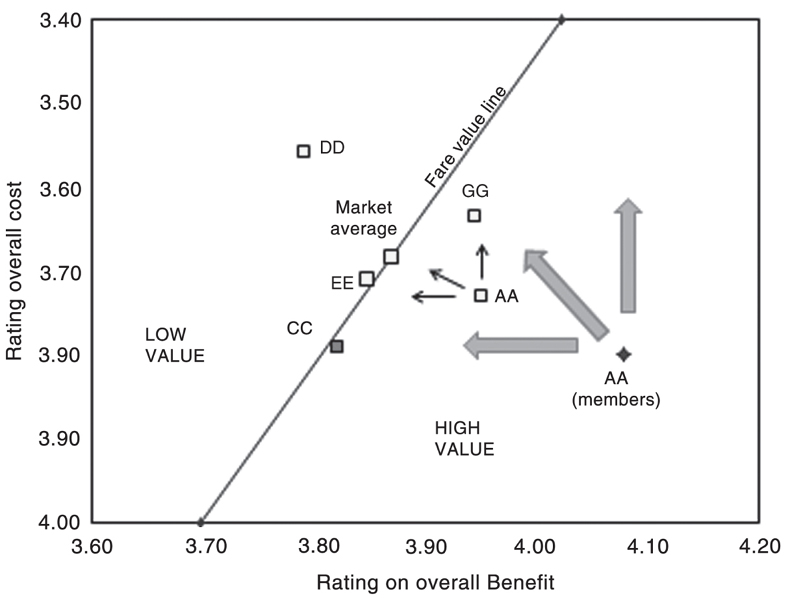
Figure 14.1 Brand of Urea Value Map (Farmers)
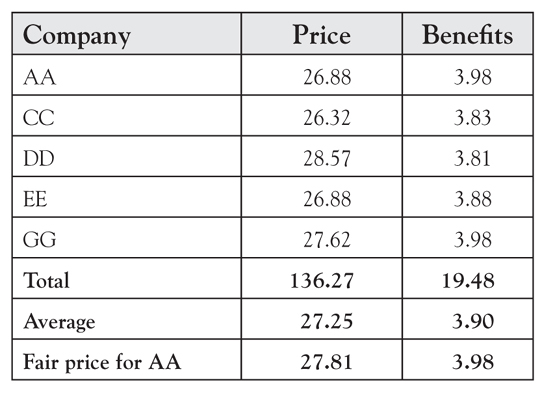
How do you know how much to add to the price of the product? There are many ways. I will show you a simple way. Let us tabulate the price versus the benefit as shown in Table 14.1 (I have taken actual prices).
Table 14.1 Price versus Benefit
You can calculate the fair value price for DD. Notice here we are looking at ratings in the table. We could have indicated actual price as well.
BB is missing in the table. We did not include it as we did not have enough data on it.
You can see we are presenting the price for each of the competitors and their benefit as we found from the CVA study. The average of all the different prices is 27.25, and the average of the benefits is 3.90.
Thus, an average product in this category will demand a price of 27.25. Our product gives a benefit of 3.98 and so deserves a price of 3.98 divided by 3.90 and multiplied by 27.25 giving us a price of 27.81, which is an improvement of 3.4 percent over AA current price.
Remember that in this example you are in an almost commodity market, and a 3.4 percent improvement in price could improve your profits depending on your variable and fixed costs to almost 30 to 45 percent. Not bad! (How did I reach this conclusion?) Typically, a 1 percent increase in price means a profit increase of 10 to 15 percent. Did you know this?
Let’s say your sales price is 100, your fixed costs are 25, and your variable cost is 67. Then your profit is 8. Now we increase price by 1 percent from 100 to 101. Our profit goes up from 8 to 9 or we increase the profit by 1/8 or 12.5 percent.
Don’t live in the commodity hell. Decommoditize!
In the real world, you might wish to increase your price by 1 to 1.5 percent initially, while working on improving benefits further.
Also look at AA members, with benefits of 4.10. You can figure out a fair price to charge them.
In a non-commodity market, you might be able to get higher prices.
We can actually break down benefits into its attributes, and conduct this exercise for each benefit attribute and price that attribute based on the relative importance of the attribute as well as the ratings from the Customers.
With a proper CVA study, you can determine your fair price and what to add for improvements
Pricing Based on Subattributes of Benefits
We can get even more granular. We know that benefits have subattributes. Let’s assume these are the product, the service, and the image. I am noting down hypothetical importance or weightages:
Product 20%
Service 45%
Image 35%
Then we can say for the average product in the example given in the previous section, the service has 45 percent of a bearing on the price. So the average price of 27.25 is made on the importance of the product, the service, and the image.
Decommoditization
You will note that the above example happened to be in a commodity market. It is actually for a fertilizer. Even though the competitors keep on focusing on the quality of the fertilizer, the farmer knows there is no difference in the product. If this is the case and the fertilizer is a true commodity, farmers would buy on price. However, it turns out that the farmers prefer specific companies and their fertilizers. Such companies have a reach out program, membership programs, and contact processes that align the Customer to the company. Hence, even though there might be a slight price differential, they prefer to buy the company they have an association with and trust. You can see this in Chapter 5, where the fertilizer example is explained.
Such a reach out program decommoditizes the fertilizer. You can see the relative importance of the product image (Fig. 14.2).
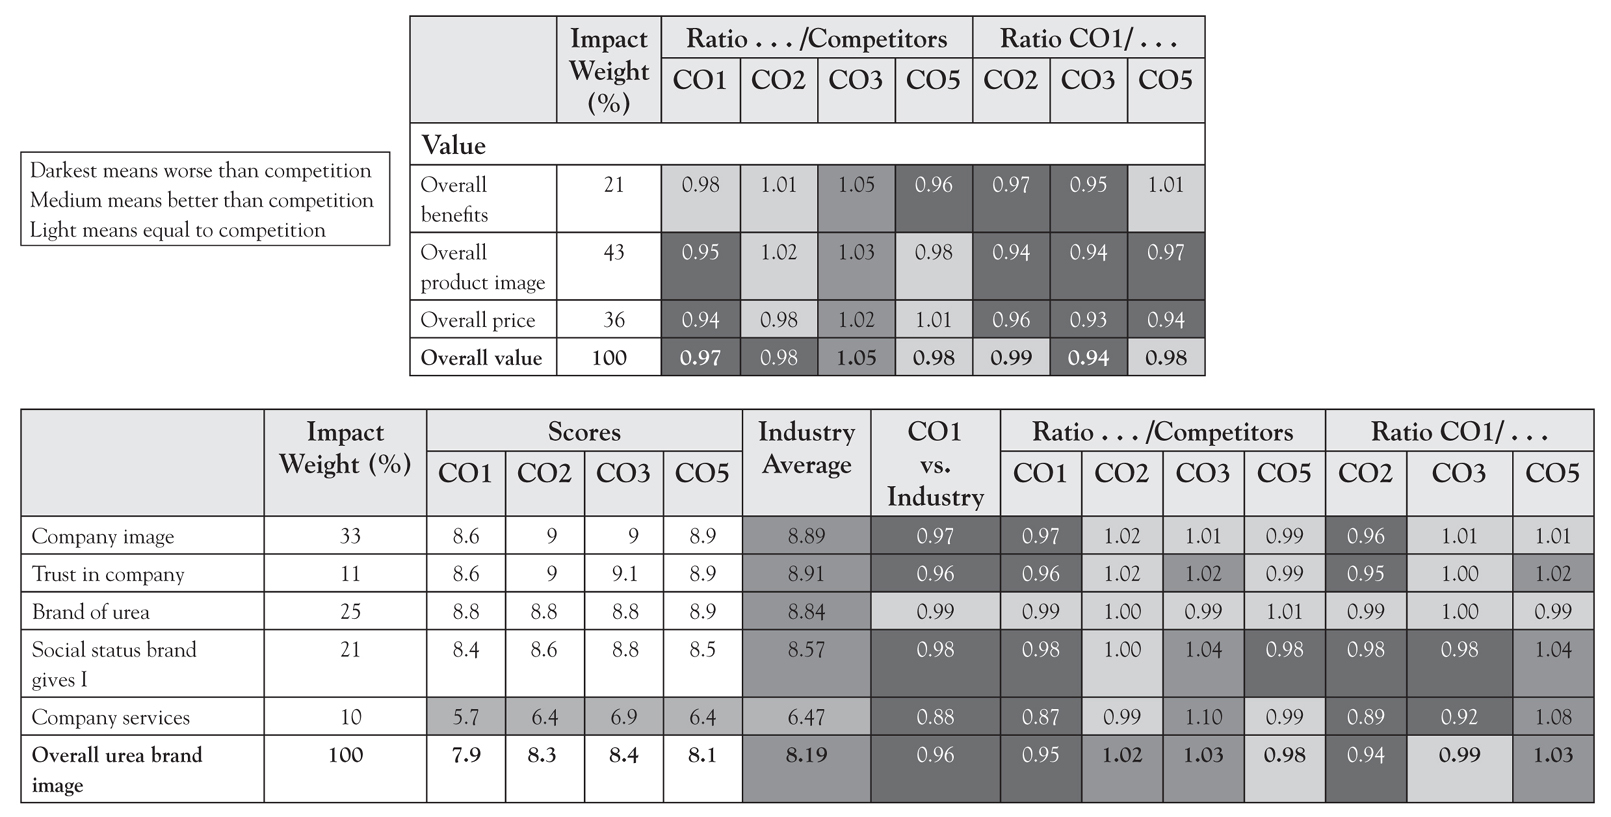
Figure 14.2 Customer Value profile
Also, we can see which attributes to work on to increase value and potential price.
Total Customer Value Management helps all departments and executives to have a Customer focus. It is the foundation of building a Customer culture. Customer strategy and Customer-Centric Circles are building blocks of the Customer culture and a Customer mindset. This gives the company a great competitive advantage. Do you find your executives talking about how to improve Customer Value? Have you attended such meetings?
You can see from this chapter that price depends on the benefits you create. If you create lower benefits, you will command a lower price and vice versa. Each part of your benefits has a price associated with it based on the relative importance of that benefit. Thus price is dependent on the value you create. Value Propositions are actually benefit propositions, also called price justification
Moreover, you can decommoditize products by adding value such as a brand, an image, an association of the product with the Customer, a service, and so on.
Do It Yourself
See if you can create a Value Map for your product, and see where you stand versus competition.
Figure out the price for the benefits you create.
How much does 1 percent increase of price mean for your company in profit increase?
Think of value creating ideas that can decommoditize or add more value to your Customers. Try to put them into a priority based on the importance the Customer gives to these items
See if you can predict prices based on the attributes and the sub-attributes (see Chapter 5).