TOOLBOX
Creating Your Custom Design Principles
Purpose
To work together with your design team to create a set of design principles to serve as the fundamental goals for your new performance management solution.
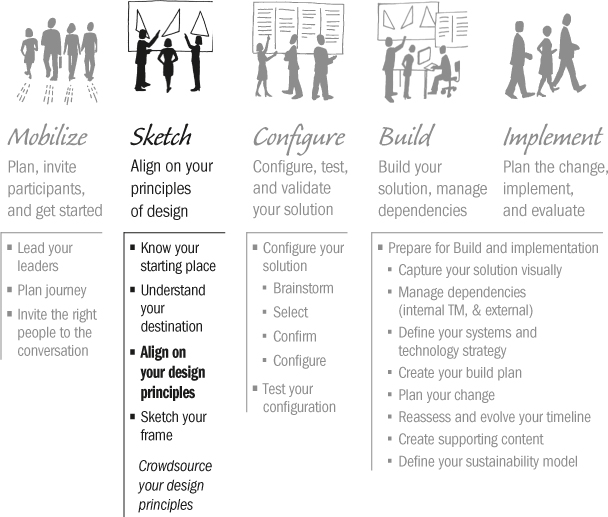
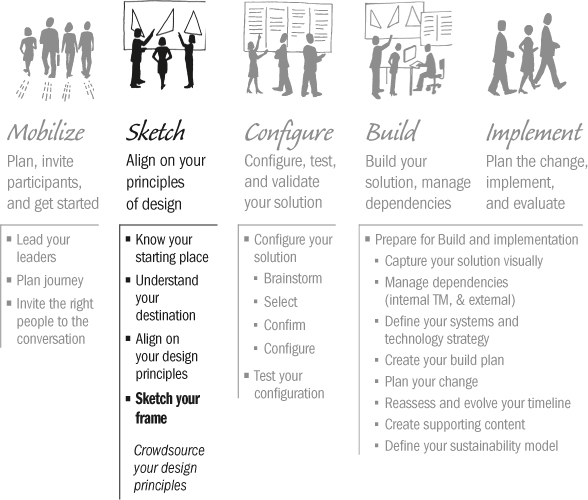
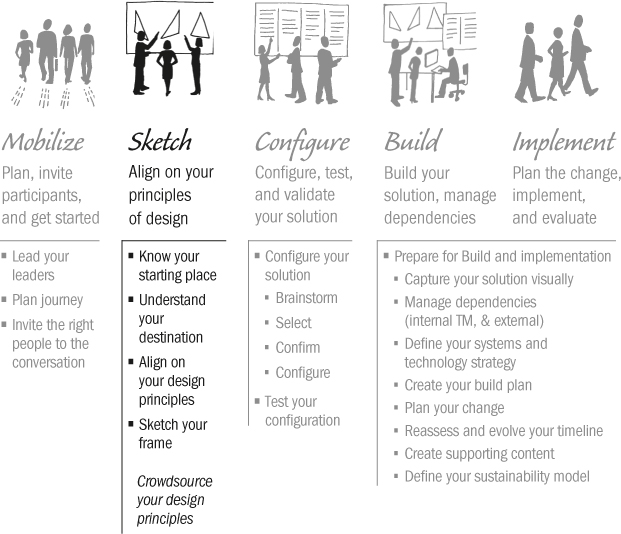
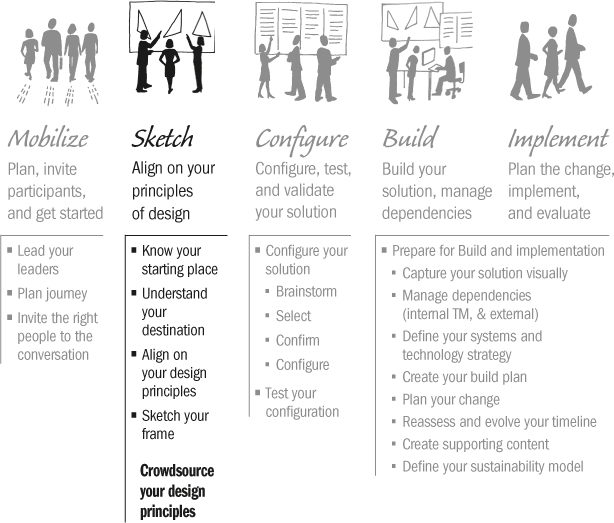
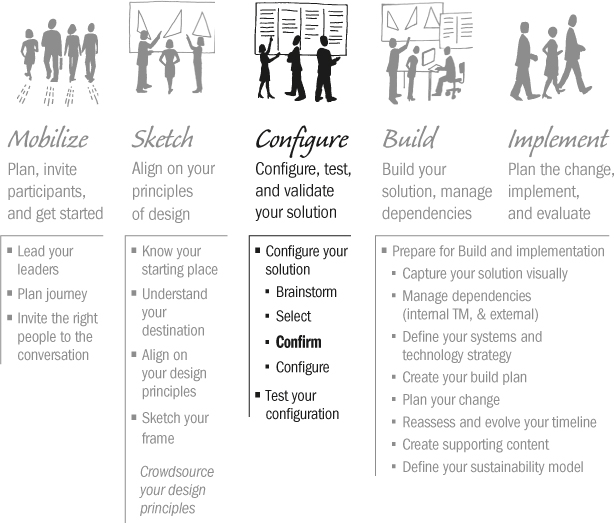
Where are we?
Tips and tricks
I’m going to assume that your design team is all together in a room when describing this process. If that’s not the case, you can follow the same process, but you’ll need to use technology creatively in place of old-fashioned pen and paper.
Process
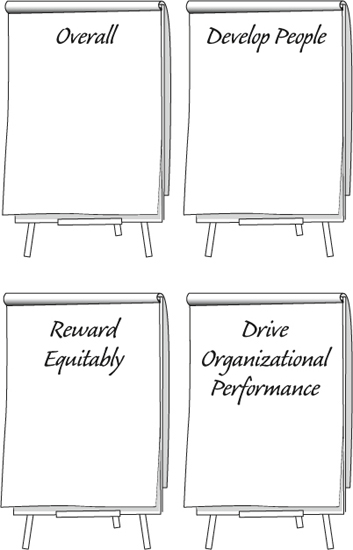
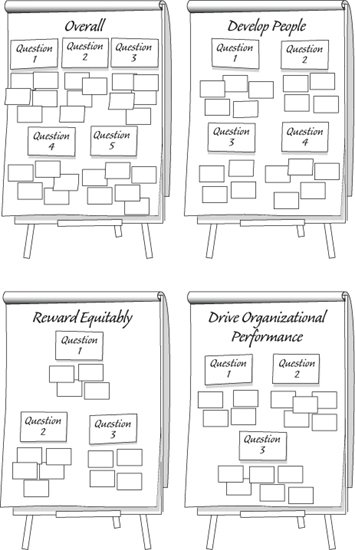
1. Place flip charts around the room with these headers:
• Overall
• Develop People
• Reward Equitably
• Drive Organizational Performance
Figure T.1. PM Reboot drivers as flip chart headers.
2. Write each of the questions from the table below on its own large sticky note. Arrange the sticky notes on the appropriate flip chart.
Figure T.2. Design principle questions.
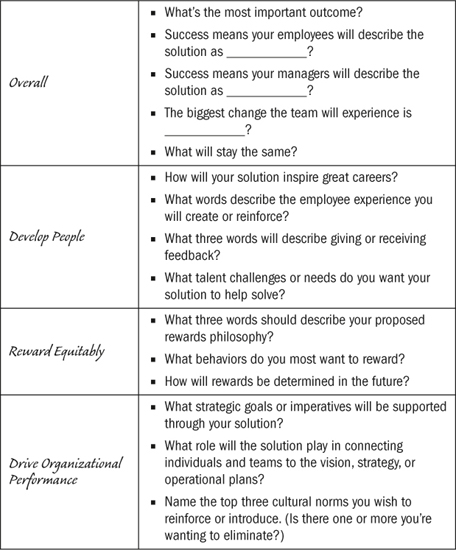
Rather than asking everyone to shout out their answers, have the design team members answer the questions on their own, writing each of their answers on a different sticky note. Individuals can provide multiple answers for the same question if they choose, as long as they’re on separate sticky notes. Once everyone has answered the questions, ask your team to put their sticky notes under the relevant questions on the relevant flip charts.
Figure T.3. Design principle questions completed.
3. When everyone is finished, assign small groups to each of the four flip charts. Have them organize the ideas into clusters of similar answers and then write a statement that describes each of the affinity groups (i.e., clusters) they’ve created in this way.
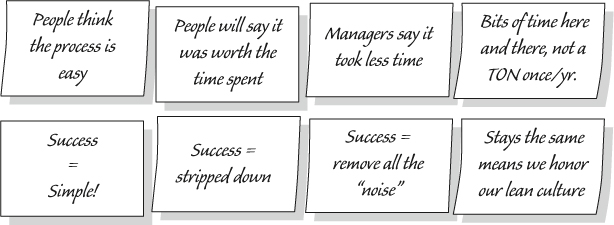
Here’s an example:
• Let’s imagine a team identified these responses as a cluster on the overall flip chart, as shown on the next page.
Figure T.4. Sample responses on sticky notes.
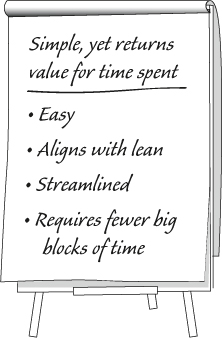
• Then, for this cluster of responses, the team would write a statement that looked something like this:
Figure T.5. Sample statement on flip chart.
4. Once each of the four flip chart teams has clustered and labeled its assigned section, have the teams take turns reporting on their proposed themes. Ask a scribe to capture the drafted statements on a fresh sheet of paper. These are your possible design principles.
5. Now, as a group, step back and look at the list. It’s likely that you’ll have some overlaps, so take the time to remove redundancies. Work together to consolidate where you can and fine-tune the subheaders to provide more clarity.
6. Once you have a relatively clean list, it’s time to set your priorities. Using a multivoting technique, give each design team member six dots and ask them to place their dots on the possible design principles that they feel are most vital to achieving the outcomes you’re seeking. If a person wants to place three dots on one design principle, that’s OK. It’s obviously very important to him or her.
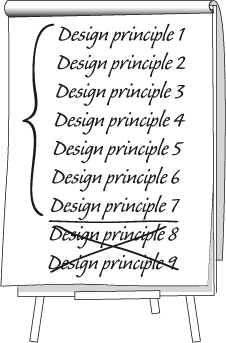
7. Once the votes are in, tally up the totals. Rewrite the top winners in priority order on a clean sheet of paper. If you have more than seven or eight design principles, you’ll need to decide as a team where you want to draw the line. Perhaps you can incorporate some of the ideas that got fewer votes into the subheaders of top design principles. Or maybe there are elements that you’ll keep in mind but that in the end won’t make the top list because other areas are just more important to your organization.
Figure T.6. Sample design principle list.
8. How does it look? Check in with the group, and ask yourselves a few questions: Does the group feel that the list of design principles represents the essence of the solution they want to deliver? When a person reads the list, would he or she understand the experience you’re intending to create for your organization? Is anything major missing? Has the team been bold and challenged tradition and old thinking? Are people excited about the list and ready to move to the next step?
9. At this point, I recommend assigning one person the job of typing up the list (in priority order) and distributing it to the group. Take a night or even a day or two and reflect on the principles individually.
10. Now bring the design group back together for a final review and sign-off. And there you have them—your design principles!
Design Principle Worksheet and Sketchpad
Purpose
The following steps will allow you to sketch your performance management frame in order to create a visual representation of how your design principles relate to the Three Common Goals, test which of the Three Common Goals are emphasized most by your design principles, and discuss the interconnectedness among the Three Common Goals.
Where are we?
Tips and tricks
• Be sure your design principles are in prioritized order.
• If one of your design principles is neutral, meaning it doesn’t support one Common Goal more than another (I’m thinking something like “Make it simple”), give it a “2” for each goal.
• There is no right or wrong answer when assessing how well your design principles support each goal. The key is to use a consistent method of evaluation.
• For additional worksheets and sketchpads, visit www.thePMReboot.com.
Process
Complete the Design Principle Worksheet:
1. Write your design principles in the first column in order of priority (see figure T.7).
2. For each row, assess how well your design principle supports the common goal. I’ve added a few notes at the top of each column to trigger your thinking. Scoring is simple:
• High = 3
• Medium = 2
• Low = 1
• Not at all = 0
3. For each cell, multiply the number you’ve written (your 0–3 assessment) by the number provided in the cell. Write your answer in the shape provided.
4. Once you’ve completed each cell, add up your three columns.
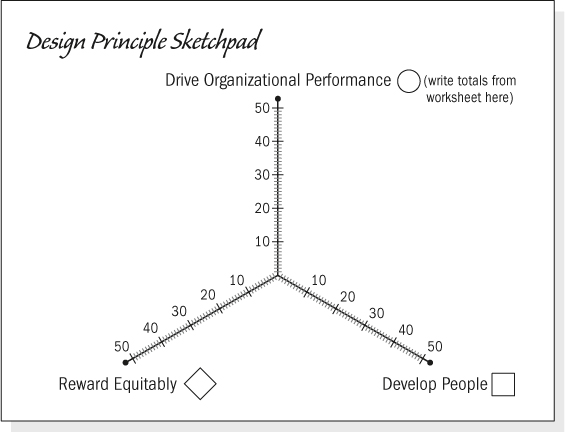
Now complete the Design Principle Sketchpad:
5. Move on to the Design Principle Sketchpad (see figure T.8) to sketch your frame.
6. Write your column totals in the corresponding shape on the sketchpad. In other words, note the number total for each of the Three Common Goals on the corresponding axis in figure T.8.
7. Graph your three points on the appropriate axis. (For example, if your total for the Develop People column was 35, you would put a mark on the Develop People axis on the spot that represents 35.)
8. Lightly sketch the connections between the three points to make a frame. To decide how thick to make each of the lines, consider how related you expect your design to be across the three goals, and complete your lines accordingly. As I explained in chapter 6, for strong connections, use a thick bold line; for light connections use a light (or dotted) line.
Discussion questions
• Does your frame represent what you expected?
• Are the right goals being emphasized?
• If you were to complete this same worksheet with your current process, what would it look like sketched out?
Figure T.7. Design Principle Worksheet.
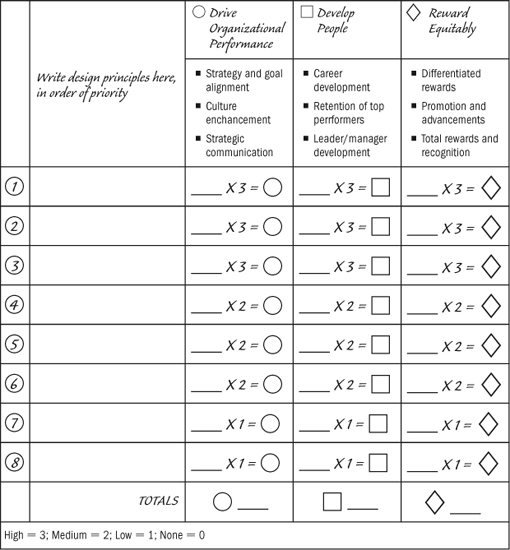
Figure T.8. Design Principle Sketchpad.
The PM Reboot Sketchbook
Purpose
This section will show you how to use the PM Reboot Sketchbook to do the following:
• Build a visual representation of your own current state and your desired state performance management frames
• Quickly check out what this is all about
• Get a few initial ideas regarding your design principles
We’ll also discuss how to use the group version of the PM Reboot Sketchbook to do the following:
• Kick off your design process with the input of each member of your design team
• Invite a broader group of people to the conversation
• Understand which design principles are most valued across a diverse team within your organization
• Test which of the Three Common Goals are most important to each member of your invited group
• Use data and visual insight to support the design conversation with the goal of building an aligned view of your design priorities
Where are we?
Tips and tricks
• HR leaders often use the group sketchbook to kick off the conversation with their executive teams.
• This is a great way to get people thinking and talking.
Process
To make your own sketch:
1. Go to www.thePMReboot.com to access the PM Reboot Sketchbook. The tool will prompt you through the following steps.
2. For each question, choose the rating that best describes your current practices. Use this simple scale: 0 = not happening here at all; 1= some people do it / sometimes; 2 = rock solid—it’s how we operate. We’ve selected these twelve questions from our larger set of current state assessment questions to give you a quick idea of your starting place.
The Sketchbook will ask you to pick from a list of “prepackaged” design principles. Your job is to simply choose your top six. (For this purpose, we created nineteen design principles that are commonly used by organizations rebooting their performance management solution. While they will definitely help you test alignment, they are not the design principles you created and therefore aren’t customized to your organization. Using your own design principles is always best!)
3. Select “generate.” It generates your current and desired state performance management frames, based on your selections.
To sketch with a group, you can use our fee-based online tool:
1. If you’re interested in inviting more people to the conversation, upgrade to the multiuser version of the PM Reboot Sketchbook. Invite the people you’d like to participate—and you’ll be off and running.
2. The Sketchbook will automatically send an email invitation to the group you’ve identified. Once they’ve completed their sketches, you’ll be able to view the results and generate summary reports.
3. The architecture of their individual performance frames will give you insights into how well your group is aligned on the design principles and common goals that they think are most important.
Discussion questions
• How aligned is the group? Does that alignment give you a solid foundation on which to begin your design conversation?
• Does your group agree on which of the Three Common Goals is most important? If not, how diverse are their opinions?
• Do you agree on your starting place? If not, why not?
• How would you write your own design principles to bring the group together?
Crowdsourcing Your Design Principles
Purpose
To show the value of crowdsourcing your design principles through an example.
Where are we?
The story
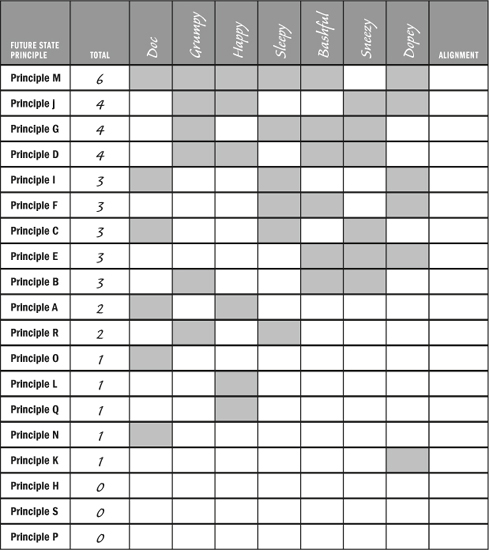
At PeopleFirm, we took a team of seven through our crowdsourcing version of the PM Reboot Sketchbook, at www.thePMReboot.com. The results of their selections are shown in figure T.9, and each column represents a participant in the conversation. This illustrates where the group is aligned and where they are not. Interestingly, only one design principle in our example here was selected by almost everyone, meaning that only one design principle had strong alignment across the group. Just one! Three design principles were not selected by anyone, and five had only one vote, which shows us that the group has a level of alignment on what’s not important to them. But that leaves ten design principles that received only two to four votes out of the seven. That’s not what I’d call alignment. Looks like there’s still some work to do!
Figure T.9. Team aggregate example.
Now that the team knew each person’s design preferences, they took the alignment assessment one step further by sketching their individual performance management frames. Just as any picture paints a thousand words, these sketches give us a visual read on how each member of our group of seven was leaning regarding the Three Common Goals: drive organizational performance, develop people, and reward equitably. These sketched representations of their design priorities allow us to compare the person-to-person similarities and differences of their PM frames.
This provides greater understanding of the participants’ selections. It is possible that several people might select different design principles and therefore not appear aligned at first glance, but when you sketch out their frames, you could find that they all support a similar agenda (such as placing more emphasis on rewarding equitably). You’ve now learned that the group is more aligned than you initially thought. In short, taking this extra step gives you greater insights into the perspectives of others, while providing a visual platform to support group discussion and alignment.
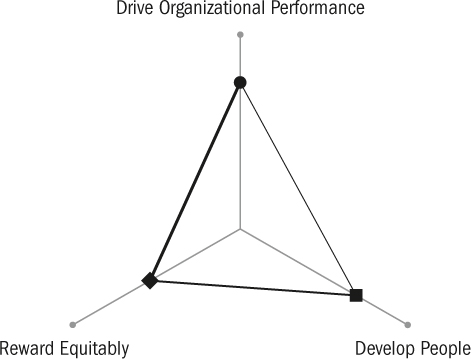
When we aggregate the responses of the seven members of this group, the collective frame looks like the sketch in figure T.10. Note that it appears to be leaning more toward drive organizational performance and develop people (you can tell because those goals are farther out along their axes).
Figure T.10. Design Principle Sketchpad.
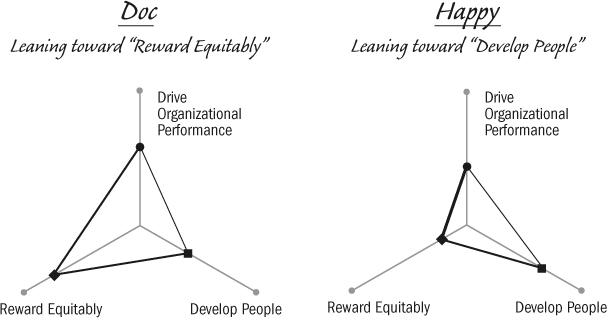
Now let’s look at a couple of individuals’ unique responses (see figure T.11). Check out the difference! Doc leans strongly toward reward equitably, while Happy does the same toward develop people. Examining individual frames gives us more insight into each participant’s view of the direction in which he or she would like to see your future solution go. In this case, we can conclude that Doc and Happy have some things to talk about before they get into the nitty-gritty design details of their PM solution.
Figure T.11. Sample team member frames.
I hope our simple online sketchbook spotlights where tradeoffs or compromises might be required across any size team. It can give you a lens into people’s thoughts and preferences in a matter of a few minutes. If nothing else, it’s sure to get people thinking and talking.
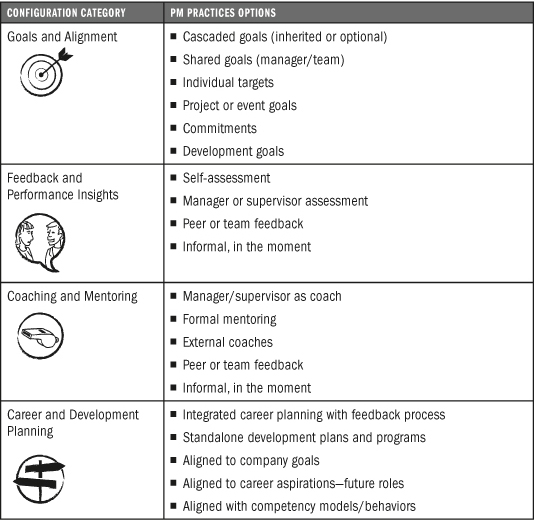
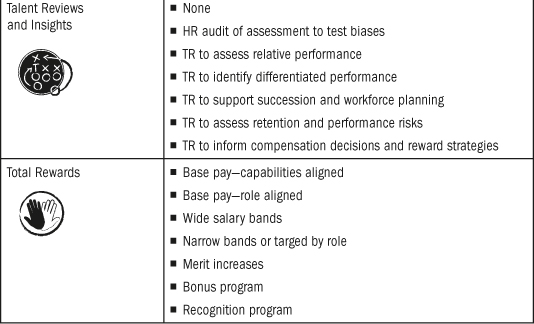
Configuration Checklist
Purpose
The Configuration Checklist is used to help you think through your options when you’re in the Configure stage. Use it to:
• Confirm the PM Practices you’ve selected
• Explore other ideas you may not have considered
Where are we?
Tips and tricks
• Feel free to pick more than one of the PM Practices for any of the configuration categories.
• Consider addressing different specific employee segments with variations in your approach.
• Check in on those practices that make up your current performance program. Get clear on if they will remain, be modified, or eliminated.
• Use this time to consider whether you’ve been bold enough with your choices.
Process
As a team, walk through each of the configuration categories. Discuss the options you’ve already chosen. Consider if you’ve missed something or would like to use a different PM Practice than the one you initially selected. These are suggestions only; use this tool to drive discussions among your team about the PM Practices that will make up your final solution (see figure T.12).
Figure T.12. Configuration Checklist.
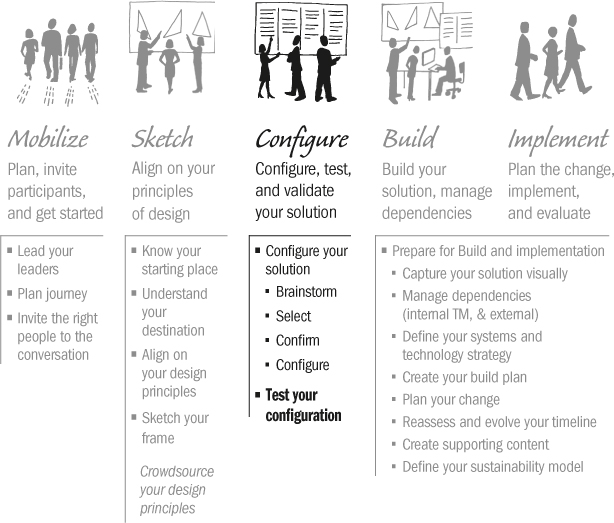
Configuration Worksheet and Sketchpad
Purpose
Re-sketch your performance management frame to test your configuration by doing the following:
• Create a visual representation of how your configured solution relates to the Three Common Goals.
• Test if you’ve stayed true to your desired architecture and areas of emphasis.
• Explore the interconnections among the Three Common Goals.
• Encourage your design team to validate their configured solution before moving forward.
Where are we?
Tips and tricks
• There is no right or wrong answer when assessing how well your design principles support each goal. The key is to use a consistent method of evaluation.
Configuration Worksheet steps:
1. Summarize your solution against the six configuration categories by writing your chosen PM Practices under the appropriate category (see figure T.13).
2. For each configuration category (row), assess how well your design is supporting the common goals. Score as you did before:
a. High = 3
b. Medium = 2
c. Low = 1
d. Not at all = 0
3. Once you’ve completed the table, add up your three columns.
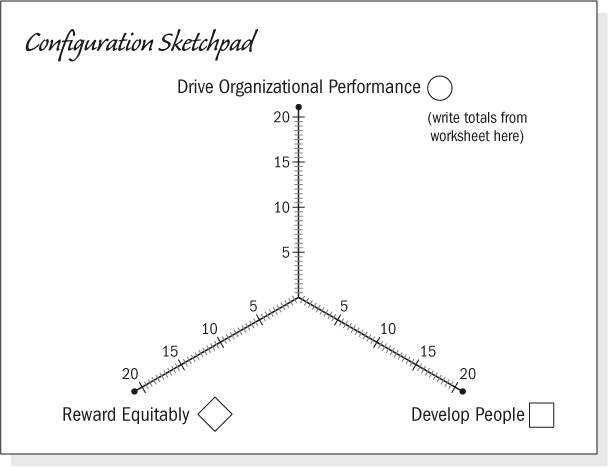
Configuration Sketchpad steps:
4. Move to the Configuration Sketchpad (see figure T.14) to sketch your frame.
5. As you did when sketching your design principles, write your column totals in the corresponding shape on the sketchpad. In other words, note the number total for each of the three goals on its corresponding axis.
6. Graph your three points on the appropriate axis.
7. Sketch in your lines based on how interconnected your solution is across the three goals. Again, for strong connections, use a thick bold line; for light connections, use a light (or dotted) line.
Discussion questions
• How do your frames compare?
• Have you stayed true to your intent?
• Have you reached far enough? Have you made bold choices that will create your desired experience for employees and managers?
• Are you happy with your solution design?
Figure T.13. Configuration Worksheet.
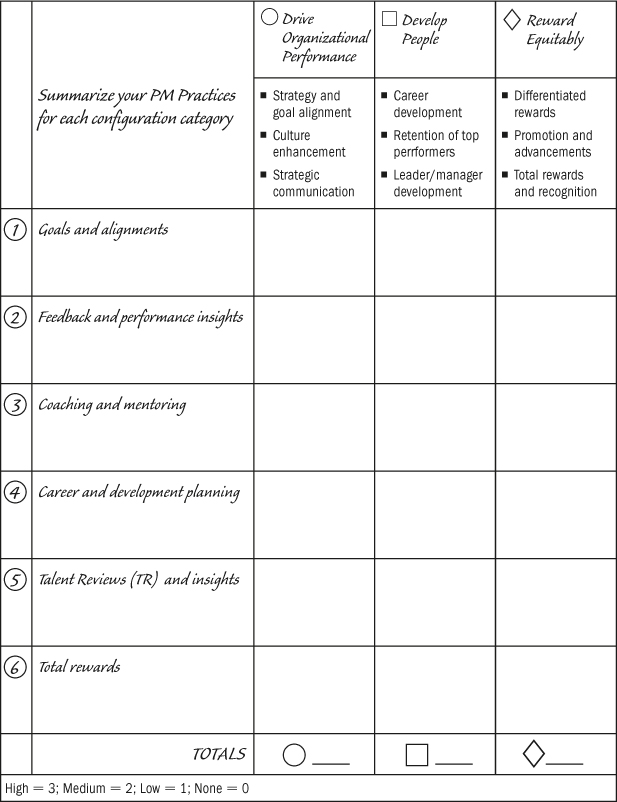
Figure T.14. Configuration Sketchpad.
Guide to Creating Your Change Plan
Purpose
Create a comprehensive change plan to guide your change management efforts. Plan how you will build awareness, understanding, and buy-in for your new PM solution across all impacted people. A great change plan considers the following questions:
• Who will be impacted by this change—your stakeholder groups?
• What is the nature of the changes that each of your stakeholder groups will experience?
• When should you engage each stakeholder group, and where do you want them along the change curve over time?
• How much support and information is needed for each stakeholder group?
Where are we?
Tips and tricks
1. When you’re creating your change plan, don’t forget that you need to share it! Typically, change plans can get pretty complex, but the last thing people will want to look at is a huge Excel spreadsheet. Rather, use visuals to show how you will move key stakeholders through the change curve. Consider creating a shareable version that fits on one sheet of paper, even if it’s a large sheet. Your object is to make the plan quick and easy to understand.
2. Stuff happens and things change, so keep it current and adapt it as needed.
Steps to create your change plan
1. Grab yourself a big piece of paper, perhaps a flip chart or a roll of butcher paper.
2. Down the left side of your paper, add the key stakeholder groups you have identified, using sticky notes. (I like to jot down the degree of impact we assessed for each group on that sticky note as well. In fact, you might want to list them by impact.)
3. Along the top of your paper, put your timeline, showing the months and weeks until you go live with your new solution. Add any notable milestones on your timeline, things like the CEO State of the Union address, completion of strategic planning for the coming year, or an upcoming busy season you want to highlight.
4. Now you need to ponder the change curve* in relationship to each of your stakeholder groups. In other words, consider where you need them to be in their change process at each point in your timeline. Recognize that everyone doesn’t need to be in the same place at the same time. Perhaps you wish to bring two groups through the curve ahead of others, such as your leaders and your HR business partners (since you need these groups with you before you go too far with the rest of the organization). Work with your design team to discuss how you might stage your approach and what areas need your greatest focus.
5. Now start adding your ideas for how you’re going to get them there. Perhaps you kick off by bringing in an external speaker to talk with your critical stakeholders. Or maybe you plan to design a campaign strategy that will build excitement and momentum over time. Midway through your plan, consider an open house to let people walk through the process and tools, ask questions, and engage in a fun and positive environment. Give lots of thought to readiness, which may be manager training, or testing elements of your design to engage and prepare people (this also gives you insights into how to make it better or easier). There are hundreds of ideas. The key is understanding whom you need to reach with what information, and what level of preparedness fits best within the constraints of time and money. When you’ve finished this exercise, you should have a good version 1 of your change plan.
6. Once you’ve got this high-level plan, then you can begin to build it out. I like to build a fairly detailed project outline that shows each activity in the change plan and notes scope, timing, audience, deliverables, success criteria, and, where possible, measurement.
* Need more information about the change curve? See “Understanding the Change Curve” at thePMReboot.com/toolkit.