
10
Estimating
Estimating is one of the more challenging aspects of managing a project; it is also one of the most important. Project managers develop estimates for effort, duration, resources, costs, and even reserve. That is a lot of estimating. Estimating for a hybrid project is even more challenging. Different development and work methods use different estimating methods. Therefore, there are a number of different techniques you can use to estimate, and because of that, there are different ways to track progress and report on project status.
In this chapter we will talk about how estimating ranges and accuracy evolve over the project life cycle. We will describe six techniques for estimating and when each technique is best used. Then we will look at how you can use cost estimates to develop a project budget.
ESTIMATING RANGES
When you are first given a project, you usually have a broad understanding of the project objectives and the desired outcomes. In some cases, you have data from similar projects that can help you estimate the cost and duration. In other situations, there is no previous historical data that you can reference, which makes the estimates more uncertain. It stands to reason that the more you understand about the scope, available resources, the nature of the work, and the environment, the more accurate your estimates will be.

FIGURE 10‐1 Range estimates over time.
To account for the uncertainty associated with estimating, we usually provide a range of estimates. At the beginning of a project, you are likely to have a larger range of estimates. For example, you may have a point estimate for the budget of $5,000,000, and a range of ±50%. This is especially true for projects that are developing new technology or using unproven processes.
As you learn more about the intended outcomes by gathering requirements, developing prototypes, and engaging in detailed planning, you can reduce the uncertainty. This may lead to a range that is ±25%. Once you have a resource loaded schedule, a risk register with risk responses, and have agreement on the scope and requirements, you may be able to reduce your range further to ±10%. Figure 10‐1 shows how a cost estimate evolves over time with the range narrowing and the point estimate going up.
For components of the project with evolving scope the sponsor (or the person funding the project) may choose to keep the budget fixed and get the most functionality for the funds allocated, or they may decide to increase the budget to get more features and functions.
ESTIMATING METHODS
There is a saying about using the right tool for the right job—that goes for estimating as well. There are numerous methods for estimating but knowing when to use each method is as important as know how to use each method. Table 10‐1 provides a brief description of each method and describes when it can best be used.
TABLE 10-1 Estimating Methods
| Method | Description | When Used |
|---|---|---|
| Analogous | Using information from previous similar projects to develop an estimate for the current project. | Most often for predictive projects. Can be used to estimate effort, duration, cost, resources, and reserve. |
| Parametric | Developing a mathematical model based on significant historical data. | Most often for predictive projects. Usually used for cost but can be used for effort, duration, resources, and reserve. |
| Multipoint | Developing optimistic, pessimistic, and most likely estimates and calculating an average or weighted average. | Most often for predictive projects. Can be used to estimate effort, duration, cost, resources, and reserve. |
| Affinity grouping | Categorizing elements into groups based on similar characteristics. | Used for adaptive projects. Most often used to estimate effort, duration, or story points. |
| Wideband Delphi | Working with a group of experts to develop individual estimates, discuss, and reestimate until consensus is reached. | Used for adaptive projects. Most often used to estimate effort, duration, or story points. |
| Bottom‐up | Summing estimates from individual work packages to arrive at an overall estimate. | Used for predictive projects. Most often used to estimate costs and aggregate them into a budget. |
The following sections provide a more detailed description of each method and an example of their application.
Analogous Estimating
Analogous estimating is the most common method of estimating. In its most basic form, analogous estimating compares past projects with the current project, determines the areas of similarity and the areas of difference, and then develops an estimate based on that information.
A more robust application determines the cost or duration drivers and analyzes the relationship between past similar projects with the current project. This can include size, complexity, risk, number of resources, weight, or whatever other aspects of the project influence your estimate.
Analogous Estimating Example
For this example, we will create an analogous estimate for developing course materials for a two‐day orientation training for Dionysus Winery employees.
The HR specialist who will be developing the materials states that she developed a similar training program for a previous employer—but that training took three days instead of two. However, this class is a bit more complex, which means it takes longer to develop the materials. The previous class had four hands‐on demonstrations as part of the class, while this one only has three.
The HR specialist checks her records and comes back with the following information.
The previous class was three days long and required 200 hours of development time. The content was relatively simple. There were four demonstrations that were part of the class. Setting up those demonstrations required an additional 40 hours.
To utilize this information to create an estimate for the winery orientation we need to apply a modifier to account for the differences. Table 10‐2 shows the information organized in a table.
Because the previous class was two days long and this class is three days long, we modify the estimate by 33%. The HR specialist indicates that the increased complexity will entail about 10% more time to create and check the content. With four demonstrations that took 40 hours to create, we can assume 25% less time for the demonstrations. Applying the modifiers to the previous class results in the modified estimate shown in Table 10‐3.
TABLE 10-2 Analogous Estimate Part 1
| Previous class | Effort (hours) | This class | Modifier |
|---|---|---|---|
| 3 days | 200 | 2 days | –33% |
| Easy | Included | Difficult | +10% |
| 4 demos | 40 | 3 demos | –25% |
| Total | 240 |
TABLE 10-3 Analogous Estimate Part 2
| Previous class | Effort (hours) | This class | Modifier | Modified estimate (hours) |
|---|---|---|---|---|
| 3 days | 200 | 2 days | –33% | 133 |
| Easy | Included | Difficult | +10% | 13 |
| 4 demos | 40 | 3 demos | –25% | 30 |
| Total | 240 | 176 |
Uses and Benefits
Analogous estimates are most commonly developed early in the project at a high level, with an expectation that the estimate will evolve and get increasingly detailed as more information is uncovered. The benefits of using analogous estimates are that they are relatively quick to develop and they're not very costly to develop. However, because they're usually done at a high level, they're not the most accurate method.
To use this method effectively, projects must be similar in fact, not just in appearance. A software upgrade may sound similar but upgrading a Windows application is not the same as updating a Word application.
Parametric Estimating
Parametric estimating uses a mathematical model to develop estimates. Not all work can be estimated this way, but when you can, it's fast and easy. You can see how to use parametric estimating for calculating effort and duration below.
- Assume the painting contractor for the winery is estimating how long it will take to paint the 26,000 square foot wine storage facility. He knows that on average it takes one hour to paint 100 square feet. He can divide the total square feet by the 100 to get the effort hours: 26,000/100 = 260 hours of effort.
- If the painting contractor has five people working on the job for eight hours per day, that equates to 40 hours of effort per day. Divide 260/40 = 6.5 days of duration.
Parametric estimating is often used in construction to get a high‐level cost per square foot estimate. When estimating the cost to build the hotel, the general contractor stated the costs would be about $225 per square foot. If the hotel has 30,000 square feet, the estimated cost would be $6,750,000.
Multipoint Estimating
Multipoint estimating is an excellent method to use with work packages that have a lot of uncertainty, risk, or unknowns. This method provides an estimated range and an expected value.
To use this method, collect three estimates based on the following scenarios.
- Optimistic: The optimistic (best‐case) scenario means that everything goes as planned. For duration estimating it means you have all your required resources, nothing goes wrong, everything works the first time, and so on. For cost estimating it means there are no price escalations, no scrap or rework, or other events that could cause the cost to go up. This is represented as an O, for “optimistic.”
- Most likely: The most likely scenario considers the realities of project life, such as someone being called away for an extended period, work interruptions, an increase in the cost of material, and so forth. This is represented as an M, for “most likely.”
- Pessimistic: The pessimistic (worst‐case) estimate assumes much rework, delays in work getting accomplished, unexpected price increases, and other issues. This is represented as a P, for “pessimistic.”
The range is between the optimistic and pessimistic estimates. The reality is that the actual duration or cost will fall somewhere between those estimates, not on the extremes. One way of using the multipoint estimate is just to calculate the average of the three estimates. A better way is to develop a weighted average where you weight the most likely scenario more than either the optimistic or pessimistic estimates. The most common equation is known as a beta distribution: ![]() . This equation weights the most likely estimate four times more than the optimistic and pessimistic estimates. The following examples show the differences between the average and the weighted average.
. This equation weights the most likely estimate four times more than the optimistic and pessimistic estimates. The following examples show the differences between the average and the weighted average.
Multipoint Estimating Examples
Assume the cement contractor is working on developing an estimate for putting in the foundation for the hotel, restaurant, and tasting room. He has experience working in the area and is familiar with the composition of the soil. He indicates that the best he can hope for is an estimate of $50,000. However, he did some work on another winery where part of the land was very unstable and had to be shored up, and other parts were sitting on granite and needed a lot more effort to get the site ready. That job cost $120,000. Based on a preliminary look around, he estimates that this job will be around $70,000.
Calculating the average, the estimate would be ![]() .
.
If you do a weighted average, the estimate would be ![]() = $75,000.
= $75,000.
In this example you can see how the difference in the most likely and the pessimistic estimate has a bigger impact when you just average the numbers. However, that variance is reduced when you give a higher weight to the most likely estimate.
Uses and Benefits
A multipoint estimate is a great method to use when there is a lot of uncertainty. It determines a range of outcomes and identifies a point estimate. While the beta distribution is the most common equation used, you can tailor the weighting to reflect whatever you think is realistic. For example, if you think there is a higher probability that things will go wrong, you can weight the pessimistic estimate more. The drawback of using this method is that it can be hard enough just getting one estimate from people—asking them to provide three may be asking a bit too much.
Affinity Grouping
This method is used on adaptive projects. It is a quick way to group user stories into similar‐size buckets. Rather than figuring out if a chunk of work will take 10 hours or 20 hours of effort, team members group work in categories that take approximately the same amount of work.
Some of the fun ways to group is by coffee cup size, dog size, t‐shirt size, or the Fibonacci sequence.
| Coffee cups | Short, Tall, Grande, Venti |
| Dog sizes | Yorkie, Spaniel, Labrador, Mastiff |
| T‐shirts | XS, S, M, L, XL |
| Fibonacci | 1, 2, 3, 5, 8, 13, 21, … |
One of the challenges with affinity grouping is that it is a form of relative estimating where each project team sets their own standard. There is no universal standard that 3 Fibonacci points = 15 hours of work, or a Labrador = 20 hours of work. The estimates are relative to the other work a specific team is doing.
Affinity Grouping Example
The release and iteration plans the team developed, shown in Figures 9‐1 and 9‐2, from the previous chapter can be decomposed into smaller chunks of work that can be estimated using affinity grouping. The team decides to use the Fibonacci sequence to estimate the work for iterations 1–3. Iteration 0 is set up, so they don't bother estimating that iteration. The team works with the product owner, Angelo Romero, to understand his needs. Once they understand what he wants, they estimate the work. Figure 10‐2 shows the following:
- The tasks needed to accomplish the work for each iteration in release 1;
- The points for each task using the Fibonacci sequence;
- The priority of the tasks.
The work is planned in such a way that the team expects to accomplish approximately 35 points per iteration. They can then update the release plan with information for each iteration in release 1, as shown in Figure 10‐3.

FIGURE 10‐2 Prioritized backlog for release 1.

FIGURE 10‐3 Updated release 1 plan.
Uses and Benefits
The benefit of this method is that after a team has worked together a while, they get very good and very fast at estimating work. The process is quicker than other estimating methods and is fairly accurate. If the team is using iterations, after a few iterations the team knows how much work they can do in each iteration. If a team using the Fibonacci sequence consistently delivers about 35 story points of work in an iteration and a release has approximately 130 story points, they can release in 4 iterations.
Wideband Delphi
Wideband Delphi is similar to relative estimating, but it uses a group of experts (usually the team members) to develop the estimates. There may be several rounds of estimating before there is a general consensus on the estimate.
Planning poker is a common form of wideband Delphi. In planning poker, each person has a set of cards with each card having one of the Fibonacci sequence numbers on them: 1, 1, 2, 3, 5, 8, 13, and so forth. A facilitator keeps the group focused and moving forward. A product owner gives a brief description of the backlog item, and the team has the opportunity to ask questions to gain clarification about assumptions and risks. Then the facilitator asks the team to pick their estimate from their set of cards. At the same moment everyone flips their card over.
If there is consensus about the work, the team moves on to the next element of work. If not, the outliers (those with significantly higher or lower cards) are given time to discuss why they rated the work that way. Figure 10‐4 shows an example of a set of cards with an outlier.
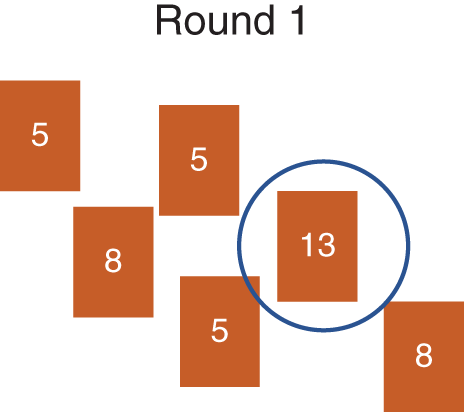
FIGURE 10‐4 Wideband Delphi with outlier.

FIGURE 10‐5 Wideband Delphi with rough consensus.
After the discussion there is another vote. This continues until all numbers are within one card ranking of each other, as show in Figure 10‐5.
If there is a rough consensus, such as three votes of 5 and three of 8, the larger number is chosen.
Bottom‐Up Estimating
Bottom‐up estimating aggregates the detailed estimates from each activity to determine the overall total. This type of estimating is more common in cost estimating, but the same concept can be used in estimating effort as long as you take the network diagram sequence into consideration.
The benefit of this method is that it is usually very accurate. However, it is time consuming because you have to have a detailed understanding of the work. Therefore, you only know the bottom‐up estimate after you have fully decomposed scope and are ready to baseline. Hence, it is not used with Agile projects since the scope evolves.
Basis of Estimates
Once you have developed your estimates, it is a good practice to document your basis of estimates. The basis of estimates provides supporting detail about the estimate. It demonstrates transparency about how the estimate was developed and any factors that influenced the estimate. Common elements when documenting the basis of estimates include:
- How the estimate was developed;
- Assumptions and constraints associated with the work and the estimate;
- The range of estimates;
- The confidence level in the estimate;
- Risks that affect the estimate.
On smaller projects this information may be included in the notes. For larger projects you will want to include more robust documentation. It is worthwhile to note that a change to assumptions or constraints for the estimate usually results in a change in the estimate. For example, if you assume a system engineer contractor will be available for four months and will cost $150 per hour, and then you find out there are no local system engineers available and the best option you can find is $180 per hour, you will have a variance. Your original assumption was not accurate, and therefore your estimate will go up.
ESTIMATING THE BUDGET
Of the estimating methods described previously, analogous, parametric, multipoint, and bottom‐up are the methods used for cost estimating. Once you have your cost estimates, you can build a project budget. A budget is a time‐phased estimate of costs. You can build a budget for a work package, control account, deliverable, phase, or the project as a whole. You can see how to use the cost and duration estimates for the foundation work package for the winery. The foundation work package has these tasks.
- 1.2.1.2. Foundation
- 1.2.1.2.1. Excavate
- 1.2.1.2.2. Grade
- 1.2.1.2.3. Install footings
- 1.2.1.2.4. Place forms
- 1.2.1.2.5. Install rebar
- 1.2.1.2.6. Pour concrete
The network diagram with weeks across the top is shown in Figure 10‐6.
The concrete contractor gave you the following estimates that he developed using the bottom‐up method. He estimated the hours, the hourly rate, the cost of materials, and the cost of using the equipment.
| Foundation | $42,700 |
|---|---|
| Excavate | $12,000 |
| Grade | $ 8,200 |
| Install footings | $ 2,500 |
| Place forms | $ 3,100 |
| Install rebar | $ 6,700 |
| Pour concrete | $10,500 |

FIGURE 10‐6 Foundation work package network diagram.
TABLE 10-4 Budget Worksheet for the Foundation
| Foundation | Week 1 | Week 2 | Week 3 | Week 4 |
|---|---|---|---|---|
| Excavate | 12,000 | |||
| Grade | 8,200 | |||
| Install footings | 2,500 | |||
| Place forms | 3,100 | |||
| Install rebar | 6,700 | |||
| Pour concrete | 10,200 | |||
| Cost per week | 12,000 | 8,200 | 5,600 | 16,900 |
| Cumulative cost | 12,000 | 20,200 | 25,800 | 42,700 |
Using the network diagram and the cost estimates you can use a spreadsheet to build a budget for the work package by showing the costs over time. Table 10‐4 shows the tasks down the left‐hand column and the weeks across the top row.

FIGURE 10‐7 Budget chart for the foundation.
Notice that the second‐to‐bottom row shows the cost per week. The bottom row shows the cumulative cost. You derive the cumulative cost by adding the previous week's cumulative cost to the current week's cost per week.
To show the budget as a chart, select the data and insert a line chart, like the one shown in Figure 10-7.
By developing the budget this way, you will be able to analyze your costs for each deliverable and for each time period.
SUMMARY
In this chapter we discussed how the range of an estimate gets narrower as more information is known about the project. We described and demonstrated six ways to estimate effort, duration, resources, and costs. Analogous, parametric, multipoint, and bottom‐up are typically used for predictive work. Affinity grouping and wideband Delphi are used for adaptive work.
Using the cost estimates you can build a budget to show the time‐phased cost of work. To build a budget you list the work in a column—depending on the level of detail, this may be tasks, work packages, or deliverables. Then arrange them in a network diagram over time. Enter the estimate for each element of work in the corresponding cell. Sum the cost for each time period, and then calculate a cumulative cost on the bottom row. When that is done, you can turn the data into a chart to show the time‐phased budget.
Key Terms
- affinity grouping
- analogous estimating
- bottom‐up estimating
- budget
- Fibonacci sequence
- multipoint estimating
- parametric estimating
- point estimate
- wideband Delphi