
20
Metrics for Adaptive Deliverables
Teams that work with adaptive deliverables focus on efficiency. The metrics they use track velocity, the time it takes to get a new feature developed, and estimates for the future rate of work.
In this chapter we'll look at how to use burn charts to estimate the amount of work a team can get done in an iteration, and we'll look at how to estimate a team's rate of work (velocity). Then we'll show how a cumulative flow diagram can identify bottlenecks in a process, show how long the team is working on new features, and indicate how long customers have to wait before their requests are fulfilled.
Agile projects often use measures to evaluate stakeholder satisfaction. We will look at how these measures can be used on any project and why they are definitely useful for hybrid projects.
ADAPTIVE MEASURES
Agile teams focus on increasing efficiency, throughput, and velocity. Noting that defects and rework take time to fix, they are also focusing on how to improve their work process to decrease defects. We'll describe four charts that are commonly used to plan and track progress for Agile deliverables, burndown charts, burnup charts, charts to estimate velocity, and a cumulative flow diagram.

FIGURE 20‐1 Burndown chart.
Burndown Charts
A burndown chart shows the work and an estimated completion rate. The team then tracks the actual work completed against the target completion. The burndown chart in Figure 20‐1 shows information for a team that is using story points to estimate work. Their iterations (sprints) are one week in duration. They have 125 story points they need to accomplish. They estimate that they can accomplish nine story points per iteration.
The dashed line represents the target story points; you can see how it goes down by nine points each iteration. That is the target the team is working toward. The line at the bottom shows the work that has been accepted by the product owner each iteration. The solid line shows the actual work completed. This is the difference between the 125 points and the work that has been accepted so far. When the solid line is above the dashed line, the team is behind schedule.
This type of chart can be created on a flip chart, and the progress is charted at the end of each iteration. This is known as a low‐tech, high‐touch tool. In other words, it is just paper and marker (low tech) that is kept up to date by manually updating information (high touch).
You can also create this type of tool in a spreadsheet, such as Excel, and keep it on a team collaboration site if the team works remotely. To create this type of tool in a spreadsheet, follow these steps.
Create the following columns:
- Iteration: If you aren't working with iterations, you can use time, such as days, weeks, or months. This is shown along the bottom of Figure 20-1.
- Target: This is the amount of work you expect to accomplish in each time period. This is also known as target velocity. This is not shown in Figure 20-1; it was hidden to simplify the chart.
- Accepted work: This is the point value of the work the product owner accepts as complete. This is shown as the line along the bottom of Figure 20-1.
- Target story points remaining: To get this number start with the total number of story points, in this case 125, in the first row (the first row is iteration 0). Then subtract the target work for the first iteration to get the estimated story points remaining at the end of the first iteration. This is the dotted line in Figure 20-1.
- Actual story points remaining: This is the total number of story points (entered in iteration 0) minus the accepted work. This is the decreasing solid line in Figure 20-1.
Table 20‐1 shows the what the table looks like before inserting a line chart.
TABLE 20-1 Burndown Chart Table
| Iteration | Target | Accepted work | Est. story points remaining | Act. story points remaining |
|---|---|---|---|---|
| 0 | 0 | 0 | 125 | 125 |
| 1 | 9 | 7 | 116 | 118 |
| 2 | 9 | 9 | 107 | 109 |
| 3 | 9 | 10 | 98 | 99 |
| 4 | 9 | 8 | 89 | 91 |
| 5 | 9 | 7 | 80 | 84 |
| 6 | 9 | 8 | 71 | 76 |
| 7 | 9 | 9 | 62 | 67 |
| 8 | 9 | 10 | 53 | 57 |
| 9 | 9 | 7 | 44 | 50 |
| 10 | 9 | 35 | ||
| 11 | 9 | 26 | ||
| 12 | 9 | 17 | ||
| 13 | 9 | 8 | ||
| 14 | 9 | ‐1 |
One of the problems with a burndown chart is that if someone adds a new feature, it looks like the team's velocity slowed down, because there are more estimating remaining story points. To accommodate that, it might be better to use a burnup chart instead.
Burnup Charts
As you can see in Table 20‐2, a burnup chart mostly uses the same information as a burndown chart, but instead of tracking the work remaining, it tracks the work accomplished. Here is the table for a burnup chart; notice that the column for the total story points stays the same, but you can see at iteration 6, 10 story points worth of work was added, and at iteration 8, another 5 story points were added.
TABLE 20-2 Burnup Chart Table
| Iteration | Total story points | Target work | Target work accepted | Accepted work | Actual work accepted |
|---|---|---|---|---|---|
| 0 | 125 | 0 | 0 | 0 | 0 |
| 1 | 125 | 9 | 9 | 7 | 7 |
| 2 | 125 | 9 | 18 | 9 | 16 |
| 3 | 125 | 9 | 27 | 10 | 26 |
| 4 | 125 | 9 | 36 | 8 | 34 |
| 5 | 125 | 9 | 45 | 7 | 41 |
| 6 | 135 | 9 | 54 | 8 | 49 |
| 7 | 135 | 9 | 63 | 9 | 58 |
| 8 | 140 | 9 | 72 | 10 | 68 |
| 9 | 140 | 9 | 81 | ||
| 10 | 140 | 9 | 90 | ||
| 11 | 140 | 9 | 99 | ||
| 12 | 140 | 9 | 108 | ||
| 13 | 140 | 9 | 117 | ||
| 14 | 140 | 9 | 126 | ||
| 15 | 140 | 9 | 135 | ||
| 16 | 140 | 9 | 144 |

FIGURE 20‐2 Burnup chart with change in scope.
Figure 20‐2 shows how the chart looks. You can see the top line that represents the total story points line goes up in conjunction with the total story points column in Table 20‐2.
Burnup charts provide a quick answer to the “When will it be done?” question by looking at the current rate of work compared to the target rate and forecasting the completion date given the team's velocity and the remaining work.
Estimating Velocity
Velocity is the team's rate of work in a fixed time period, such as an iteration. It is used in planning and estimating as you saw with the burndown and burnup charts. It usually takes a few iterations for velocity to stabilize while the team gets familiar with the project, with each other, and figures out the best way to accomplish work. Once the team has worked together for a few iterations, it is relatively easy to estimate velocity for future sprints, and thus this is a great tool for forecasting how much work can be done in each iteration and the completion dates for releases.
Figure 20‐3 shows a chart with rather uneven velocity in the first four iterations. Starting in iteration 5 they started tracking their average velocity, shown as the line. This shows that their velocity has averaged out to about 9 story points per iteration.

FIGURE 20‐3 Velocity Chart.
CUMULATIVE FLOW DIAGRAMS
One of the principles for Agile teams is “Deliver working software frequently, from a couple of weeks to a couple of months, with a preference to the shorter time scale.” To align with this principle, teams focus on increasing amount of work they can get done in a period of time, also known as throughput. They do this by limiting the work in progress so as not to create bottlenecks in the flow of work, by improving their work processes to decrease defects and increase the work done, and by reflecting on how to become more effective.
A cumulative flow diagram helps visualize the flow of work. It shows the work in progress, the time it takes a task to get through the entire process from request to deployment (known as lead time), and the time work spends in a part of the process, such as development or testing (known as cycle time).
Figure 20‐4 shows a cumulative flow diagram for building the wine club website. The time is across the horizontal axis and the story points are on the vertical axis.

FIGURE 20‐4 Cumulative flow diagram for the wine club website.
You can see the amount of work waiting to start is represented as the to‐do work. Some work is in the “doing” section, some in the “testing” section, and some is done. To maintain a smooth flow of work, you want the work in the doing and testing sections to remain consistent. You can see around week 3 it looks like there is a bit of a bottleneck in the testing process. This is due to more work being started than there was work being tested. Figure 20‐5 shows the same diagram with annotations to explain how to interpret the chart.

FIGURE 20‐5 Cumulative flow diagram with annotations.
Note the following:
- The backlog size is diminishing over time.
- The work in process (WIP) at any given point in time is composed of the number of story points in doing and testing.
- The cycle time is how long work spends in the doing and testing processes. The average is a little longer than two weeks in this example.
- The remaining work is composed of the to‐do, doing, and testing processes.
- The amount of work that is done increases over time.
As you can see, there is a lot of information in this one chart.
Creating a Cumulative Flow Diagram
A cumulative flow diagram is useful but a little tricky to create. I'll show you how I created the chart for creating a website for the wine club members for the Dionysus Winery.
You start by get the data you will need for the chart from the task board. This example assumes you are using story points, but you can use duration estimates as well. Figure 20‐6 shows the story points for 20 user stories that make up the work necessary to create a wine club member website.

FIGURE 20‐6 Initial Task Board.
This shows there is 100 points worth of work to create the website. To create the cumulative flow diagram, you start with creating a table to enter in data.
- First, create five columns. The first column will represent time. Enter in the time periods you are using. For this example, we assume each iteration is one week. Make sure to start with week 0 or iteration 0. This allows you to show the total number of points. Also make sure to enter words (week 0, sprint 0, etc.) so Excel doesn't think these are numbers it needs to track.
- The next columns will reflect the columns for the task board, in this case, to do, doing, testing, and done.
- Enter the total amount of work that needs to be done under week 0, to do. At this point the table should look like Table 20‐3.
- Throughout the project you will track the work that moves from the backlog (to do) into the doing column, then testing, and then done. Table 20‐4 shows the data from the task board through week 4 and Figure 20‐7 shows what the task board would look like at week 4.
- To create the chart, select all the rows with data in them. Then go to the “Insert” menu and select a “Stacked Area” chart. In Excel you will find this under the “Line” group of charts. At first the chart looks like Figure 20‐8. This is not particularly useful.
- To format the chart to provide useful information right‐click on the chart and choose “Select Data.” When you do that, a “Select Data Source” box comes up. First, switch the row and columns. This will send the weeks to the bottom.
- Next, reverse the order of the data. You can do that by selecting the legend entry and then clicking the up or down arrows to rearrange the data. Now the “to do” category is on bottom, then “doing,” “testing,” and “done” at the top. Once you have done that your diagram should look like Figure 20‐9.
TABLE 20‐3 Initial Cumulative Flow Diagram Table
| Time | To do | Doing | Testing | Done |
|---|---|---|---|---|
| Week 0 | 100 | |||
| Week 1 | ||||
| Week 2 | ||||
| Week 3 | ||||
| Week 4 |
TABLE 20‐4 Week 4 Cumulative Flow Diagram Table
| Time | To do | Doing | Testing | Done |
|---|---|---|---|---|
| Week 0 | 100 | 0 | 0 | 0 |
| Week 1 | 82 | 18 | 0 | 0 |
| Week 2 | 69 | 13 | 18 | 0 |
| Week 3 | 46 | 23 | 13 | 18 |
| Week 4 | 33 | 26 | 18 | 23 |

FIGURE 20‐7 Task board at week 4.
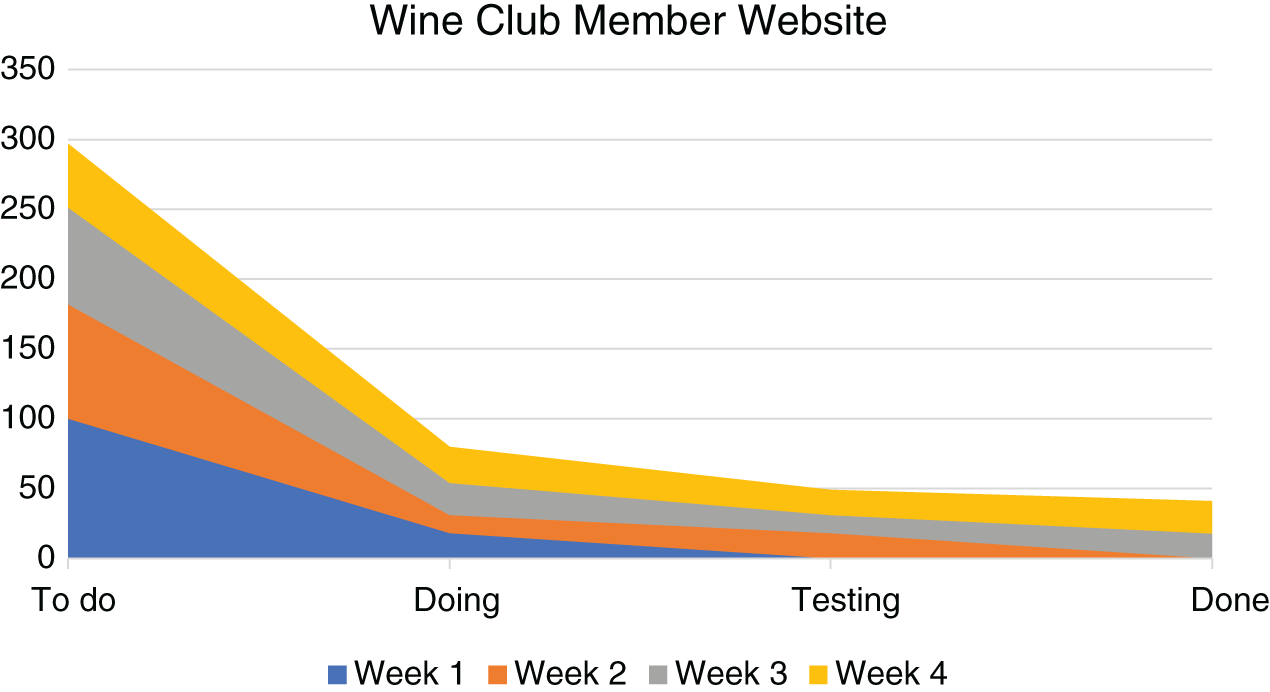
FIGURE 20‐8 Initial Wine Club Member Website Cumulative Flow Diagram Week 4.

FIGURE 20‐9 Updated Wine Club Member Website Cumulative Flow Diagram Week 4.
This cumulative flow diagram gives a much better picture of the team's workflow.
STAKEHOLDER MEASURES
A lot of project measures deal with information that is easy to quantify, like schedule and cost variances. But there are some really important metrics that have to do with your team and your stakeholders. We'll look at two of these measures, a Net Promoter Score® and a mood chart.
Net Promoter Score®
A Net Promoter Score® measures customer satisfaction, but more importantly it measures how likely a customer is to refer someone else to use your product. Many hybrid projects have a digital component. Sometimes that component is for internal customers, and sometimes it is for consumers. The Net Promoter Score® is determined by asking stakeholders one simple question, “On a scale of 1–10, how likely are you to recommend this (product/service/company) to someone else?” The responses are usually categorized as:
- Promoters: These people indicated a score of 9–10. This indicates an enthusiastic supporter who will share their positive experience with others.
- Passives: These people scored the product or service as 7–8, indicating they are satisfied customers but not necessarily enthusiastic customers. Given a better option, these customers may choose a competitor.
- Detractors: A score of 1–6 indicates dissatisfied customers. These people may spread negative opinions about their experience.
To develop the Net Promoter Score®, you determine the percent of people who are promoters and the percent who are detractors. Then subtract the percent of detractors from the percent of promoters. Theoretically, this leads to a range of 100% if every respondent were a promoter and −100% if every respondent were a detractor. Obviously, the higher the score, the better the outcome. It is useful to track this measurement periodically to see if your product or service is improving or deteriorating.
Mood Chart
Your team is your most valuable resource, so you want to make sure they are happy, or at least satisfied. One way to assess team attitude is to use a mood chart. A mood chart lets people show you how they feel, and it is low tech and can be fun as well. Most people use emojis for a mood chart, but you can use colors or numbers as well.
You simply ask your team members to draw an emoji that reflects their mood. You can ask them to fill it in daily, weekly, or whenever you think it is important to get a sense of your team's attitude. Figure 20‐10 shows a mood chart using emojis.

FIGURE 20‐10 Mood chart.
Another way to check in with your team is to send out a quick survey asking them to use a scale of 1–5 to indicate how much they agree with statements such as:
- I feel appreciated;
- I think my work makes a difference;
- I enjoy working with my team.
Collecting information on team member and customer satisfaction is usually done through questionnaires, surveys, interviews, and conversations. While this type of data is more subjective than cost and schedule variances, it provides excellent information to evaluate how well the team is doing.
SUMMARY
In this chapter we looked at four charts to track progress for adaptive work. We looked at burndown and burnup charts, which compare target work to actual work. We used a bar chart over time to estimate the team's velocity. We also looked at a cumulative flow diagram to look at the flow of work through the categories on a task board. We can use this to identify bottlenecks, lead time, and cycle time. We wrapped up this chapter by looking at two stakeholder measures, a Net Promoter Score® and a mood chart.
Key Terms
- burndown chart
- burnup chart
- cumulative flow diagram
- cycle time
- lead time
- mood chart
- Net Promoter Score®
- velocity