

Scenario: How to use the solution
Now that you understand the basic implementation procedures of the hardware and the software that are used to build an IBM analytics environment, we describe how to use them.
This chapter shows a sample use case that applies twitter sentiment analysis to a traditional data warehouse dashboard to generate retail offers for users on demand.
This chapter shows the result that you can get through this sample case. The chapter shows the benefit that you can receive from this solution. Then, the chapter describes the concept of this sample case from the data’s point of view. The chapter describes the steps to implement the sample case in your environment.
This chapter covers the following topics:
6.1 Dashboard and reporting analysis
This section explains the results that you can get if you implement this sample solution in your environment.
This section covers the following topics:
6.1.1 View of BigInsights
This section provides a brief view of BigInsights with data that is retrieved from Twitter.
Retrieved data from Twitter
Figure 6-1 shows the sample query results against data that is retrieved and stored from Twitter to BigInsights.

Figure 6-1 Sample result: IBM BigInsights Data Server Manager for Big SQL
6.1.2 View of Cognos Business Intelligence
This section provides a view of Cognos Business Intelligence.
Executive workspace (dashboard)
The executive workspace is the sample executive dashboard of Cognos Business Intelligence. You can create this dashboard in your environment by following this demonstration use case.
The dashboard that is created for executives contains four workspace reports (Figure 6-2).

Figure 6-2 Sample view: Executive dashboard in Cognos Connection
Each workspace report in the dashboard is described.
Chart 1
Chart 1 is in the upper-left corner of Figure 6-2. This chart shows revenue trends for each product line, by each quote, from 2010 Q1 to 2013 Q4. You can drill down to see the trend of related product types or product names if you select each product line in same chart of this report.
The original workspace report is shown in Figure 6-3.

Figure 6-3 Sample result: Workspace report before you drill down
You can see the details by drilling down on figures in the chart. This example drilled down against the product line of personal accessories to show related product types. (To check what is shown in the chart, see the report name that is highlighted by the red rectangle, as shown in Figure 6-3 and Figure 6-4 on page 193).
Figure 6-4 shows the personal accessories report.

Figure 6-4 Workspace report drilling down from product line to the product type of personal accessories
Chart 2
Chart 2 is in the upper-right corner in Figure 6-2 on page 191. The cross tab shows the accurate revenue amount for each product line by each year (Figure 6-5). You can also drill down to see the related product types or product names if you click each product line in the cross tabulation (crosstab or cross table).

Figure 6-5 Sample result: Crosstab sample of revenue by each product line
Chart 3
Chart 3 is in the lower-left corner of Figure 6-2 on page 191. The color on the map shows the annual gross profit for each country (Figure 6-6). You can drill down for more details about each country’s data.

Figure 6-6 Sample result: Dynamic map of gross profit by country
Chart 4
Chart 4 is in the lower-right corner of Figure 6-2 on page 191. Chart 4 is a combination chart. It includes a bar chart, which shows the annual product line revenue data from the traditional data warehouse. The dots show the Twitter polarity (positive/negative counts) for each product line. Figure 6-7 shows the differences between the number of negative and positive tweets for each product line.

Figure 6-7 Sample result: Sentiment analysis that is applied to a traditional data warehouse
6.1.3 View of IBM SPSS Analytical Decision Management
This section explains the sample project scenario that is scored by IBM Statistical Package for the Social Sciences (SPSS) Analytical Decision Management. It also has a feature to compare multiple scored scenarios to select the most suitable scenario for your requirements. The most profitable and effective scenario for the offerings of your campaign under your set conditions are shown in Figure 6-8.

Figure 6-8 Sample result: Home page of a project
6.1.4 Customer experience: Online shop
The fictional sample company Great Outdoors Co., Ltd has an online shop. Figure 6-9 shows the home page for its shop. The scenario sets a common home page for all customers. Then, it sets the individual pages for each online shop customer after the customer logs in to their account.

Figure 6-9 Sample result: Home page of “Great Outdoors Co., Ltd” online shop before customer login
Two scenarios are shown. In the first scenario, no campaign is offered. In the second scenario, a campaign is offered. The scenarios are described:
•The customer experience 1: Campaign not offered
After the correct configuration to the web application in the application server is published, it can retrieve the scoring result automatically from SPSS Analytical Decision Management and identify the campaign offer to display at the user login. On this page, no campaign offer is displayed. If a customer is not offered a campaign, the customer sees a web page after they log in to the online shop website, as shown in Figure 6-10.

Figure 6-10 Online shop page for the customers who are not offered a campaign
•Customer experience 2: Campaign offered
If the customer is offered a campaign, the customer sees the campaign information after they log in to the online shop website, as shown in Figure 6-11. The campaign information is shown according to the scenario that was scored by SPSS Analytical Decision Management based on the customer’s geographical information, the result of twitter sentiment analysis, and the customer’s banking status.

Figure 6-11 Online shop page for customers who are offered a campaign
6.2 Type of analysis
This section explains the benefits of the implemented solution.
This section covers the following topics:
6.2.1 Cognos Business Intelligence advantages
This implementation offers the following advantages:
•Applies the correct security to a confidential report automatically based on the user’s information about the security provider. (This case uses OpenLDAP as the security provider.)
•Retrieves unstructured data from BigInsights through Big SQL in addition to the traditional structured data in the data warehouse
•Uses the DB2 Java Database Connectivity (JDBC) driver to set the data source definition of Big SQL in Cognos Administration
•Displays data both from structured and unstructured databases in the same report (for example, charts and lists)
•Shows sentiment analysis results and traditional data warehouse data in the same report object (for example, charts and list)
•Enables the user to drill down to see detailed data on demand
•Enables the user to check the latest data whenever the user executes a report
6.2.2 SPSS Analytical Decision Management advantages
The advantages of this implementation are shown:
•Simulates profitable and productive scenario offering campaigns for customers that Cognos cannot simulate by itself.
•Enables the user to compare multiple scenarios that are scored in one project.
•Enables the user to import created models to the project.
•Enables the user to create models to forecast data that fits to rules and conditions that you set in the project.
•Helps a web application to display campaign offers automatically to a customer’s home page after the customer logs in to the online shop. The offering is provided by the scoring result that is based on the user’s geographical and demographic data.
6.3 Combinations and correlations of structured and unstructured data types
This section describes how to implement sample cases in your environment.
This section covers the following topics:
6.3.1 Sample case goal
In this sample case, the goal is for you to perform similar operations that are explained in the “Using Twitter sentiment from Hadoop to generate retail offers” video, which is implemented on IBM POWER8:
|
Note: Our scenario implements a later version of the product version than the version that is shown in the demonstration. The numbers that are displayed and the user interfaces of each product vary based on the product version. Therefore, several views in this sample case differ from the demonstration.
|
6.3.2 Story of this sample case
This section describes the sample case scenario.
About the sample case
Cognos examples were designed for the sample company Great Outdoors Co., Ltd. These samples were included originally to give a good description of the product features and preferred practices from both the business and technical views. Three types of people (executives, IT staff, and researcher) are described in this demonstration. Table 6-1 shows the roles of these people in this demonstration.
Table 6-1 List of each user and the user’s role in each product
|
User
|
Cognos Business Intelligence
|
Analytical Decision Management or Collaboration and Deployment Service
|
Online shop
|
|
Executives
|
•The executives log in to Cognos Business Intelligence portal.
•The executives open the executive dashboard.
|
They do not use this product.
|
They do not use this product.
|
|
IT staff
|
•The IT staff creates the executive dashboard.
•Applies security.
|
The IT staff configures the scoring service1.
|
The IT staff applies the configuration to deliver a score from Analytical Decision Management to the web application on the application server.
|
|
Researcher
|
The researcher does not use this product.
|
The researcher creates the project to find the most effective and profitable campaign scenario2.
|
The researcher does not use this product.
|
1 This operation occurs in Deployment Manager in the Windows client of Collaboration and Deployment Service.
2 This operation occurs in SPSS Analytical Decision Management.
Story
This section describes the story of the people who are involved in this sample case.
The IT staff applied security to all of the Cognos Business Intelligence. They also applied additional security to the executive dashboard so that only executives can see it by using employee user information that is stored in the security provider. OpenLDAP was implemented for the security provider. The IT staff modified the web application to display campaign information automatically to target the customer’s page based on the scenario that was scored by the Analytical Decision Management tool.
The executives open the confidential financial dashboard to check the company’s confidential financial status. This dashboard is displayed to executives only. From revenue by product and year, in the executive dashboard, the 2013 revenue of all of the product lines is lower than the revenue of 2012. Executives want to improve this situation. For example, the product line that is named Personal Accessories has the largest revenue and most positive tweets but it also has the most negative tweets (from Chart 4 on the executive dashboard on Cognos Connection that is shown in Figure 6-7 on page 194). Then, executives can decide to perform campaigns against customers who posted positive twitter feedback and have good financial status.
The researcher works with Analytical Decision Management to identify the customers to whom the company needs to offer campaigns and to identify the most effective and profitable way to communicate offers.
6.3.3 How to score and deploy the scenario
Four steps are involved to score and deploy the scenario in the online web page:
1. Prepare the data source.
2. Create the model.
3. Create the project.
4. Apply the scenario to the online shop.
Prepare the data source
The researcher creates the input data that contains the individual’s demographic data (such as gender and age from the bank_response_data.txt file), banking payment status, and sentiment polarity (such as Has Bad Payment Record and Sentiment Polarity Tweeted product from the bank_customer_data.txt file).
For the tweets about products by customers of Great Outdoors Co., Ltd, we retrieved the data from Twitter and then stored it in BigInsights for this case. Also, we can select and display customized data by using SQL in BigInsights.
Create the model
The researcher creates the model to receive the propensity score of the response that is in the bank_response_data.txt file. In this step, we create the model on SPSS Analytical Decision Management so that its user interface enables people with insufficient knowledge about the analytics of SPSS Modeler to create a model that fits this scenario. The Modeler Advantage application offers this feature.
The scored result is used to set the prioritization parameters of the SPSS Analytical Decision Management for Customer Interactions application. The scored value tells the expected reaction ratio from customers by the company’s campaign or offers. This value is calculated from the bank_response_data.txt file and not from the bank_customer_data.txt file that is the data source of SPSS Analytical Decision Management for Customer Interactions.
Create the project
The researcher works with Analytical Decision Management to identify the best scenario that will predict the most effective expected profit:
•Outline
This task creates the application on SPSS Analytical Decision Management. For this sample case, select the application type of Analytical Decision Management for Customer Interactions to create a project for scoring scenarios. Scenarios are scored with the conditions and rules that you set in the project. This scoring identifies the best offers and delivers recommendations to the website in real time. The company uses this scoring when it wants to increase customer retention and overall profits through several overlapping marketing campaigns.
•Conditions and rules in the project
SPSS Analytical Decision Management scores the expected profit when campaigns are performed effectively with your specific conditions and rules in each project. Great Outdoors Co., Ltd offers campaigns under the following conditions that were scored by Analytical Decision Management to achieve profitable results. Also, the company wants to display the campaign detailed information in the online shop for each user’s home page after the login with following conditions (Table 6-2):
– The customer who posted tweets on the Personal Accessories product line.
– The customer with one of the following four rules:
• Watch campaign for male retention
• Sunglasses campaign for female retention for customers who live in Miami and posted positive tweets
• Great Outdoors Credit Card campaigns for cross-sell to customers who own a house
• Travel with Outdoors campaigns for cross-sell to customers in good financial standing
Table 6-2 Sample configuration: Campaign and offering types by target customers
|
Types of campaign
|
Offers
|
Target customers
|
|
Retention
|
30 percent off on Sunglasses
|
Male retention
|
|
30 percent off on Watches
|
Female retention for customers who live in Miami and posted positive tweets
|
|
|
Cross-sell
|
Great Outdoors Credit Card
|
Cross-sell to customer who owns a house
|
|
Travel with Outdoors
|
Cross-sell to customer in good financial standing
|
Required operations in SPSS Analytical Decision Management
This section describes the concept and outline of the tasks to identify the effective scenario in SPSS Analytical Decision Management. To complete this implementation, you need to configure the items in the following list:
•Data tab
•Global selections tab
•Define tab
•Prioritize tab
•Deploy tab
We describe the configurations for each of the items in the preceding list:
•Data tab: This feature is used to load data for the simulation. In this sample case, the data source was loaded. The bank_customer_data.txt file includes the user information, polarity, and products that are mentioned in the tweets.
•Global selections tab: This feature is used to select the customers that receive a campaign or offers. In this section, select the users that satisfy both of the following rules:
– Excludes the user with one of the following conditions:
• “Has Bad Payment Record” = Yes (in rule 1 = Yes)
• Received a campaign offer within eight weeks
– Includes a user who posted tweeter comments or comments through twitter on the Personal Accessories product line
•Define tab: This feature is used to set the offers to allocate to customers and the conditions on which offers are delivered to customers:
– Retention campaign: To all of the sales transactions after 2012-03-22 02:35:30, the researcher tries to apply the following rules. The researcher decided to apply the campaigns to the first and second largest revenue products in the Personal Accessories product line (products with the largest revenue by product type (Figure 6-12)):
• First largest product line: Eyewear
• Second largest product line: Watches

Figure 6-12 Amount of polarity (sentiment analysis) of Twitter and revenue by each product line
– The company decided to check the scenario by applying the following rules for segments who receive offers:
• Sunglass discount for females who posted positive tweets and live in Miami
• Watch for males
– Cross-sell campaign
The company decided to apply each campaign from the sentiment analysis that resulted in Chart 4 in the executive dashboard of the Cognos Business Intelligence report (Figure 6-7 on page 194) with the following rules and conditions:
• Great Outdoors Credit Card campaign for the people who own a house (The user can set the house as collateral for the loan.)
• Travel with Outdoors campaign for people whose personal debt to equity ratio is shorter than 30 days
•Prioritize tab: This feature is used to set items (for example, costs and probability to respond (Prob. to Respond)). The company prepares two campaigns:
– For customer retention
– For customer cross-sell: This campaign is for the bank’s cross-sell credit card.
To identify the most effective and profitable way of allocating cost and earning expected profit, prioritize in the following manner. In this sample case, Prob. to Respond is the ratio of the customer’s response ratio against our action (Figure 6-13).

Figure 6-13 Setting the prioritization parameters in SPSS Analytical Decision Management
The expected profit was calculated based on the expression, as shown in Figure 6-14.

Figure 6-14 Expression that is used to score the scenario in this sample case
•Deploy tab: After you set all items that are described in this document from Data to Deploy, you can create a new scenario that is based on the current project settings, as shown in Figure 6-15.

Figure 6-15 Creating the scenario in the Deploy tab
Then, you get the data in the home page of your project, as shown in Figure 6-16.

Figure 6-16 Expected profit and other results that are scored by the current configuration
Apply the scenario to the online shop
To integrate the online shop with SPSS Analytical Decision Management, the online shop web service requests that SPSS Scoring Services post the appropriate campaign or offer to present to the online customer based on the customer’s scoring based on historical information and purchases.
The IBM SPSS Scoring Services software is generally available at this website:
In our sample demonstration, the scoring service is named bank customer interaction, which requires that the following fields are populated with customer data:
•Age
•Months as a Customer
•Number of Products
•RFM Score
•Average Balance Feed Index
•Number of Transactions
•Personal Debt to Equity Ratio
•Months Current Account
•Number of Loan Accounts
•Customer ID
•Has Bad Payment Record
•Members Within Household
•Number of Call Center Contacts
•Gender
•Marital Status
•Age Youngest Child
•Number of Workers in Household
•Percentage White Collar Workers
•Household Debt to Equity Ratio
•Income
•Weeks Since Last Offer
•Homeowner
•Accepted Personal Loan
•Accepted Retention
•Accepted Home Equity Loan
•Accepted Credit Card
•Annual value
•Interested in Personal Loan
•Interested in Retention
•Interested in Home Equity Loan
•Interested in Credit Card
•Key
•City
•Product Category
•Sentiment Polarity
You can refer to the SPSS Scoring Service to check the required format of the requested message and the returned data:
See Example 6-1.
Example 6-1 SPSS scoring service request message metadata
<metadataResult>
<metadataInputTable id="Customer" name="Customer">
<metadataInputField isRequired="true" name="Age" type="long" />
<metadataInputField isRequired="true" name="Months as a Customer" type="long" />
<metadataInputField isRequired="true" name="Number of Products" type="long" />
<metadataInputField isRequired="true" name="RFM Score" type="double" />
<metadataInputField isRequired="true" name="Average Balance Feed Index" type="long" />
<metadataInputField isRequired="true" name="Number of Transactions" type="long" />
<metadataInputField isRequired="true" name="Personal Debt to Equity Ratio" type="long" />
<metadataInputField isRequired="true" name="Months Current Account" type="long" />
<metadataInputField isRequired="true" name="Number of Loan Accounts" type="long" />
<metadataInputField isRequired="true" name="Customer ID" type="long" />
<metadataInputField isRequired="true" name="Has Bad Payment Record" type="long" />
<metadataInputField isRequired="true" name="Members Within Household" type="long" />
<metadataInputField isRequired="true" name="Number of Call Center Contacts" type="long" />
<metadataInputField isRequired="true" name="Gender" type="string" />
<metadataInputField isRequired="true" name="Marital Status" type="string" />
<metadataInputField isRequired="true" name="Age Youngest Child" type="long" />
<metadataInputField isRequired="true" name="Number of Workers in Household" type="long" />
<metadataInputField isRequired="true" name="Percentage White Collar Workers" type="long" />
<metadataInputField isRequired="true" name="Household Debt to Equity Ratio" type="long" />
<metadataInputField isRequired="true" name="Income" type="long" />
<metadataInputField isRequired="true" name="Weeks Since Last Offer" type="long" />
<metadataInputField isRequired="true" name="Homeowner" type="string" />
<metadataInputField isRequired="true" name="Accepted Personal Loan" type="string" />
<metadataInputField isRequired="true" name="Accepted Retention" type="string" />
<metadataInputField isRequired="true" name="Accepted Home Equity Loan" type="string" />
<metadataInputField isRequired="true" name="Accepted Credit Card" type="string" />
<metadataInputField isRequired="true" name="Annual value" type="long" />
<metadataInputField isRequired="true" name="Interested in Personal Loan" type="string" />
<metadataInputField isRequired="true" name="Interested in Retention" type="string" />
<metadataInputField isRequired="true" name="Interested in Home Equity Loan" type="string" />
<metadataInputField isRequired="true" name="Interested in Credit Card" type="string" />
<metadataInputField isRequired="true" name="Key" type="long" />
<metadataInputField isRequired="true" name="City" type="string" />
<metadataInputField isRequired="true" name="Product Category" type="string" />
<metadataInputField isRequired="true" name="Sentiment Polarity" type="string" />
</metadataInputTable>
<metadataOutputField isReturned="true" name="Campaign" type="string" description="" />
<metadataOutputField isReturned="true" name="Offer" type="string" description="" />
<metadataOutputField isReturned="true" name="Output-PredictedProfit" type="string" description="" />
<metadataOutputField isReturned="true" name="Output-MaxOffersNum" type="integer" description="" />
<metadataOutputField isReturned="true" name="Output-MinProfit" type="double" description="" />
<metadataOutputField isReturned="true" name="Output-ProbToRespond" type="double" description="" />
<metadataOutputField isReturned="true" name="Output-Revenue" type="double" description="" />
<metadataOutputField isReturned="true" name="Output-Cost" type="double" description="" />
</metadataResult>
For example, you can create the following request message and POST by using content-type: application/json to http://<spss_adm_server>:9080/scoring/rest/configuration/bank customer interaction and score, as shown in Example 6-2.
Example 6-2 Scoring service request message example
{
"id": "bank customer interaction",
"requestInputTable": [{
"name": "Table 1",
"requestInputRow": [{
"input": [{
"name": "Age",
"value": "24"
}, {
"name": "Months as a Customer",
"value": "0"
}, {
"name": "Number of Products",
"value": "1"
}, {
"name": "RFM Score",
"value": "0"
}, {
"name": "Average Balance Feed Index",
"value": "0"
}, {
"name": "Number of Transactions",
"value": "0"
}, {
"name": "Personal Debt to Equity Ratio",
"value": "24"
}, {
"name": "Months Current Account",
"value": "-4"
}, {
"name": "Number of Loan Accounts",
"value": "0"
}, {
"name": "Customer ID",
"value": "1669"
}, {
"name": "Has Bad Payment Record",
"value": "0"
}, {
"name": "Members Within Household",
"value": "6"
}, {
"name": "Number of Call Center Contacts",
"value": "10"
}, {
"name": "Gender",
"value": "F"
}, {
"name": "Marital Status",
"value": "S"
}, {
"name": "Age Youngest Child",
"value": "0"
}, {
"name": "Number of Workers in Household",
"value": "7"
}, {
"name": "Percentage White Collar Workers",
"value": "33"
}, {
"name": "Household Debt to Equity Ratio",
"value": "58"
}, {
"name": "Income",
"value": "65263"
}, {
"name": "Weeks Since Last Offer",
"value": "17"
}, {
"name": "Homeowner",
"value": "F"
}, {
"name": "Accepted Personal Loan",
"value": "F"
}, {
"name": "Accepted Retention",
"value": "F"
}, {
"name": "Accepted Home Equity Loan",
"value": "F"
}, {
"name": "Accepted Credit Card",
"value": "F"
}, {
"name": "Annual value",
"value": "30"
}, {
"name": "Interested in Personal Loan",
"value": "F"
}, {
"name": "Interested in Retention",
"value": "T"
}, {
"name": "Interested in Home Equity Loan",
"value": "F"
}, {
"name": "Interested in Credit Card",
"value": "F"
}, {
"name": "Key",
"value": "1"
}, {
"name": "City",
"value": "Miami"
}, {
"name": "Product Category",
"value": "Personal Accessories"
}, {
"name": "Sentiment Polarity",
"value": "Majority Positive"
}]
}]
}],
"context": []
}
Example 6-3 shows the expected response for this request.
Example 6-3 Expected output of the scoring services online request
200 OK
X-Powered-By: Servlet/3.0
Content-Type: application/xml;q=0.9
Content-Language: en-US
Content-Length: 742
Date: Fri, 06 Nov 2015 23:28:03 GMT
<?xml version="1.0" encoding="UTF-8" standalone="yes"?>
<scoreResult xmlns="http://xml.spss.com/scoring-v2" providedBy="bank customer interaction" id="fe3fdfcd-b65b-40ae-9eb4-87838ac438fe">
<columnNames>
<name>Campaign</name>
<name>Offer</name>
<name>Output-PredictedProfit</name>
<name>Output-MaxOffersNum</name>
<name>Output-MinProfit</name>
<name>Output-ProbToRespond</name>
<name>Output-Revenue</name>
<name>Output-Cost</name>
</columnNames>
<rowValues>
<value value="Cross sell">
</value>
<value value="Travel with Outdoors">
</value>
<value value="11.22511451590822">
</value>
<value value="2">
</value>
<value value="10.0">
</value>
<value value="0.07112557257954111">
</value>
<value value="200.0">
</value>
<value value="3.0">
</value>
</rowValues>
</scoreResult>
As you can see in Example 6-3 on page 210, this user will receive an offer of Travel with Outdoors from the Cross sell campaign. According to the SPSS Analytical Decision Management analysis, the probability of this customer to respond positively is 7%.
With this raw data, any web developer can customize the online shop pages according to the logged in user. Therefore, when the customer is authenticated in the online shop, this type of scoring request can be performed in the background. The campaign/offer is presented to the online customer according to the corporate strategy and web pages development platform.
6.3.4 Differences between Cognos Business Intelligence and SPSS Analytical Decision Management
Both Cognos Business Intelligence and SPSS Analytical Decision Management can show the formatted results from data sources in their portal sites. What are the greatest differences?
The difference is Cognos Business Intelligence displays past results but SPSS Analytical Decision Management displays expected future results:
•Cognos Business Intelligence
Cognos Business Intelligence is the tool for displaying past results. In this software, Twitter sentiment analysis (total number of positive comments for products and negative comments against products) is shown with revenue in the executive dashboard by using one of our sample packages, Great Outdoors Warehouse. Except for twitter data in BigInsights, all data comes from the sales data of Great Outdoors Co., Ltd that is stored in DB2 BLU. The company’s research team retrieves the data from Twitter posts that commented about products of Great Outdoors Co., Ltd.
•SPSS Analytical Decision Management
SPSS Analytical Decision Management is the tool to display the predicted future result based on the company’s existing data (for example, revenue and customer information). From its score, the user can pick the most effective and profitable scenario.
6.3.5 Where the data comes from
This section precisely describes where the displayed data comes from.
Cognos Business Intelligence
This section describes the executive dashboard that was set as the goal for displaying data in Cognos, as shown in Figure 6-17 on page 212:
•Chart 1: Upper-left quadrant
This chart shows the revenue trends for each product line by each quarter from 2010 Q1 to 2013 Q4. This data is stored in the gosales data warehouse (DW) in DB2 BLU.
X = Quarter (displayed as YYYYQuarter name, for example, 2010 Q1 is shown as 20101). Y = Revenue.
•Chart 2: Upper-right quadrant
The cross tab shows the accurate revenue amount for each product line by each year. This data is stored in the gosales DW in DB2 BLU.
•Chart 3: Lower-left quadrant
The colored map shows the annual gross profit of each country. This data is stored in the gosales DW in DB2 BLU.
•Chart 4: Lower-right quadrant
Bar chart: Annual product line revenue data from DB2 BLU. The dots represent Twitter positive/negative counts for each product line and the counts are from BigInsights.
Figure 6-17 shows all four charts on the executive dashboard.

Figure 6-17 Executive dashboard on Cognos Business Intelligence
SPSS Analytical Decision Management
This section describes how to use SPSS Analytical Decision Management:
•Project 1: Score propensity of campaign (Figure 6-18)
The sdbank_response_model.str model is created by SPSS Modeler Advantage. The data source is the bank_response_data.txt file.

Figure 6-18 Sample result: Model that is created by SPSS Modeler Advantage
•Project 2: Score scenario (Figure 6-19)
Customer Interactions.str is created by IBM Analytical Decision Management for Customer Interactions. The data source is the bank_customer_data.txt file.
Figure 6-19 Scored scenario by SPSS Analytical Decision Management for Customer Interactions
6.4 Use cases and examples
We described the concepts and the outline of the implementation in previous sections. Now, we present how to implement the sample cases in your environment.
This section covers the following topics:
6.4.1 Disclaimer
This documentation is written for users with a basic knowledge of the IBM software that is used in these sample cases. For more information about the IBM software, see the product manuals or other online resources.
Complete the installation and configuration of the required software under the supported software environment before you implement these samples in your environment. Also, you need to change the software settings to fit your environment. You might face performance problems, depending on your environment’s resources.
If you use the latest product version in our scenario, certain data from the products, such as Cognos or SPSS Analytical Decision Management, differs from the data that is shown in the demonstration video:
•IBM Knowledge Center (for the product manuals):
•Supported environment
For the current environment that is supported for each product, check the following website:
6.4.2 Installed software
To implement this sample case, you need to install and configure the software that is listed in Table 6-3.
Table 6-3 Installed IBM Software for this sample case
|
Product
|
Version
|
Notes
|
|
Installation Manager
|
1.8.3
|
|
|
IBM Cognos Business Intelligence Server
|
10.2.2 Fix Pack (FP) 2
|
OpenLDAP is used as the security provider.
|
|
IBM Cognos Framework Manager
|
10.2.2 FP2
|
Only the client on Microsoft Windows is offered for this software.
|
|
IBM Cognos Cube Designer
|
10.2.2 FP2
|
Only the client on Windows is offered for this software.
|
|
Collaboration and Deployment Service
|
7.0.0.0
|
In addition to Collaboration and Deployment Service, the following components are required to be installed from the installation manager:
•Repository server
•Modeler adapter
|
|
Deployment Manager
|
7.0.0.0
|
N/A
|
|
SPSS Analytical Decision Management
|
17.0
|
N/A
|
|
SPSS Modeler Server
|
17.0
|
N/A
|
|
DB2 BLU
|
10.5 FP6
|
If you want to use a distributed installed type of database, the database client must be installed in the terminal of the following software:
•Cognos Business Intelligence Server
•Framework Manager
•Cube Designer
•Collaboration and Deployment Service
|
|
IBM WebSphere
|
8.5.5.0
|
•This software is installed by the Installation Manager.
•This software is used by Collaboration and Deployment Service.
|
|
BigInsights
|
4
|
N/A
|
6.4.3 How to implement the sample case
This section describes how to implement the sample case.
Implementing Cognos Business Intelligence
This section describes the steps to implement the sample case with Cognos Business Intelligence.
Prerequisites
Two Cognos users (employees of Great Outdoors Co., Ltd) are described in this sample case, as shown in Table 6-4. The Cognos users’ information is stored in the security provider. The security provider offers security for Cognos Business Intelligence. We use OpenLDAP as our security provider in this sample case. The IT department of the Great Outdoors Co., Ltd wants to provide confidential data only to the correct people. The IT staff must apply the security to the objects in the Cognos Business Intelligence portal. We show the steps to apply the security to the executive dashboard in the following sections.
Table 6-4 Cognos users in this sample demonstration
|
User name
|
Role
|
|
Administrator
|
IT staff and administrator of Cognos
|
|
Adam
|
Executive of Great Outdoors Co., Ltd., who uses the executive dashboard
|
Operations
This section explains how to implement the sample solution in your environment and how to set the correct security. You need to follow these steps in order for the implementation:
1. Create the data source connection in Cognos Administration.
2. Create and publish the Twitter Sentiment package.
3. Create the report for the executive dashboard.
4. Apply security.
Follow these steps to create the data source connection in the Cognos Administration:
1. Log in to the Cognos Business Intelligence portal site with the administrator role. For this demonstration, we set the user ID to admin and the password to ibm1ibm.
2. Click Administer IBM Cognos Content.
3. Click the Configuration tab.
4. Click New Data Source. Follow these steps:
a. For name, type GS_DB - Big SQL. Click Next.
b. Select JDBC for type and click Next.
5. Set the following fields to these values (Figure 6-20):
– Type: IBM InfoSphere BigInsights (BIG SQL)
– JDBC URL: jdbc:db2://mn01:32051/bigsql
– Driver class name: com.ibm.db2.jcc.DB2Driver
– Select Password to require a password at sign-on.
You will use bigsql for the user ID and ibm1ibm for the password.

Figure 6-20 Sample result: Data source definition for Big SQL
6. Click Next.
7. Click Finish.
Follow these steps to create and publish the Twitter Sentiment package. In these steps, we use Framework Manager, which is installed in the Windows client.
1. Click Start → All Programs → IBM Cognos → Framework Manager.
2. Click Open a project on the project page.
3. Open the product Cognos sample: great_outdoors_warehouse.cpf.
4. Log in with a user ID that can publish the package. For this demonstration, we set the user ID to admin and the password to ibm1ibm.
5. Change the Data Source setting:
– Click go_data_warehouse → Data Sources → go_data_warehouse.
– For the Content Manager Data Source, type GS_DB - BigSQL.
|
Note: In this case, we import the go_data_warehouse on DB2 BLU into BigInsights, which is named GS_DB - BigSQL. We set the data source as the data source definition that is named GS_DB - BigSQL (Figure 6-21).
|

Figure 6-21 Sample configuration: Properties for the data source in Framework Manager
6. Click go_data_warehouse → Packages.
7. Right-click Package.
8. Select Create → Create Package.
9. For the name, type Twitter Sentiment.
10. Click Next.
11. Click Next.
12. Click Next.
13. Click Finish.
14. Click Yes to answer “Would you like to open the Publish Package wizard?”
|
Note: If you receive the message that is shown in Figure 6-22, you successfully created the package. Do not worry about the message.
|

Figure 6-22 Sample view: Message appears during the package creation
15. Click Yes.
16. The Publish Wizard opens.
|
Note: If you want to change the publish location for Cognos Connection (web portal), select the appropriate folder from the folder location in the Content Store (Figure 6-23).
|

Figure 6-23 Sample configuration: Publish Wizard select publish location
17. Click Next.
18. Click Next.
19. Click Publish.
20. Click Finish.
21. Click Close.
22. Follow these steps to publish the package to the IBM Cognos Connection from the Framework Manager:
– Click File → Save as.
– Save file as great_outdoors_warehouse_dq_twitter.
Create the report for the executive dashboard. In this section, we create the workspace reports. After we create the workspace reports, the administrator can create the dashboard for the executives by picking up report items (charts, cross tabs, lists, and so on) from multiple workspace reports. These reports can be created from multiple packages and multiple data sources. Follow these steps:
1. Create the workspace report 1 from the Twitter Sentiment package. This workspace report contains two items (Figure 6-24):
– Chart for Chart 4 that is named as Revenue Twitter Sentiment by Product
– List
|
Note: In this sample case, we used a normal cube to show how to implement the solution in your environment in the simplest way. For big data analysis, such as Social Network Service, another configuration option is available. You can use Cognos Dynamic Cubes instead of normal Cognos cubes.
This option offers the capability to introduce a performance layer in the Cognos query stack to allow low-latency and high-performance online analytical processing (OLAP) analytics over large relational data warehouses if your environment has sufficient resources. For more information about Cognos Dynamic Cubes, see “Cognos Dynamic Cubes advantage” on page 260.
|
Figure 6-24 Sample result: Reports that are created in this section
2. Log in to the Cognos Business Intelligence portal site with the administrator role. For this demonstration, we set the user ID to admin and the password to ibm1ibm.
|
Note: You can log in with any other user ID that is eligible to use Cognos Workspace Advanced.
|
3. Click IBM Cognos Content.

Figure 6-25 Sample view: Component list after you click Launch
5. Click the Twitter Sentiment package in the Select Package window.

Figure 6-26 Sample view: Home page of IBM Cognos Workspace Advanced
7. Select List to create Chart 4. Click OK.
8. The List object opens in your workspace (Figure 6-27).

Figure 6-27 Sample result: List object is in the Cognos Workspace Advanced
9. Check whether you selected the View Metadata Tree icon (Figure 6-28). If you did not select it, select the View Metadata Tree icon.

Figure 6-28 Sample Configuration: Selecting the View Metadata Tree icon in the Source Tab
|
Important: Do not pick up items not from the Member Tree but from the Metadata Tree in this sample case. Pick up items from the Metadata Tree so that the user can drill down by clicking charts in the reports.
|
Table 6-5 shows the differences between the metadata tree and the member tree.
Table 6-5 Concept of items for the report
|
Type
|
Concept
|
Expected usage
|
Example
|
|
Metadata tree
|
Group (metadata)
|
Set metadata so that it allows the user to drill down
|
Set Personal Accessories means to enable Cognos Business Intelligence to display Personal Accessories and its succeeded members (for example, Eyewear).
|
|
Member tree
|
Data (actual member)
|
To display the data itself
|
Set Personal Accessories means allowing Cognos Business Intelligence to display only Personal Accessories.
|
10. Follow these steps to create the chart that is shown in Figure 6-29 on page 224:
a. Click Twitter Sentiment → Sales and Marketing (analysis) → Twitter Sentiment and Sales → Product → Product → Product Line in the Source tab.
b. Drag and drop Product Line in the List.
c. Click Twitter Sentiment → Sales and Marketing (analysis) → Twitter Sentiment and Sales → Twitter Polarity → POLARITY → POLARITY.
d. Drag and drop POLARITY in the List.
e. Click Twitter Sentiment → Sales and Marketing (analysis) → Twitter Sentiment and Sales → Twitter Sentiment and Sales → Revenue.
f. Drag and drop Revenue in the List.
g. Click Twitter Sentiment → Sales and Marketing (analysis) → Twitter Sentiment and Sales → Twitter Sentiment and Sales → Twitter Count.
h. Drag and drop Twitter Count in the List.
11. Your list looks similar to the list that is shown in Figure 6-29.

Figure 6-29 Sample result: Created list object in the Cognos Workspace Advanced
12. Follow these steps to create a combination chart for Chart 4:
a. Open the ToolBox tab next to the Source tab.
b. Drag and drop Chart to the workspace.
d. Select Primary Axis clustered Bar, Secondary Axis Clustered Line. Click OK.

Figure 6-30 Sample configuration: Selecting a combination chart from the wizard
13. You now have a combination chart in your workspace, as shown in Figure 6-31.

Figure 6-31 Sample result: Combination chart object in Cognos Workspace Advanced
14. Click Twitter Sentiment → Sales and Marketing (analysis) → Twitter Sentiment and Sales → Twitter Sentiment and Sales → Revenue in the Source tab. Follow these steps:
a. Drag and drop Revenue in Series (primary axis) in the combination chart.
b. Click Revenue inside of Series (primary axis) in chart
c. Open Properties for Chart Node Member.
|
Note: The Properties list box is on the lower-right side.
|
d. Click in the data format.
e. Select the following information in the Data Format window:
• Format type: Currency
• No. of Decimal Places: 0
• Scale: 3
• Use Thousands Separator: Yes
f. Click OK.
|
Note: If you click a blank cell, an arrow appears to the right. When you click that arrow, you find a list of choices. You can select items from that list, as shown in Figure 6-32.
|

Figure 6-32 Sample configuration: How to set the data format
15. Set Revenue (in thousands) for the Data items name and for the Data item label in Properties.
16. Click Twitter Sentiment → Sales and Marketing (analysis) → Twitter Sentiment and Sales → Twitter Polarity → Polarity → Polarity. Follow these steps:
a. Drag and drop Polarity in Series (secondary axis) in the combination chart.
b. Click Polarity inside Series (secondary axis) in the chart.
c. Open Properties for Chart Node Member.
d. Set Sentiment Polarity for the data item name and data item label in Properties.
e. Click OK.
17. Click Twitter Sentiment → Sales and Marketing (analysis) → Twitter Sentiment and Sales → Twitter Sentiment and Sales → Twitter Count. Follow these steps:
a. Drag and drop Twitter Count under Sentiment Polarity in Series (secondary axis).
b. Open Properties for Chart Node Member.
c. Set Tweets (000's) for the data item name and for the data item label in Properties. Click OK. See Figure 6-33.

Figure 6-33 Sample configuration: How to nest a data item
18. Click Twitter Sentiment → Sales and Marketing (analysis) → Twitter Sentiment and Sales → Twitter Sentiment and Sales → Products → Products → Product Line. Follow these steps:
a. Drag and drop Product Line to Categories (x- axis).
b. Click Chart.
c. Open Properties for Combination Chart.
d. Set Revenue Twitter Sentiment by Product for Name. Click OK.
e. Click File → Save as.
f. Save workspace report as Revenue and Sentiment by Product under Public Folders → CognosBigInsightsBLU - Demo → Report.
g. Click Save.
h. Now, you can create report 1.
We create the workspace report 2 from the GO Sales (analytics) package. This workspace report contains three items:
•Visualization that is named Area for Chart 1, which is named Revenue Trend by Product (Figure 6-34)
•Crosstab for Chart 2, which is named Revenue by Product and Year (Figure 6-35)
•Visualization that is named Dynamic Map for Chart 3, which is named Gross Profit by Country (Figure 6-36 on page 230)
Figure 6-34 shows the Revenue Trend by Product report.

Figure 6-34 Sample Result: Chart 1 - Revenue Trend by Product
Figure 6-35 shows the Revenue by Product and Year report.
Figure 6-35 Sample Result: Chart 2 - Revenue by Product and Year
Figure 6-36 shows the Gross Profit by Country report.
Figure 6-36 Sample Result: Chart 3 - Gross Profit by Country
Follow these steps:
1. Click File → New.
2. Select Crosstab.
3. Crosstab shows in your workspace.
4. Click GO Sales (analytics) → Sales (analytics) → Sales → Revenue in the Source tab.

Figure 6-37 Crosstab object in Cognos Workspace Advanced
Follow these steps to create the cross tab for Chart 2:
1. Click GO Sales (analytics) → Sales (analytics) → Products → Products → Product line.
2. Drag and drop Product line to Rows.
3. Click GO Sales (analytics) → Sales (analytics) → Time → Time → Year.
4. Drag and drop Year to Columns.
5. The crosstab for Chart 2 is created (Figure 6-38).

Figure 6-38 Sample result: Created Crosstab object in Cognos Workspace Advanced
Follow these steps to create the Area Chart for Chart 1:
1. Open the Toolbox tab on the lower-right side.
2. Drag and drop Visualization to the workspace.

Figure 6-39 Sample configuration: Selecting Area from the Visualization Gallery
4. The Visualization Area chart opens in your workspace (Figure 6-40).

Figure 6-40 Sample result: Visualization Area chart
5. Click GO Sales (analytics) → Sales (analytics) → Sales → Revenue in the Source tab.
6. Drag and drop Revenue to Values.
7. Click GO Sales (analytics) → Sales (analytics) → Time → Time → Quarter → Quarter key.
8. Drag and drop Quarter key to X categories.
9. Click GO Sales (analytics) → Sales (analytics) → Products → Products → Product Line.
10. Drag and drop Product Line to Series.
11. The Visualization Area chart for Chart 1 is created (Figure 6-41).

Figure 6-41 Sample result: Visualization Area chart in Cognos Workspace Advanced
Next, you create the Visualization Dynamic Map for Chart 3. Follow these steps:
1. Open the Toolbox tab in the lower-right corner.
2. Drag and drop Visualization to the workspace.

Figure 6-42 Sample configuration: Selecting Dynamic Map from the Visualization Gallery
4. The Visualization Dynamic Map opens in your workspace (Figure 6-43).

Figure 6-43 Visualization of Dynamic Map in Cognos Workspace Advanced
5. Open the Source tab.
6. Click GO Sales (analytics) → Sales (analytics) → Sales → Gross Profit.
7. Drag and drop Gross Profit to Color.
8. Click GO Sales (analytics) → Sales (analytics) → Sales staff → Sales staff → Country in the Source tab.
9. Drag and drop Country to Location.
10. The Visualization Dynamic Map for Chart 3 is created.
11. Save the workspace as Report objects - BigInsights and BLU under Public Folders → CognosBigInsightsBLU - Demo.
12. Click File → Close.
Create the dashboard for the executives. You can create the dashboard from report items that you created in the previous section (charts, crosstabs, lists, and so on). You can pick up the report items from multiple workspace reports and packages. Follow these steps to create the executive dashboard:
1. Click Launch → Cognos workspace in Cognos Connection.

Figure 6-44 Sample view: Home of IBM Cognos Workspace
3. Click Public Folders → CognosBiginsightsBLU-Demo → Report in the Content tab on the right side.

Figure 6-45 Sample view: Report objects - BigInsights and BLU
5. Drag and drop the following items to a blank area of the dashboard:
– Crosstab1
– Dynamic Map
– Area
6. In this sample case, the Area is in the upper-left corner (Chart 1). Crosstab1 is in the upper-right corner (Chart 2). The Dynamic Map is in the lower-left corner (Chart 3). See Figure 6-46.

Figure 6-46 Sample result: Charts and crosstab are in the workspace dashboard

Figure 6-47 Combination Chart of sentiment analysis in the workspace dashboard
9. Click Actions → Save as.
10. Save the file as BigInsights with Big SQL and DB2 BLU under Public Folders → CognosBigInsightsBLU - Demo.
11. Click Save.
You must apply security to the workspace dashboard that you created so that only executives can see it. The dashboard contains confidential data, so it must be secure. First, create the executive security group. Then, apply the security to the executive workspace dashboard so that only a user that belongs to executive group can view it. Follow these steps:
1. Create the Executive group in the built-in Cognos namespace by clicking Launch → IBM Cognos Administration (Figure 6-48).

Figure 6-48 Sample view: Open IBM Cognos Administration
2. Click the Security tab.

Figure 6-49 Sample view: Cognos namespace under the Security tab

Figure 6-50 Sample view: New group in namespace
5. Name the new group Executives.
6. Click Next.
7. Click Add in the lower-right corner.
8. On the left, click Show users in the list.
9. Click the namespace that you created. For this demonstration, we created LDAP_NS.
10. Select adam. Click the yellow arrow to move adam to the Selected entries box.
11. Verify that adam shows in the Selected entries box (Figure 6-51).

Figure 6-51 Sample configuration: Moving adam to the selected entries box
12. Click OK.
13. Click Finish.
14. Create the Executives group and set adam for its group.
Apply security to the workspace:
1. Navigate to Launch → IBM Cognos Connection.
2. Navigate to Public Folders → CognosBigInsightsBLU - Demo.

Figure 6-52 Sample configuration: Select More to open the properties for configuration
4. Click Set properties.
5. Click the Permission tab.
6. Select Override the access permissions acquired from the parent entry.
7. Click Add.
8. Click Cognos → Executives.
9. Select Executives.
10. Click the yellow arrow (Figure 6-53).

Figure 6-53 Sample configuration: Select a group so that you can grant rights to that group
11. Click OK.
12. Select Executives.
13. Select the following items in the grant column (Figure 6-54):
– Read
– Write
– Execute
– Traverse
|
Note: For maintenance, in this sample case, do not remove the System Administrator group from this access list completely.
|

Figure 6-54 Sample configuration: Grant rights for a selected group
14. Click OK.
|
Note: If you want to change the content based on the user login (apply role-based security), see IBM Cognos Proven Practices: Dynamic Reporting with Role-based Security at the following website:
http://ibm.co/1NZw5yP
|
Implementing Analytical Decision Management
The following section describes the implementation steps for Analytical Decision Management.
Create the data source
For this demonstration, we use the product sample data.
Create the model
We create a model to receive the propensity score of the response that is in the bank_response_data.txt file. Then, we use the score that is received from the project in the Analytical Decision Management for Customer Interaction.
Many methods exist to create a model:
•By using Modeler Client
•By using Modeler Advantage
•By using the model building feature in the application of Analytical Decision Management
In this case, we use the Modeler Advantage in the Analytical Decision Management because it offers a simple user interface, and it enables a user to create a model without requiring detailed and professional analytical skills.
|
Note: To follow the steps to build the model with the Modeler Advantage, see “How to create an Advanced Model” on page 262.
|
Create the project to find the profitable scenario
You can create the project in Analytical Decision Management for Customer Interactions.
We create a project to score the propensity score for response rate by our campaign action based on previous response records. This score is used in the prioritization when IBM Analytical Decision Management simulates the customers who are offered a campaign when the IBM Analytical Decision Management for Customer Interactions creates the project.
Follow these steps:
1. Access the URL http://<server>:9080/DM.
|
Important: DM in http://<server>:9080/DM is case-sensitive. If you type dm instead of DM, you cannot open the access page of SPSS Analytical Decision Management.
|
2. Log in to SPSS Analytical Decision Management. For this case, we use admin for the user ID and ibm1ibm for the password, as shown in Figure 6-55.

Figure 6-55 Sample view: Login page of IBM Analytical Decision Management
3. Add Twitter information (City, Product Category, and Sentiment polarity) to the bank_customer_data.txt file from the data. The data was retrieved from Twitter and stored in BigInsights.
4. Return to the home page.
5. Select New on the IBM Analytical Decision Management for Customer Interactions window, as shown in Figure 6-56.

Figure 6-56 IBM Analytical Decision Management for Customer Interactions on the Launch page
6. Click Data on the home page.
7. Set the data source. Follow these steps to set the data sources that are used for this project:
a. Click Add a data source.
b. Set the bank_customer_data.txt file for the data source:
• Data source name: bank customer data
• Data Source type: File
• File: Path to the file
c. Click Save.
d. Click the green icon in the No. of records column of Project Data Source under Data Sources.
e. Check whether bank customer data is set for the Project Data Model.
f. Check whether the fields show correctly (Figure 6-57).
|
Note: If the data in the Data source section was not loaded correctly in IBM Analytical Decision Management, the fields cannot be generated.
|

Figure 6-57 Sample result: Imported fields from the data source
8. Create rules in the Global Selections tab. You can apply a filter to determine the customers that you want to select from the imported data source:
a. Open the Global Selections tab.

Figure 6-58 Sample view: Create a rule
c. Create a rule in the Manage Global Selections section. This section creates a filter to use records with the following condition: A person who does not have a bad payment record is not offered a campaign within 8 weeks of sending a tweeter message on Personal Accessories.
d. Enter the following information to implement this filter (Figure 6-59):
• Name: Bad Payment Record
• Selections: Exclude rule
• Expressions: Has Bad Payment Record = 1 (1 means that user has a bad payment record history.)
|
Note: With this setting, a user with a bad payment record is excluded.
|
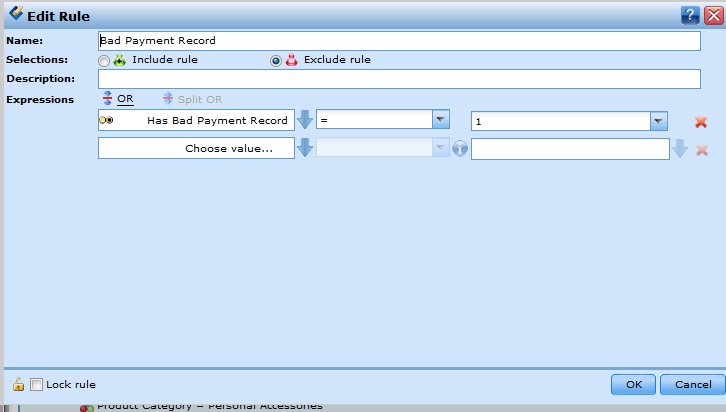
Figure 6-59 Sample configuration: Setting for Rule in the Manage Global Selections section
e. Click OK.
f. Click the Create a rule icon again.
g. Enter the following information to implement this filter:
• Name: Weeks Since Last Offer
• Selections: Exclude rule
• Expressions: Weeks Since Last Offer < 8
|
Note: With this setting, any customer who was offered a campaign within the last eight weeks is excluded.
|
h. Click OK.
i. Click the Create a rule icon again.
j. Enter the following information to implement this filter:
• Name: Product Category
• Selections: Include rule
• Expressions: Product Category = Personal Accessories
|
Note: With this setting, a customer who posted a tweet on the Personal Accessories product line is included.
|
k. Click OK.
9. Create a campaign and the offers to apply to our scenario. Follow these steps:
a. Click the Define tab.
b. Right-click My Campaign and select Rename.
|
Note: This campaign is created, by default. If you want to create a different campaign, click the plus sign (+).
|
c. For the name, type Retention.
d. Click OK.
e. Right-click My Offer.
f. Select Rename.
g. For the name, type 30 percent off on Sunglasses.
h. Click Add new Offer.
i. For the name, type 30 percent off on Watches.
j. Click Save.

Figure 6-60 Sample view: Location of Add dimension tree members icon
10. To add a campaign, follow these steps:
a. Click Add New campaign.
b. For the name, type Cross sell.
c. Click Save.
d. Click Cross sell → My offer.
e. Right-click OK on My offer.
f. Select Rename.
g. For name, type 1-Month Free Membership.
h. Click Add New Offer. Add the Travel with Outdoors and Great Outdoors Credit Card offers to Cross sell.
i. Click Save.
Now, two campaigns and five offers are available (Figure 6-61).

Figure 6-61 Sample result: Created campaign and offers in the Define tab
11. Create the segment rule to apply a filter to individuals who are eligible for each offer of the campaign. Follow these steps:
a. Select Retention.
b. Click Create a new rule in the Allocate Offer Using Segment Rules panel (not shown).
c. Enter the following information (Figure 6-62):
• Name: Female
• Allocation: 30 percent off on Sunglasses
• Expressions: Gender = F, City = Miami, and Sentiment Polarity = Majority Positive
d. Click OK.

Figure 6-62 Sample configuration: Set the segment rule
e. Click Create a new rule in the Allocate Offer Using Segment Rules panel (not shown).
f. Enter the following information:
• Name: Male
• Allocation: 30 percent off on Watches
• Expressions: Gender = M
g. Click OK.
h. Select Cross sell.
i. Click Create a new rule under Allocate Offer Using Segment Rules.
j. Enter the following information:
• Name: Homeowner
• Allocation: Great Outdoors Credit Card
• Expressions: Homeowner= T
k. Click OK.
l. Click Create a new rule under Allocate Offer Using Segment Rules.
m. Enter the following information:
• Name: Low Debt Ratio
• Allocation: Great Outdoors Credit Card
• Expressions: Personal Debt to Equity Ratio > 30
n. Click OK.
12. Now, you can create two segment rules for each of the two campaigns. Set the prioritization parameter. Specify how revenue cost and prioritization values are combined to balance objectives and optimize results. Follow these steps:
a. Open the Prioritize tab.
b. Click Customize table for the Prioritization Parameter.
c. Select an offer for each parameter in the Customize Prioritization table (Figure 6-63).
|
Note: With this setting, you can apply prioritization to each offer level, but not to the campaign level. As a default, you can apply prioritization settings to the campaign level only. If you want more precision, you can change the setting and apply the setting more precisely to each offer level.
|

Figure 6-63 Customize Prioritization Table shows where you want to set the prioritization directly
d. Click Save.
e. Set the following information for the Prioritization Parameter section.
In the Prioritization Parameter section, you can specify how to choose the best offer for each customer if the customer is eligible for multiple campaigns, as shown in Table 6-6.
Table 6-6 Sample configuration: Prioritization parameter
|
Campaign/offer
|
Prob. to Respond
|
Minimum profit
|
Revenue
|
Cost
|
Priority
|
|
30 percent off on Sunglasses
|
0.1
|
10
|
Annual value
|
22
|
Normal
|
|
30 percent off on Watches
|
0.1
|
10
|
Annual value
|
21
|
Normal
|
|
1-Month Free Membership
|
$XFRP-Response in sdbank_response_model.str
|
10
|
60
|
3
|
Normal
|
|
Travel with Outdoors
|
$XFRP-Response in sdbank_response_model.str
|
10
|
200
|
3
|
Normal
|
|
Great Outdoors Credit Card
|
$XFRP-Response in sdbank_response_model.str
|
10
|
400
|
3
|
Normal
|
|
Note: The fields whose name starts with a dollar sign ($) means a scored field by the Modeler Advantage and other related components.
|
f. For offers (1-Month Free Membership, Travel with Outdoors, and Great Outdoors Credit Card) in the Cross sell campaign, set the Propensity score by clicking the Open Input tool bar icon (blue down arrow).
g. Click the Select an object from existing repository icon (magnifier) in the middle (Figure 6-64).
Figure 6-64 Sample view: Select an object from existing repository
h. Select the model that is named sdbank_response_model.str that you created in the Modeler Advantage.

Figure 6-65 Sample result: Selecting objects in sdbank_response_model.str
|
Note: If you select the model icon, which is the second icon to the right, you can build the model by using the data source or upload model.
|
j. Validate the project in the Deploy tab. You can use the configuration under the Deploy tab to check that all parts of a project are set up correctly.
|
Note: If you set the Real Time Scoring options, you can specify interactive questions. You can use it to prompt users for additional information when additional information is needed in the Real Time Scoring panel. For more information, see the IBM Knowledge Center for SPSS Decision Management 7.0.0 by clicking User’s Guide → Scoring and deployment → Deploying applications → To specify Real Time Scoring options) at the following website:
You can also apply batch scoring options. But for this case, we share simple examples and do not set the batch scoring options.
|
k. Click the Deploy tab.
l. Expand Project Summary.

Figure 6-66 Sample view: Project Summary section in the Deploy tab
n. After the validation, expand the section.
o. Check that each item has a green check as shown in Figure 6-67.

Figure 6-67 Sample result: Model validation
13. Create the scoring service configuration.
You use the Deployment Manager to create a scoring configuration. For more information, see the IBM Knowledge Center for SPSS Collaboration and Deployment Services 7.0.0. Click Deployment Manager User’s Guide → Scoring → Scoring configurations at the following website:
Follow these steps:
a. Click Start → All Programs → IBM SPSS Collaboration and Deployment → Deployment Manager 7.0 (Figure 6-68).

Figure 6-68 Sample view: Location of Deployment Manager 7.0
b. Double-click Deployment Manager 7.0.
c. Right-click Server name.
d. Select Log on as.
e. Click Server name → Content Repository.
f. Right-click CustomerInteraction.str, which you created in this sample.

Figure 6-69 Sample configuration: Select Configure Scoring in Deployment Manager 7.0
h. On the Scoring tab, provide the following information:
i. For the configuration name, type bank customer interaction. Click Next.
ii. Type 2 for the maximum number of offers. Click Next.
iii. Leave the setting and click Next.
iv. Leave the setting and click Next.
v. Leave the setting and click Next.
vi. Click Finish.
|
Note: If the status is not Started, you cannot receive the scoring result.
|

Figure 6-70 Sample result: Started status of scoring configuration for the model
6.4.4 Links
For more information, see the following resources:
•SPSS Collaboration and Deployment Services 7.0.0 at the following website:
•SPSS Decision Management 7.0.0 at the following website:
•Making better business decisions with analytics and business rules at the following website:
..................Content has been hidden....................
You can't read the all page of ebook, please click here login for view all page.