
Brain–computer integration
Abstract
Brain–computer integration is a new kind of intelligent system based on brain computer–interface, which aims to combine living beings’ intelligence and machines’ intelligence.
Keywords
Brain; computer interface; brain; computer integration; electroencephalogram; P300; ABGP agent; environmental awareness; collaborative decision-making
Brain–computer interface (BCI) is a direct communication pathway between the brain and an external device. Brain–computer integration is a new kind of intelligent system based on BCI, which aims to combine living beings’ intelligence and machines’ intelligence. It has a great potential in many applications, such as clinical rehabilitation, entertainment, and military surveillance.
The integration of biological intelligence (brain) and computer intelligence (machine), the perfect combination of brain’s perception and cognitive ability and machine’s computing ability, is expected to produce a stronger intelligent form that extends beyond the existing biological intelligence system and machine intelligence system.
13.1 Overview
The brain–computer interface (BCI) is the interface that connects the human brain or animal brain with the outside world. However, this connection is done not in a normal and regular way but in a special way to connect with the outside world, for example, stimulating the artificial cochlea, the external signal commanding mice to walk in the maze, the monkey taking bananas with the machine hand, and the brain wave controlling the computer. Some think the essence of the life is information. Since the essence of both the artificial brain and the biological brain is information and they have the same mechanism of information processing, they should be able to exchange with the help of the interface. Information is uniform in essence, which will make a great development in computer techniques, artificial brain, and the combination of the human brain and the computer.
In 1973 Vidal published the first paper related to the BCI [1]. The BCI does not depend on the brain’s normal output path, namely nervous peripherals and muscular tissue; the system can realize human brain communication directly with the external world (computer or other peripheral devices). The failure of setting up the first brain–machine interface system was the partial start in the run program of IBM360/91 computer. This kind of machine is a batch processing machine, which cannot meet the needs of real-time processing of the brain–computer interface system. The progress of recent computer and signal processing technology has opened up a new era of electroencephalography (EEG) signal analysis and BCI research; computer speeds now can meet the needs of BCI signal processing. So why can’t the real-time detection of thought be achieved? Placement in neurons in the vicinity of the microelectrodes to record cell excitatory signals with the idea of controlling a BCI has many problems. First is using a large number of brain electrodes to control the individual’s thinking, because each individual has a million neurons. In addition, scientists do not understand the relationship between cell excitability and thinking.
The scientists at MIT, Bell Labs, and Neural Information Science Research Institute have developed successfully a microcomputer chip that can simulate the human nervous system, successfully implanted in the brain, and repair human nerves using the principle of bionics. It cooperates with the brain and sends out complicated orders for the electronic device, monitoring the activity of the brain to achieve very good results. People will be able to put microchips in the brain to increase memory, so that people have a “spare brain” in the near future.
American researchers in the field of biological computer–bonded cells taken from animal brain tissue with computer hardware, such a developed machine is called a biological electronic robot or cyborg. If the chip is in good agreement with the nerve endings, the chip can be connected to the nerve fibers and the body’s brain nervous system. This improves the human brain function through the computer.
In 1999 Liaw and Burger of the University of Southern California proposed a dynamic synapse neural circuit model [2] and in 2003 developed a brain chip, which can replace the function of the hippocampus. The brain chip was successfully demonstrated in vivo mouse, which was consistent with the information processing in the brain of in vivo rat. This project is a part of the mind-machine merger, which has made breakthrough progress, and has been ranked as one of the top ten scientific and technological advances in the world in 2003 by the Chinese scientific community.
In July 2016 Elon Musk founded a company, Neuralink, which studies BCI technology. Their research focuses on creating brain–computer interaction devices that can be implanted in the human brain, allowing the human brain to connect directly to computing devices.
On July 16, 2019 Elon Musk, CEO of Neuralink, a BCI company, held a press conference. Neuralink said that it had found an efficient way to implement BCI. According to Neuralink’s method, thin threads, which are only a quarter the width of a human hair, are passed through special surgical robots and “stitched” into the brain. A “wire harness” of 1024 wires is attached to a small chip, ten of which are implanted into the skin, each of which can be wirelessly connected to a wearable, detachable, and upgraded device behind the ear, which can communicate wirelessly with a mobile phone.
To implement such a system, three core technologies are involved: the implanted “wire” of the brain, the neurosurgical robot for implantation, and the chip for reading brain signals. The first major improvement of this BCI is the “wire.” which is 4–6 μm wide, which is equivalent to 1/10 of human hair. Compared with the materials currently used, it is not likely to damage the brain and can transmit more data. These wires are distributed in 96 threads with up to 3072 electrodes per array.
Another major advance is the neurosurgical robots used for implant lines. The robot is vividly named the “sewing machine” because its working principle is similar to that of a sewing machine: Thread is inserted into the brain needle by needle. The robot can implant six wires per minute and can precisely avoid other tissues such as blood vessels.
The third breakthrough is the development of a chip that can better read, clean up, and amplify signals from the brain. The chip is connected to the brain through the wiring harness, and each harness is composed of 1024 wires. Each wire harness attached to the chip can be wirelessly connected to a wearable, detachable, scalable “pod” device behind the ear, and the device can communicate wirelessly with a mobile phone. Now, the chip can only transmit data over a wired connection (it uses USB-C), but the ultimate goal is to create a wireless working system. To do this, Neuralink plans to implant four of these sensors, three in the motion area and one in the somatosensory area. It will wirelessly connect to an external device mounted behind the ear, which will contain a unique battery.
13.2 Modules of the brain–computer interface
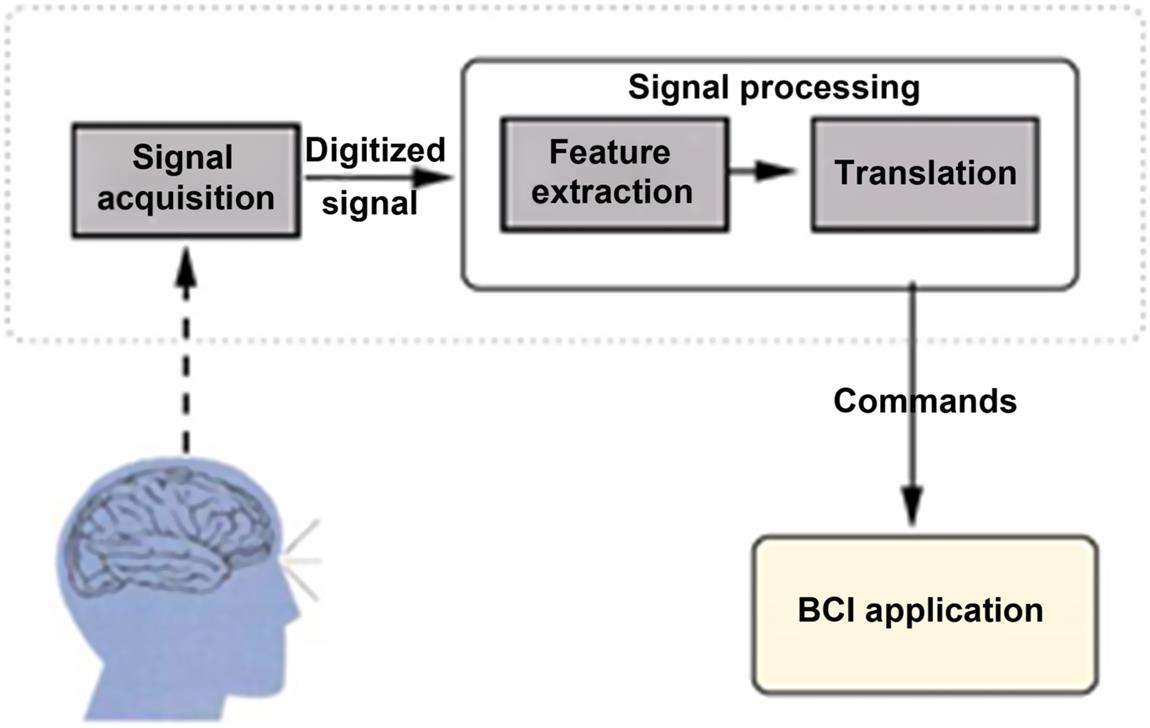
The BCI is an effective as well as a powerful tool for user–system communication [3]. It can be defined as a hardware and software communications strategy that empowers humans to interact with their surroundings with no inclusion of peripheral nerves or muscles by utilizing control signals produced from electroencephalographic activity. Every BCI system essentially consists of three function modules: signal acquisition, signal analysis, and controller (see Fig. 13.1).
- 1. Signal acquisition: The experimenter header wears an electrode cap, gathers an EEG signal, and conveys to the amplifier; the signal generally needs to be amplified about 10,000 times. Through preprocessing, including signal filtering and A/D conversion, the signal is finally transformed into digital form and stored in the computer.
- 2. Signal analysis: Utilizing algorithms such as fast fourier transformation (FFT), wavelet analysis, etc., from the preprocessed EEG signals are drawn from the particular features correlated to the experimenter’s intention. After drawing, the features are classified by the classifier. The output of the classifier is regarded as the input of the controller.
- 3. Controller: The classified signal is converted to the actual action, such as the cursor on the display movement, mechanical hand movement, the letter input, control of the wheelchair, open the television, etc. Some of the BCI system is also provided with a feedback loop, as shown in Fig. 13.1; it can not only let experimenters clear think about their control results but can also help them adjust the brain’s electric signal according to the results in order to reach the desired objectives.
This chapter [4] introduces EEG-based BCI, particularly to investigate its methodological advantages and disadvantages and the essential contributions required in this field of research. In spite of the many outstanding breakthroughs that have been achieved in BCI research, some issues still need to be resolved. Firstly, a general BCI standard is currently the main issue. The BCI community should declare a general BCI standard that must be adhered to by BCI researchers. Second, the existing BCIs offer a somewhat poor information transfer rate (ITR) for any type of effectual BCI application. Hence, future research should concentrate on increasing the ITR of BCI systems. Moreover, matching the most relevant EEG control signal with the intended BCI application is another important issue in EEG-based BCI research.
13.3 Electroencephalography signal analysis
13.3.1 Electroencephalography signal sorting
The electroencephalogram is divided into spontaneous EEG and evoked potentials (EP). Spontaneous EEG is the spontaneous generation of neural cells in the human brain without specific external stimuli. Here, the so-called spontaneity is relative, referring to nothing in particular outside to stimulate. The spontaneous electroencephalogram is a nonstationary random signal; not only its rhythm with changes in mental state but also the basic rhythm of the background will occur from time to time, such as rapid eye movement, etc. Evoked potential means something that exerts and stimulates the sense organ (photic, acoustic, or electric) and artificially changes the brain electric potential. Evocations by stimulation patterns can be divided into auditory-evoked potentials; visual-evoked potentials (VEP); a body feeling–evoked potentials (somatosensorily evoked potential), and the use of a variety of psychological factors as expected; preparation; a variety of voluntary activities evoked event-related potentials (ERP). ERP fusion up the psychology of the cerebral cortex of neurophysiology and cognitive process. It includes P300 (reflecting the objective indicator of the cognitive function of the human brain), N400 (language comprehension and expression of related potentials), and endogenous components. ERP and a number of cognitive processes, such as psychological judgment, understanding, identification, attention, selection, making decisions, directional response, some language functions, etc. are closely related.
Spontaneous EEG signals reflect the electrical activity of the human brain and the functional state of the brain, and its essential features include cycle, amplitude, phase, and so on. Regarding the classification of electroencephalography (EEG) according to the frequency band and amplitude, EEG is generally divided into the following waves:
- 1. δ wave: Frequency band range 0.5~3 Hz, the amplitude is generally about 100 μV. In sober, normal people’s electroencephalogram, we cannot generally record the δ wave. In a lethargic adult, an infant or preschool child, or mature adult of developed intelligence, we can record this kind of wave. When influenced by some medicines, the brain will create a δ wave with organic disease.
- 2. θ wave: in the frequency band range 4~7 Hz, the amplitude is generally 20~40 μV. This wave appears in the frontal lobe, terminal leaf, and is relatively obvious, generally in sleepy subjects. It is the manifestation of the inhibitory state of the central nervous system.
- 3. α wave: In the frequency band range 8~13 Hz, the amplitude of the rhythm is generally 10~ 0 μV; this is the amplitude and space distribution of the normal person’s α wave, with some individual differences. Of the activities of an α wave, the most prominent by carrying the pillow department, and bilateral symmetry, appear the greatest when the subject is quiet and has eyes close. The amplitude is also the highest with open eyes, except other while irritating at the question of thinking, α wave disappears and presents another fast wave.
- 4. β wave: In the frequency band range 14~30 Hz, the amplitude is generally less than 30 μV, distributed over the central area and center front temple; it is easiest to present in the frontal lobe. The α rhythm disappears and presents a β rhythm at the time of the physiological reaction. The β rhythm relates nervousness and excitement. So usually the β rhythm is related to activity, or desynchronizing typologically.
- 5. γ wave: In the frequency band range 30~45 Hz, the amplitude is generally less than 30 μV. The frontal area and central areas exhibit this wave the most. This and the β wave are fast waves, which increase with excitement, manifesting an increased amplitude in the nerve cell.
It is generally believed that normal brain wave frequency range is in generally4~45 Hz. A cortex pathological change will cause an unusual frequency component in some brain waves.
ERP fusion up the psychology of the cerebral cortex of neurophysiolog0cal and cognitive process. Many cognitive processes, such as psychological judgment, understanding, recognition, attention, selection, making decisions, orienting response, some language functions etc., are closely associated. Typical ERP are as follows:
- 1. P300: P300 is a kind of ERP, and its peak value is about 300 ms after the event occurs. The smaller the probability of occurrence of relevant events, the more prominent is the P300 caused.
- 2. VEP: The VEP changes specific parts of the brain, called VEP.
- 3. Event-related synchronization (ERS) or desynchronization electric potential (ERD): Given unilateral limb movements or imagined movements, the contralateral brain areas produce events related to the synchronous potential; the same side of the brain region generates ERS.
- 4. Slow cortical electric potentials (SCP): SCP consists of changes of the cortical potentials, for the duration of a few hundred milliseconds to a few seconds. Through feedback training, autonomous control SCP amplitude positive or negative deviation can be achieved.
These several kinds of brain electric signals, as BCI input signals, have their own characteristics and limitations. P300 and VEP belong to the evoked potential category, do not need training, and signal detection is simpler and more accurate with the processing method. The drawbacks are that a special device is needed for stimulation, and results depend on a certain level of consciousness of people (such as vision). Other kinds signals do not require outside stimulation, but they do require a large amount of special training.
13.3.2 Electroencephalography signal analytical method
In 1932 Dietch first used the Fourier transform for EEG feature analysis, introducing classic methods such as frequency-domain analysis, time domain analysis, etc. in the EEG research field. In recent years, methods such as wavelet analysis, nonlinear dynamics analysis, neural network analysis, chaos analysis, statistics, etc. and the organic combination of analytical methods effectively promoted the development of the EEG signal analysis method. With the development of research work, the analysis of EEG patterns with time and spatial information has also become an effective way to study EEG signals. EEG signal analysis technology is widely used at present:
- 1. Time domain analysis: The extraction of features directly from the time domain is the first developed method because it is very intuitive and has clear physical meaning. Time domain analysis is mainly used to directly extract waveform features, such as zero crossing point analysis, histogram analysis, analysis of variance, correlation analysis, peak detection and waveform parameter analysis, coherent average, waveform recognition, and so on. In addition, using the parameter model (such as the AR model, etc.) is an important means to analyze the signal in the 1 time domain, and the feature parameters can be classified, identified, and tracked by EEG. However, because the waveform of EEG signal is very complex, there is no particularly effective method of EEG waveform analysis.
- 2. Frequency-domain analysis: Because many of the main features of the EEG signal are reflected in the frequency domain, power spectrum estimation is an important means of frequency-domain analysis, and spectrum analysis technology plays an especially important position in EEG signal processing. Its significance lies in the change of amplitude with time in the brain wave transform to EEG power with frequency changes in the spectrum, which can be directly observed in the distribution and transformation of EEG frequency. Spectral estimation methods can generally be divided into classic methods and modern methods. The classic spectrum estimation method, by definition, uses finite–length data to estimate, namely short-period data of the Fourier transform–based cycle method, mainly in two ways: the indirect method to estimate the correlation function, after Fourier transform, to obtain the power spectrum estimation (according to the Wiener Khintchine theorem); the direct method and random data direct Fourier transform, taking the amplitude square to get the corresponding power spectrum estimation, also known as a periodogram. The common problem of the two methods is that the variance of the estimation is not good, and the estimated value along the frequency axis of the fluctuation is more severe; the longer the data, the more serious the phenomenon. In order to improve the resolution of spectral estimation, a set of modern spectral estimation theory is formed based on the parameter model. The parametric model estimation method can obtain high-resolution spectrum analysis result, which provides an effective method for the extraction of the EEG signal in the frequency domain. However, the power spectrum estimation cannot reflect the time variability of the EEG spectrum. Therefore, the power spectrum of the time-varying nonstationary process of EEG can be lost when the power spectrum of the single frequency domain is lost.
- 3. Time frequency analysis: Time frequency analysis technology is different from traditional time domain or frequency-domain analysis. It is simultaneous in the time and frequency domains of signal analysis technology, mainly divided into two types of linear and nonlinear transform. Linear transformation mainly includes short-time Fourier transform, Gabor transform, and wavelet transform technology. Nonlinear transformations mainly include Wigner-Ville distribution, Cohen class distribution, etc. The main idea behind time frequency analysis is to spread the time domain signal in the time frequency plane. In time, the independent variable signal is expressed by two parameters: time and frequency as a function of the independent variables, thus showing the frequency components of the signal at different time points. Compared with the traditional Fourier transform, time frequency analysis is more advantageous due to the characteristic of having nonstationary and time-varying signals. In the EEG signal analysis, the main application of time frequency analysis technology is to EEG feature waveform recognition and feature extraction. At present, the most widely used method is the wavelet transform. Wavelet analysis uses a short window at high frequency and a wide window at low frequency, which fully embodies the idea of relative bandwidth frequency analysis and adaptive variable resolution analysis, thus providing a possible means for real-time signal analysis. At present, the time frequency analysis of EEG has led to a lot of valuable research results.
- 4. Space–time analysis: Considering the spatial distribution of the EEG on the scalp and merging the analytic intersection of space–time and analytical methods is helpful to reveal and enhance the implicit characteristics of the multisignal. For example, motor, sensory, and cognitive activities in space for performance parts have obvious differences; therefore, temporal and spatial information for identifying, analyzing, and fusion may get more in-depth research results. The analytical methods of spatial and temporal patterns are greater, such as the micro state, spatial spectrum estimation, classical statistical methods (correlation function), spatial filter, and so on. Combining the multidimensional statistical analysis methods of spatial filtering methods, such as principal component analysis (PCA), independent component analysis (ICA), public space model (common spatial pattern, CSP), in the EEG signal analysis processing fields has been a very important application. Specifically, PCA is a linear transform; processing is the signal to do singular value decomposition, before determining the signals in the main composition as a basis for judgment. Based on higher-order statistics, the ICA represents the latest development theories of modern statistical signal analysis. Studies have shown that ICA is very suitable for multichannel EEG signal analysis and has yielded very good results in EEG noise elimination and feature extraction. Calculating the spatial filter to detect the event related to the phenomenon of the CSP (ERD) algorithm is the most successful in the EEG feature extraction algorithm and has been widely used in BCI. The time and space analysis method can provide more information, and it has been an important research direction in EEG signal analysis in recent years.
13.4 Brain–computer interface technology
In the past ten years, BCI technology has been developed rapidly in the following research directions of information technology.
13.4.1 Visual-evoked potential
A plurality of options is displayed on the display device, and the user is looking at a desired option. Processing the display mode can enable users to produce different EEG signals when looking at different options. A more direct way to get a look at the target is to track people’s attention. But this method requires the head to remain motionless, it is difficult to achieve practical applications. And the BCI based on EEG does not restrict the movement of the head. In 1992 Sutter developed a real-time BCI system called brain response system [5]. Displaying an 8*8 matrix notation in accordance with a pseudo-random binary sequence (known as the m-sequence) red/green alternately, while the user is watching the symbol you want selected and comparing the measured EEG signal with a prerecorded template, you can determine whether the user is watching the goal. Users can use the system to operate word processing software.
13.4.2 Event-related potential
13.4.2.1 P300 potential
P300 is a kind of ERP, and its peak value appears about 300 ms after the dependent event happens. Event-related probability is small, is caused by P300, is significant, and is the most significant in the parietal region (middle part in head or posterior). When one is exerted in several different ways while subjected to the constituent stimulus, the range of P300 that each kind of stimulus causes can be measured; the P300 range that those stimuli cause should be larger. This kind of stimulus is what experimenters count, that is, the stimulus that the user wants to choose. In 1988 Farwell et al. developed a virtual typewriter using P300 [6]. A 6×6 character matrix is flashed by row or column, and the order was is random; then the row or column flicker is in related events, showings the character the user wants to enter. Seeking to detect the P300 amplitude of the largest row and column, the line and the column intersection for the character, the character is printed.
13.4.2.2 Event-related desynchronization
Pfunscheller and his colleagues developed a system [7] whose method is similar with the literature [8]. They concentrated on the central area of the scalp, that is, multielectrodes on the sensory motor cortex, and observed the μ rhythm produced (under the awake state). When people were not processing sensory input or generating output motion, the sensory and motor cortical areas often showed EEG activity of 8–12 Hz. When they concentrated on the sensory or motor cortex, the slow wave was a μ rhythm. Focusing on the visual cortex produced an amplitude change of the visual μ rhythm and other rhythms. The amplitude of this particular frequency band is associated with increased motor activity and decreases with ERS and ERD.
Training a neural network to recognize the ERS/ERD patterns caused by particular sports (for example, right- or left-hand movement or holding the game card T in one hand to the right or left) and to discern finally the pattern produced by the action, then the Hibert transform is adopted to extract the key features of these pattern. Learning vector quantization or the Kohonen neural network is used to classify them. When the neural network is trained 100~200 times, the system will be able to identify the EEG pattern caused by specific movement with very high accuracy, which can control the cursor movement or other external devices. For example, the EEG data for one second can be predicted with the left- or right-hand movement, and the accuracy rate is as high as 89%. Now, researchers are studying the stability of the pattern that corresponds to the continuous motion and the method of improving the rate and accuracy of the pattern recognition.
13.4.3 Spontaneous electroencephalography for action training
Wolpaw et al. found that people can learn to use spontaneous EEG activity [9] that is not caused by special evoked stimulation activities to control an external instrument. They focused on training the obtained μ rhythm and the related EEG component. The obtained μ rhythm is generated by the sensorimotor cortex, recorded in the center of the head of the electrical activity. Experimenters learn to use the selected μ rhythm and/or other EEG components. Move a cursor located in the center of the display screen to the surrounding target. Move the cursor as the output because it is objective, easy to implement and quantify, can be used as a prototype of a variety of rehabilitation equipment, and can be used to operate the mouse driver. In one dimensional model, the target is located at the top or bottom of the screen edge, and the cursor moves vertically.
In a two-dimensional mode, the target may be located anywhere (e.g., one of the four corners), and the cursor has both vertical movement and horizontal movement. The EEG in a specific frequency range is obtained by online spectral analysis and is converted to the cursor movement. For example, in one dimension, high-amplitude rhythms (8–12 Hz μ rhythm) recorded in the sensorimotor cortex of one cerebral hemisphere were used to move the cursor. Low amplitude was used to move the cursor down. A function that transforms the magnitude to the cursor movement is a linear equation. The parameters are derived from the evaluation of the previous performance of the user. In a two-dimensional model, an equation controls the vertical movement, and another equation controls the level of movement. Most users can get obvious control ability after 5~10 stages. After more training, they will be able to reach the top or bottom of the target in 1–2 seconds with accuracy higher than or equal to 90%. For two-dimensional control, although it is very significant, it cannot achieve such a high accuracy rate. Efforts are being made to improve the accuracy and speed of the cursor movement, depending on the definition of alternatives, to increase the training of the EEG component, or to improve the EEG control in the cursor moving algorithm. The ultimate goal of this work is a mouse cursor movement, so as to enable brain, based on the EEG and via the human–computer interface, to operate a commercial mouse driver.
13.4.4 Self-regulation of steady-state visual-evoked professional
By a movement training method, McMillan et al. trained some volunteers to control the steady-state VEP amplitude caused by fluorescent tubes with a flash frequency of 13.25 Hz [10]. The electrode is placed in the occipital cortex to measure the change of the magnitude, with a horizontal strip and/or feedback auditory sound to the experimenter. The change of magnitude is transformed into the input of control through real-time analysis. If the VEPI amplitude is above or below the specified threshold, a discrete control output is generated. These outputs can be used to control many kinds of instruments. After training for about 6 hours, the experimenters basically could command a flight simulator to make left or right turns with an accuracy rate higher than 80%. After 3~5 stages of flight simulation training, the experimenter were able to control a neuromuscular controller to execute the knee extension with 95% accuracy.
At present, in BCI area the leading laboratories around the world and their BCI research directions are as follows.
- 1. Graz University of Technology, Austria
Pfunscheller et al. apply ERS/desynchronization potential as the BCI signal input. In this system, experimenters can control the movement of the cursor [7]. - 2. Wadsworth Center, USA
Wolpaw et al. trained experimenters to adjust the μ rhythm by themselves and, through changes of μ rhythms, to achieve cursor movement, spelling letters, and prosthetic control and other functions [9]. Due to its flexible control of one’s own μ rhythm, it is more difficult to use, so not every experimenter can learn to use this device. - 3. Tübingen University, Germany
Birbaumer et al. designed a thought translation device (TTD), through changes of the slow cortical potentials to achieve control of the outside world, using visual feedback, to realize the function of spelling letters [11]. - 4. University of Illinois, USA
Farwell et al. adopted a P300-evoked potential as the BCI signal input [6]. On a computer screen, 36 letters were shown in a 6×6 lattice. The experimenter is required to select a particular letter. Each line and each column flickers with a frequency of 10 Hz; calculated for each row and each column is the scintillation average reaction, measuring P300 amplitude. The greatest response to rows and columns for a particular letter can be “found” from the P300-evoked potential. - 5. Department of Biomedical Engineering, Tsinghua University, China
Shangkai Gao et al. developed a noninvasive BCI system with a high transmission rate based on steady-state visual-evoked potentials (SSVEP) [12], which can be used for motion control, environmental control equipment, and other purposes, after they study in-depth the characteristics analysis and extraction method of SSVEP.
13.5 P300 brain–computer interface system
P300-ERP is a kind of ERP that is induced by a small probability event (visual, auditory, tactile, and other sensory) and gains its name due to a positive potential waveform in the EEG that happens about 300 ms after the incident corresponding to it. Based on the P300 potential of the BCI, an specific event stimulus sequence is used to evoke the user’s P300 potential and, through the occurrence of P300, to determine the user’s awareness activities. This type of BCI is particularly suitable for selecting a target from multiple options. In recent years there have been new P300-BCI systems that use nonalphabetic symbols and objects as input options, a combination of evoked potential P300 and virtual reality applications, and so on
13.5.1 Architecture
Take the P300 Chinese input BCI system as an example to explain the architecture of the P300-BCI system [13]. The system consists of a user interface, an EEG acquisition system, and an EEG analysis program; the composition of the system is shown in Fig. 13.2. The user interface induces the P300 potentials of the user by visual stimulation and to transmit amplified marking flashing moment event code. The EEG acquisition system consists of the P300 EEG signal, amplification, filtering, digitalization, merging with the event code, and transfer to the EEG analysis program. The analysis program is responsible for the EEG online processing, converting the acquisition of P300 information into the selection of instructions, and then real-time feedback to the user interface for the input of Chinese characters.
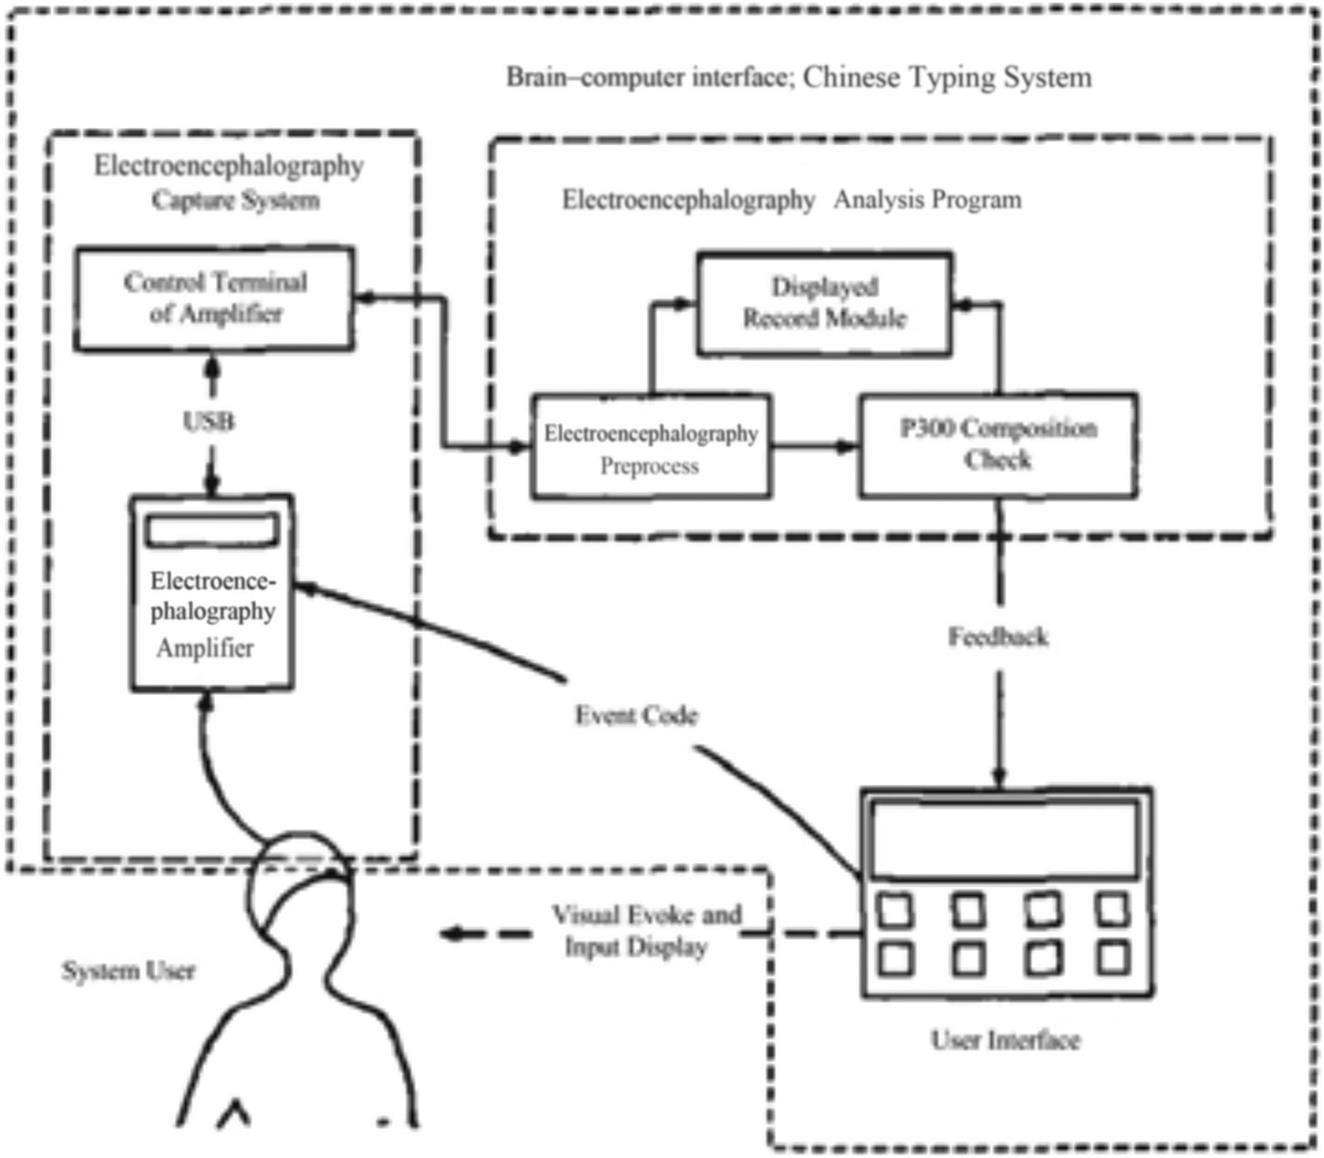
The EEG analysis program and user interface program run on different PC machines. The user interface appears through the computer display. The EEG acquisition system use a neuroscan with a 40 EEG amplifier and multichannel electrode cap. The EEG analysis program processes the EEG signal data and preservation of intermediate data of EEG for later experimental analysis. As shown in Fig. 13.2, if the user is regarded as a constituent element of the system, then the flow of information of the overall system forms a closed loop.
In the course of typing, the user interface sends a flickering message to the EEG processing program to indicate it is finished and then enters the wait state, after the end of each selection phase. After receiving this message, the processing program reads the EEG data from the buffer and sends the corresponding P300 command to the interface after analyzing and judging. If the program thinks that the P300 cannot be reliably identified, the command is sent out empty. If an effective command is received by the interface, it will be sent to the input of the Chinese character spelling module; if an empty command is received, the system does not carry out any action and starts a new round of selection of flashing.
13.5.2 Visual elicitor subsystem
A visual-evoked signal is the core module of P300 brain–computer interface system and the most flexible part in the entire system, and it has a certain decisive role in the configuration modes of other modules. The visual elicitor subsystem includes three parts: layout management, experimental parameter configuration, and maintenance of experimental scheme. The layout management module supports different types of control calls and the location, distance, and other parameters of the adjustment function, and it is very user-friendly to operate and control. The parameter configuration interface involves a variety of experimental parameters. In the configuration of the appearance parameters of the control, there is very high configuration flexibility to meet the needs of the general P300 experiment parameters control. The maintenance module maintains the experimental evoking design scheme, including the storage, reading, and other functions of the experimental scheme.
13.5.3 Electroencephalography acquisition subsystem
The EEG acquisition subsystem contains P300 EEG signal amalgamates with incident code after amplification, filtering, digitization, and transfer to the EEG analysis program to improve the reliability of P300 detection. The preprocessing program processes the EEG signal corresponding to each option as a unit.
- 1. Removing the direct current drift of signals: Deduct the mean value of the original signal first, then remove the general direct component. This signal still contains a frequency of less than 0.5 Hz of the DC drift, the performance of the baseline of the ups and downs. Regard 1 second as the sampling interval to fetch the sample equally. The sampling points generate three spline curves, as the baseline of signal. The signal is subtracted from the spline curve, and the baseline drift is eliminated.
- 2. Eliminating the electric disturbance of eyes: The blinking movements of experimental subjects will alias the relevant electric potential of the eye in the EEG. Because of its large peak amplitude, it will seriously interfere with the identification of P300 potential. A regression algorithm can be used to eliminate the interference of the eye. In addition to the EEG, the simultaneous acquisition of electrical signals of eye (EOG) is needed. By calculating whether the slope of the EOG baseline exceeds a certain threshold to judge the occurrence time of the blink, the EEG signal is corrected for this time period.
- 3. Filter: The signal to the cutoff frequency of low-pass filtering 15 Hz, eliminates the high-frequency interference. A fifth-order Butterworth filter is used as filter algorithm.
- 4. Signal segmentation: The selected signal is divided into n segments corresponding to the round. Each round signal is subdivided into seven flash sections. The time span of each flash is 600 ms, which is calculated from the time when the corresponding event code appears. The flash segment contains a possible P300 potential.
13.5.4 Electroencephalography analysis subsystem
EEG analysis subsystem is responsible for the EEG online processing. The P300 information is converted into the choice instruction and then sends real-time feedback to the user interface for the input of Chinese characters. The system has the functions of superposition average, template matching, discriminant recognition, and so on.
- 1. Superimposed average: The different rounds of flash data corresponding to the same event code is classified as one kind, so we get total of seven categories, each class containing n flashing sections. The flashing sections of each class are superimposed on Eq. (13.1):
(13.1)
where (13.1)
 is the value of the k flashing segment at the time point i, and
  is represented by the value of the superimposed signal at the time point i. After overlay, each choice gets the seven flashing data segment, respectively representing the EEG data after different option box flashing.
 - 2. Template matching: The template is a prepared P300 data in advance, which is a typical P300 potential waveform signal for each pathway of the user. The time span of the template signal is 400 ms, corresponding to the 200~600 ms of the scintillation (flash) segment.
Template matching is performed by the degree of the difference between a metric to characterize both the measured scintillation (flash) signal segment and the template signal. The random signal correlation number s as the matching metric and pathway c and its template s value expressions can be shown in the Eq. (13.2):(13.2)
where xi and mi are the flashing signal and template values in the moment i, respectively, and the subscript c indicates the c pathway. Because the flash and template mean is all set to 0, there is no need to subtract the mean value of the signal from each xi or mi. The greater S value shows that the signal is closer to the template. (13.2)
- 3. Discrimination: The EEG signal of M pathways is collected by the system. By template matching, every choice gets 7×m matching value. The average s′ of m matching values of each option represents the average similarity between the EEG collected by each electrode and the template. The flash segment with the largest s′ is most likely to be the P300 potential. On the basis of improving reliability, the gap between maximum s′ and other flash s′ values should reach a certain level in order to assure the validity of results. For this reason, the system presumes that the discriminant procedure sends the corresponding option as the P300 command to the user interface only when the difference between maximum s′ and the second largest s′ is greater than 0.2; otherwise the program outputs an empty instruction.
13.6 ABGP agent
In intelligence science and artificial intelligence, an agent can be viewed as perceiving its environment information through sensors and as acting with the environment through effectors. As an internal mental model of agent, the BDI (belief, desire, intention) model has been well recognized in the philosophical and artificial intelligence areas. Bratman’s philosophical theory was formalized by Cohen and Levesque [14]. In their formalism, intentions are defined in terms of the temporal sequences of the agent’s beliefs and goals. Rao and Georgeff have proposed a possible-worlds formalism for BDI architecture [15]. The abstract architecture they proposed comprises three dynamic data structures representing the agent’s beliefs, desires, and intentions, together with an input queue of events. The update operations on beliefs, desires, and intentions are subject to respective compatibility requirements. These functions are critical in enforcing the formalized constraints upon the agent’s mental attitudes. The events that the system can recognize include both external events and internal events.
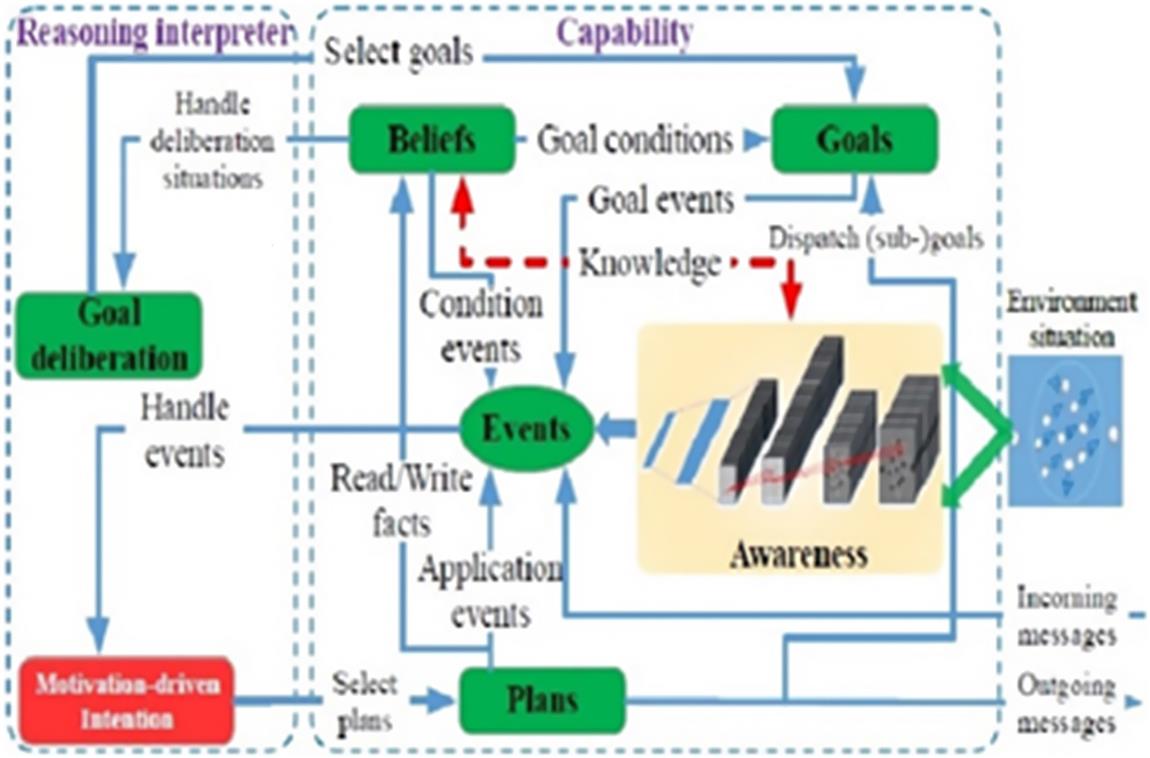
A cognitive model for multiagent collaboration should consider the external perception and internal mental state of agents. A 4-tuple framework (Awareness, Belief, Goal, Plan) is proposed for the agent, whose architecture is shown in Fig. 13.3. Awareness is an information pathway connecting to the world (including natural scenes and other agents in the multiagent system). M. Endsley pointed out awareness has four basic characteristics [16]:
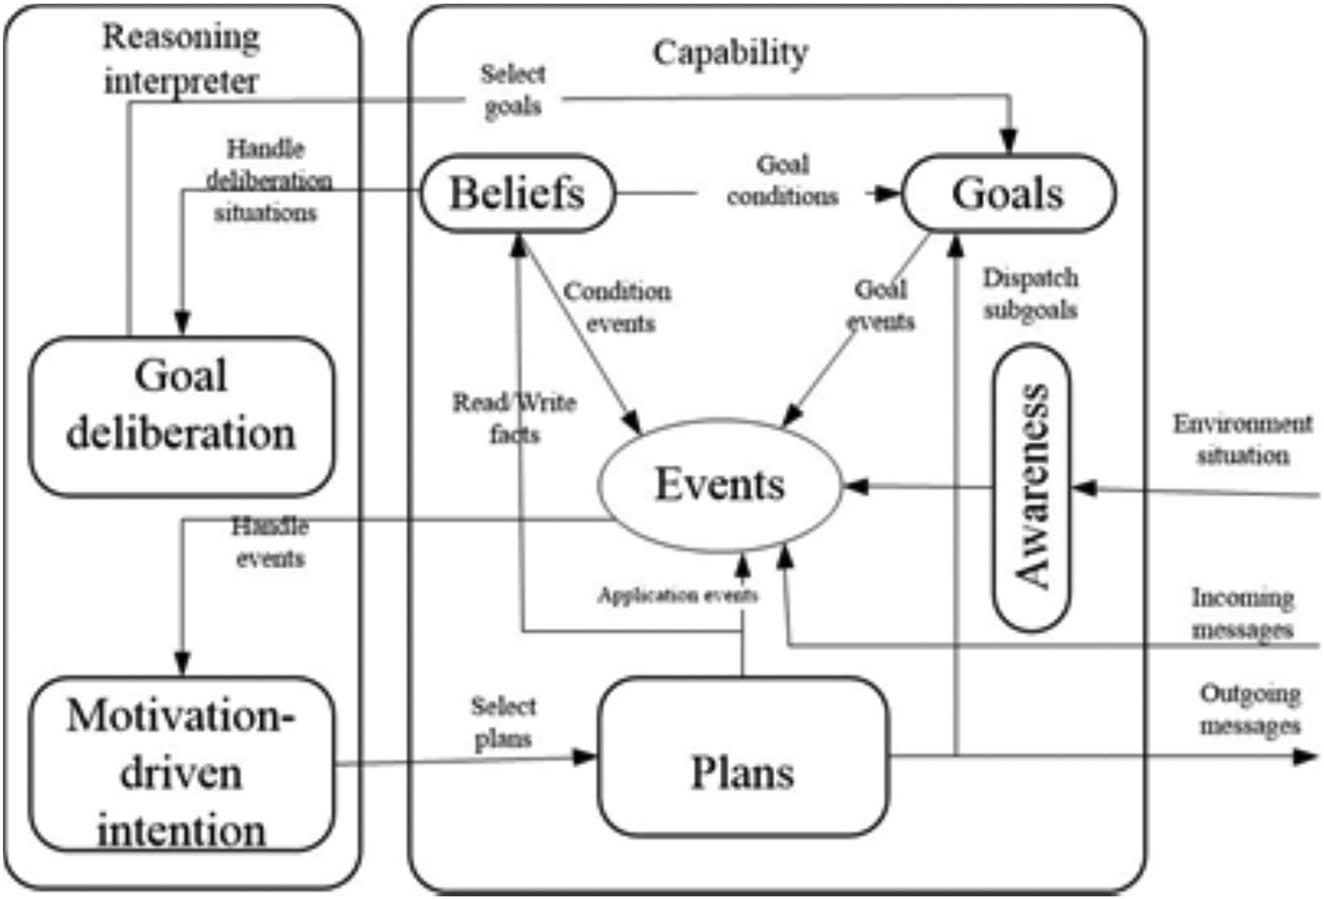
Beliefs can be viewed as the agent’s knowledge about its setting and itself. Goals make up the agent’s wishes and drive the course of its actions. Plans represent the agent’s means to achieve its goals.
The Awareness, Belief, Goal, Plan (ABGP) agent considers not only the internal mental state of the agent but also the cognition and interaction of the external scene, which plays an important role in the decision-making of the agent. ABGP agent is the core component of brain–computer collaborative simulation environment.
13.7 Key technologies of brain–computer integration
Brain–computer integration is a new intelligent system based on brain–computer interface technology, which is integrated with biological intelligence and machine intelligence [17,18]. Brain–computer integration is an inevitable trend in the development of brain–computer interface technology. In the brain–computer integration system, not only must the brain and the machine be interoperable on the signal level, but the brain’s cognitive ability must be integrated with the computer’s computing ability. But the cognitive unit of the brain has different relationships from those of the intelligent unit of the machine. Therefore, one of the key scientific issues of brain–computer integration is how to establish the cognitive computing model of brain–computer integration.
At present brain–computer integration is an active research area in intelligent science. In 2009 DiGiovanna developed the mutually adaptive BCI system based on reinforcement learning [19], which regulates brain activity by the reward and punishment mechanism. The machine adopts the reinforcement learning algorithm to adapt the motion control of a mechanical arm and has the optimized performance of the manipulator motion control. In 2010 Fukayarna et al. controlled a mechanical car by extraction and analysis of mouse motor nerve signals [20]. In 2011 the Nicolelis team developed a new brain–computer–brain information channel with a bidirectional closed-loop system. As reported in Nature [21], it turned a monkey’s touch information into an electric stimulus signal to feed back to the brain while decoding the nerve information of monkey’s brain in order to effect the brain–computer cooperation.
The brain–computer integration system has three remarkable characteristics: (1) more comprehensive perception of organisms, including understanding behavior and decoding neural signals; (2) organisms are a system of sensing, a computation body, and an executive body, with a bidirectional information exchange channel with the rest of the system; (3) comprehensive utilization of the organism and machine on multilevels and with multigranularity greatly enhances system intelligence.
In 2013 the Zhaohui Wu team of Zhejiang University developed a visual enhanced rat robot [22]. Compared with the general robot, the rat robot has the advantage in the aspects of flexibility, stability, and environmental adaptability. In this project, rats were the main carriers; through the camera combined with the computer vision technology, the visual recognition ability of the rat was strengthened. The visual enhancement of the rat robot system mainly consisted of three parts: the implanted electrode, the rat pack, and the calculation module. A pinhole camera was installed on the mouse carrying the backpack. The camera was capable of the real-time capture of the video image of the rat, the video transmission was analyzed by the computer through the wireless module in the backpack. According to the analysis results, the backpack on the stimulation circuit produced an electrical stimulation signal that was transferred to the related brain regions of the rat, and the rat robot could produce different behaviors (turn left, turn right, go) and explore unknown environments. In the computing system of brain–computer integration, the spatial decision-making ability and execution ability of the rats are combined with the decision ability of the machine (closed-loop control) and the perceptual ability (camera perception).
The core of brain–computer integration is the cognitive computing model of brain–computer collaboration. The cognitive process of the brain–machine collaboration is composed of environment perception, motivation analysis, intention, understanding, action planning, and so on, in support of the perception memory, episodic memory, semantic memory, and working memory to complete the brain–computer group awareness and coordinated action.
13.7.1 Cognitive model of brain–computer integration
Brain–computer integration is a new form of intelligence, which is different from both human intelligence and artificial intelligence. It is a new generation of intelligence science system that combines physics and biology. The brain–computer integration intelligence is different from human intelligence and artificial intelligence in the following three aspects: (1) At the intelligent input, the idea of brain–computer integration intelligence not only depends on the objective data collected by hardware sensors or the subjective information sensed by human facial features but also combines the two effectively, forming a new input mode with the prior knowledge of person. (2) In the stage of information processing, which is also an important stage of intelligence generation, a new way of understanding is constructed by integrating the cognitive mode of human beings with the computing ability of the computer. (3) At the output end of intelligence, the value effect of human beings in decision-making is added to the algorithm of gradual iteration of the computer to match each other, forming an organic and probabilistic coordination optimized judgment. In the continuous adaptation of human–computer integration, people will consciously think about commonsense behavior, and machines will find the difference of the value weight from the decision-making of people under different conditions.
Brain–computer integration adopts a hierarchical architecture. Human beings analyze and perceive the external environment through their acquired perfect cognitive ability. The cognitive process can be divided into perception and behavior layer, a decision-making layer, and a memory and intention layer, forming mental thinking. The machine perceives and analyzes the external environment through detecting data, and the cognitive process can be divided into an awareness and actuator layer, a planning layer, and a belief and motivation layer, forming formal thinking. The same architecture indicates that humans and machines can merge at the same level and that cause-and-effect relationships can be generated at different levels. Fig. 13.4 is the cognitive model of brain–computer integration [23]. In this model, the left part is a simulated human brain in terms of consciousness and memory mind model; the right part is the computer based on an ABGP agent.

13.7.2 Environment awareness
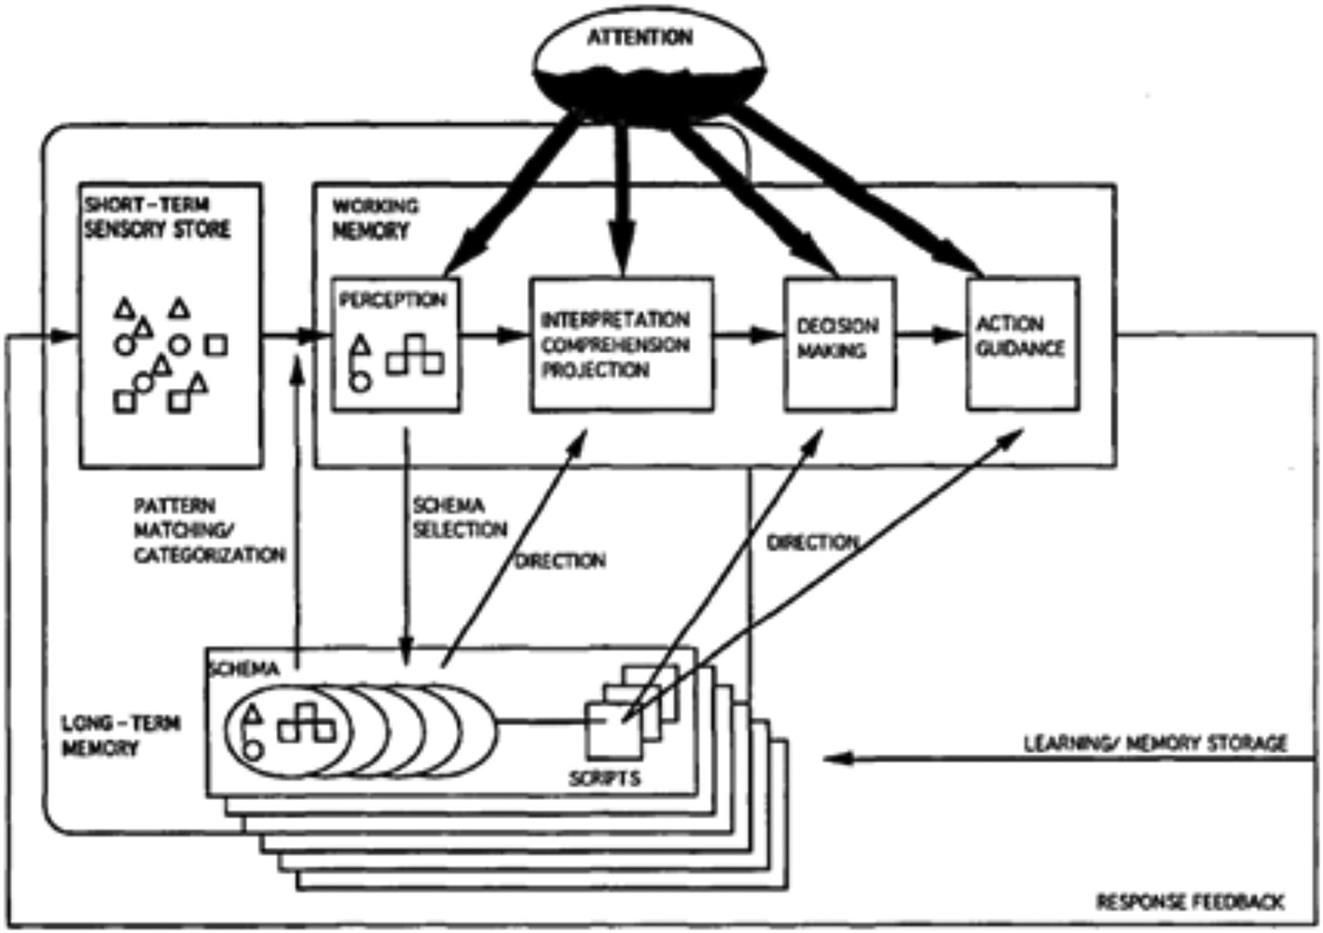
Environmental awareness refers to the process of individually processing environmental information. It is the process in which an individual feels various stimuli in the environment and organizes them into a higher-level psychological model on the basis of previous experience. It processes not only the current sensory information but also the environmental information stored in memory according to the individual’s current needs and environmental characteristics. The former is structural while the latter is functional.
In a certain time and space the components of the environment are perceived and understood, and then a prediction is made concerning the subsequent changes of these components. In 1988 M. Endsley gave the general framework of situation awareness shown in Fig. 13.5 [16].
In the Intelligence Science Laboratory, several methods have been developed for environment awareness. Here we describe how convolutional neural networks (CNNs) are used for visual awareness [23]. CNNs are multiple-stage, globally trainable artificial neural networks. CNNs have better performance in two-dimensional pattern recognition problems than the multilayer perceptron, because the topology of the two-dimensional model is added into the CNN structure, and the CNN employs three important structure features—local accepted field, shared weights, and subsampling—ensuring the invariance of target translation, shrinkage, and distortion for the input signal. CNN mainly consists of the feature extraction and the classifier [24]. The feature extraction contains multiple convolutional layers and subsampling layers. The classifier consists of one or two layers of fully connected neural networks. Both the convolutional layer with the local accepted field and the subsampling layer with the subsampling structure have the character of sharing the weights. The awareness module has been changed into a convolutional generative stochastic model (CGSM) compared with the original ABGP model with the single preestablished rules, and the parameters of CGSM will be a part of the knowledge in the belief base accessed through the dotted line path in Fig. 13.6.
A major attraction of ABGP-CGSM is the intrinsic properties of CGSM, such as the nonlinearity, the hierarchic feature representation, and especially the robustness for the noisy natural scenes. Those properties can be directly adopted to make up one of the abilities and knowledge of a cognitive agent and enable the agent such as a human to recognize the true world. Because of the introduction of CGSM in the awareness module, an agent based on the ABGP-CGSM model needs also to undergo a good learning process before cognizing the natural scenes.
Multiagent awareness should consider basic elements and relationship in a multiagent system [25]. Multiagent awareness model is defined as a 2-tuple MA={Element,Relation}, where Elements of awareness are as follows:
Basic relationships contain task relationships, role relationships, operation relationships, activity relationships, and cooperation relationships.
- 1. Task relationships define task decomposition and composition relationships. Task involves activities with a clear and unique role attribute
- 2. Role relationships describe the role relationship of agents in the multiagent activities.
- 3. Operation relationships describe the operation set of agents.
- 4. Activity relationships describe activity of the role at a time.
- 5. Cooperation relationships describe the interactions between agents.
A partnership can be investigated through cooperation activities relevance among agents to ensure the transmission of information between different perception of the role and tasks for maintenance of the entire multiagent perception.
13.7.3 Autonomous reasoning
Motivation is the internal driving force of subjective reasoning, which directly drives individual activities to initiate and maintain a mental state to achieve a specific purpose. The automatic reasoning is realized by the motive driven planning. In the brain–computer fusion system, there are two types of motivation: demand-based motivation and curiosity-based motivation.
Demand-based motivation is represented as a 3-tuple {n, G, I}, where n represents need, G is the target, and I represents motivation strength. In the brain–computer integration system, there are three kinds of requirements: perception needs, adaptation needs, and cooperation needs. Motivation is activated by incentive rules.
The motivation based on curiosity is to build a new motivation through a motivation learning algorithm [26]. The agent creates the observed perceptual input as an internal expression and associates this expression with the learned behavior that is conducive to operation. If the action result of an agent is not related to its current goal, motivation learning will not be carried out, which is very useful for the selection of learning content. But even when learning is not triggered by other motivations, novel learning can still occur in such a situation.
The learning process of motivation is to acquire the perceptual state through observation, and then the perceptual state is transformed from event to event. Discovering novel events arouses the interest of agents. Once the interest is aroused, the agent’s attention can be selected and focused on one aspect of the environment. In the motivation learning algorithm based on novelty, the observation function is used to focus attention on the subset of the perception state. Then the difference degree on the subset is calculated by the difference function, and the event is formed by the event function. The event drives the introspective search, and the most interesting event is selected by the novelty and interest degree, so that the agent can focus on the event item. Finally, based on the focus on the event of maximum interest, a new motivation is created.
13.7.4 Collaborative decision-making
The collaborative decision-making of the brain–computer integration is based on the theory of joint intention, which can effectively support the description and analysis of joint social behaviors among agents [27]. In the brain–computer integration, brain and computer are defined as agents with common goals and mental states. With the support of short-term memory, distributed dynamic description logic (D3L) is used to describe the joint intention [28]. The distributed dynamic description logic fully considers the characteristics of dynamic description logic in the distributed environment, uses the bridge rules to form the chain, realizes the joint intention through distributed reasoning, and enables the agents in the brain–computer integration to make a collaborative decision.
Since the brain–computer integration system is a distributed and heterogeneous system, a chain-supported bridge rule distributed dynamic description logic (CD3L) is proposed by us [29]. The CD3L consists of five basic components: the distributed dynamic description logic D3L, the distributed TBox, the distributed ABox, the distributed ActBox, and the reasoning mechanism. The CD3L distributed dynamic description logic introduces the combination of consistency semantics, through the bridge rules for knowledge dissemination, provides a theoretical basis for the integration and sharing of heterogeneous information, and supports the collaborative cognition of distributed heterogeneous brain–computer integration.
13.7.5 Simulation experiment
Here, we present a detailed implementation of ABGP-CNN for the conceptual framework of brain–machine integration. To significantly demonstrate the feasibility of the conceptual framework of brain–machine integration based on the ABGP-CNN agent model, we give a simulated application. The following will mainly represent the actual design of the rat agent based on ABGP-CNN supported by the conceptual framework of brain–machine integration.
Under belief knowledge conditions, the goals (here mainly visual information) constantly trigger the awareness module to capture environmental visual information, and the event module converts the visual information into the unified internal motivation signal events that are transferred to action plan module. Then the action plan module selects proper actions to respond the environment.
In simulation application, we construct a maze and design a rat agent based on ABGP-CNN to move in the maze depending on the guidepost of the maze path in Fig. 13.7 [23]. The task of the rat agent is to start moving at the maze entrance (top left of maze), and finally reach the maze exit (bottom right) following the guideposts.

In order to fulfill the maze activity shown in Fig. 13.7, the rat agent is implemented in all the three basic modules: <Awareness>, <Motivation>, <Action Plan>. In the rat maze activity experiment, the rat agent is designed to have three basic behaviors: moving on, turning left, and turning right in the maze. In order to guide the rat’s behaviors, we construct a true traffic guidepost dataset of the three different signals: moving on, turning left, and turning right. The different signals correspond to the different guidepost images, as shown in Fig. 13.8.

When the rat agent moves on the path, its goals constantly drive the awareness module to capture environmental visual information (here, the guideposts in the maze) and generate the motivation signal events to drive its behaviors’ plan selection. In the experiment, given the three motivation signals (moving on, turning left, and turning right) and the guideposts in the maze path, the agent can respond with three types of action plans to finish the maze activities.