This chapter takes a look at some of the ways you can track the performance of a web site or campaign, as well as some related terms, and covers the idea of ongoing reporting. If you’re following along in text only, you can pick up some information just from reading the material. However, I think it is more compelling if you develop a blog or site as discussed in Chapters 1-3, so that you have your own personal data to look at. It’s more exciting, and even fun!
Reviewing Campaign Analytics
Even though our focus is on Google Analytics, I think it’s worth seeing how tools relate. In the previous chapter, we looked at how to generate some traffic for viewing in analytics, and this would be representative of if you were doing an ad campaign and looking at its impact. In many cases, you could be involved in the execution of an ad campaign, as well as looking at the data.
It’s also helpful to see how an ad platform views things, versus how things look on your actual web site or blog.
In other words, the clicks from an ad don’t tell the whole story. Without looking at Google Analytics, you can get some sense of the amount of traffic you’ll get, but you won’t really know what to do with it. It’s like sending someone to a house but not knowing what they do once they get there.
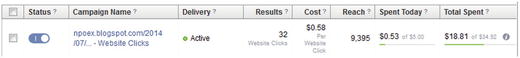
If you’re following along and have tried a Facebook ad campaign, you can go to Facebook to see how things are going: https://www.facebook.com/ads/manage
At this end, you’re seeing the “outgoing” information—people on Facebook who see your ad. Hopefully some of them click on it and visit your blog or web site:
If you tried the promoted post idea, you can go back to it and click on the Sponsored link. At present, Facebook doesn’t give good data on personal sponsored posts. (Is this because it’s in their best interest not to give numbers?) All they give you is a relative picture:
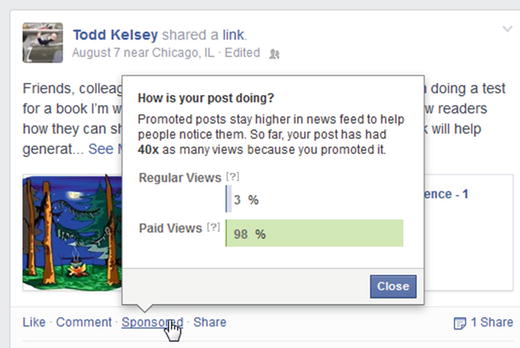
Okay, so how many people actually clicked on the link in the Sponsored post? This is one limitation of the “personal promotion” platform —limited data. When you run Facebook ads (or sponsored posts from a Facebook page, etc.), you get a bit more data .
Ultimately, you can look at Google Analytics to see how many clicks arrived from various sources.
Reviewing Performance in Google Analytics
So let’s go back into Google Analytics (assuming everything is set up, you’re tracking visitors, you shared on social media and/or ran an ad, etc.):
Go to http://www.google.com/analytics/ . You should see something like this, where you click on the link next to the little globe:
Google Analytics has a lot of options—a lot of ways to “slice and dice”—but my recommendation is to approach it pragmatically. You don’t have to know and use every option from day one. Instead, you can start by answering a specific question and branch out from there.
The fun part at this stage is seeing that there are in fact visitors to your site.
The Overview tab will open, and by default it will look back at recent data, based on Sessions:
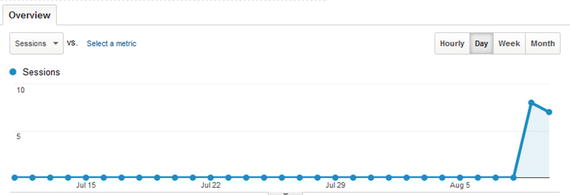
A session is a technical term for a visit, and the thing to keep in mind is that people often view several pages during a visit.
On the same page, there will be several additional items:
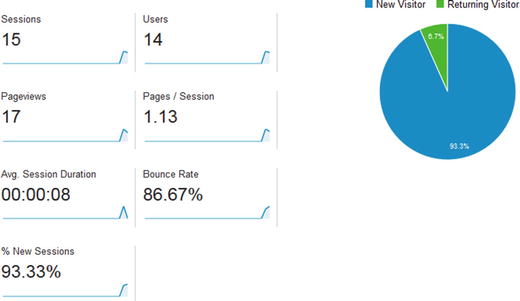
While there might be 15 sessions, there were 17 page views. This means that some of the visitors viewed more than one page during their visit.
Another interesting metric is the amount of time on average users spent during their visit. In this case, the average was 8 seconds.
One of the ways that people use information from Google Analytics is to view how performance currently is, and then set goals for the future. For example, a goal might be to look at the site or blog and see if you can add more compelling content , so that over time, the average duration of a session increases.
Bounce rate is a similar metric. The bounce rate represents the number of visitors who enter the site and then leave (or “bounce”), rather than continuing to view other pages on the same site. Another goal of reviewing performance and optimization might be to take note of the bounce rate, and see what you can do to decrease it.
What might be some reasons people “bounce”? A good Google search drill might be to search for “improving bounce rate” or “why do people bounce from a site”?
Location, Location, Location!
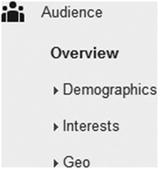
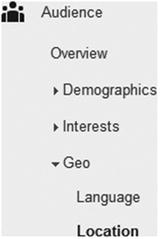
Another thing I think is particularly fun to do is to determine where people are visiting from. In Google Analytics, on the left, click on Geo:
Then click on Location :
There is a map overlay, and it will give you an instant visual sense of where your visitors are coming from:
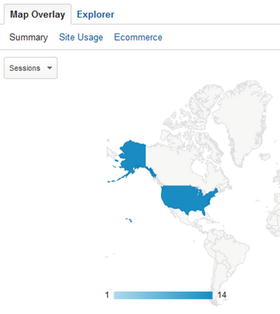
Then there is also a breakdown of which sessions were from which areas:
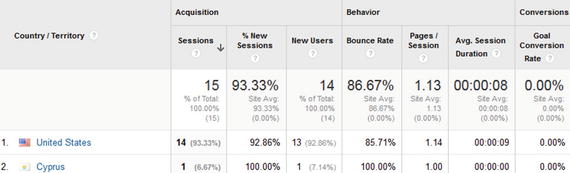
For example, I’m not entirely sure why there was a visitor from Cyprus, but they didn’t appear to stay on the site too long (and average session duration of 0).
Using Campaigns and Ongoing Blog Posts
With analytics , it’s probably fair to say that the best way to learn the value, and learn how to optimize, is alongside an ongoing campaign of some kind, and/or a web site that has an ongoing set of visitors. If you’re just starting out, exploring and playing with some of the options in Google Analytics can teach you a few tools that you can keep in mind for when you’re in that situation. I personally believe that making an ongoing blog is a good general learning experience, as well as a source of traffic.
Dare I say that you can think of analytics as a party? Invite people from all over the world, give them something enjoyable, meaningful, or relevant to experience, and then see what they do. That’s analytics !
Looking at Trends
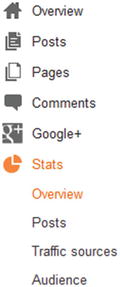
One concept in analytics that’s helpful to explore, file away, and burn into your synapses is the idea of trending. It basically means looking at how things perform over time. You look at the trends. An easy way to get a sense of trending is to go directly into Blogger and click on the Stats link. You’ll see a simplified set of analytics.
So the 2069.us blog has been around for a while. It is a personal blog that hasn’t been promoted extensively, but has seen some traffic.
The Stats function in Blogger opens up to the Week tab:
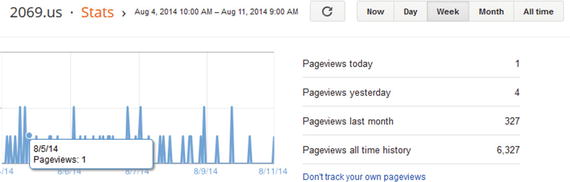
If you click in the All Time tab (upper right), it shows a longer view, and the longer your blog has been around, the more you can see trends. In theory, with a consistent application of effort (adding quality content, making some effort to promote, getting listed on some other sites), you will see a boost in the amount of traffic.
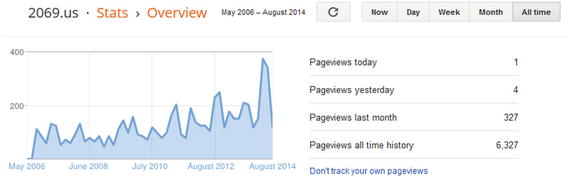
On the left, since 2006 that is, we see that there has been a fairly gradual growth in the amount of traffic. This is a good trend —at least it’s not going down.
Dealing with Spam Traffic and Bots
One issue to be aware of when monitoring traffic to web sites and blogs is that sometimes there are automated bots that appear like regular users. In theory, this traffic is filtered out, but part of the point is to think critically and dig beneath the surface. In Blogger, you can look at traffic sources, which is also an interesting way to learn more about your web site. You can see where your visitors are coming from.
For example, it appears that a large proportion of traffic is coming from semalt.com. What’s that?
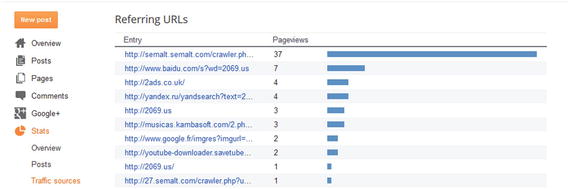
It looks like it is some kind of web promotion service. It’s not a news site or blog. It looks like some kind of automated crawler that would get noticed by an analyst.
The longer a web site or blog is around, the more some of these traffic sources will result in true referrals—where people linked to your web site or blog because they like it. The idea is to keep an eye on traffic sources. In some cases, you might be able to establish a relationship with the traffic source and let them know when you have a new blog post or product.
As it is, because 2069.us hasn’t been updated in a while, it looks like it’s getting mostly automated traffic. Another traffic source is baidu, a Chinese search engine. I have no idea how the blog ended up on the site, or why people would visit it, but maybe it was just interesting enough to generate a few clicks .
Looking at Traffic in Google Analytics
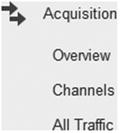
You can also look at traffic in Google Analytics (in a deeper way). Try clicking on Acquisition ➤ All Traffic:
At this stage, I just recommend exploring and trying things out. There will be plenty of time to dive into documentation and details later. For now, try to treat Google Analytics like an amusement park, where you try to find things that are amusing. Who said data can’t be fun?
Tracking Mobile Hits
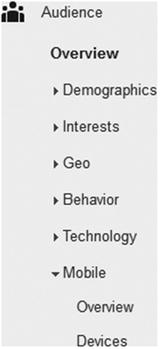
If you were starting to doze off in the previous sections, maybe the idea of tracking mobile hits will get your attention. It’s a hot, growing wildly successful area in consumer electronics, apps, and web site development. Analytics gives you a way to look at mobile hits. For example, in Google Analytics, go to Audience ➤ Mobile:
It can be interesting to see the percentage of your traffic coming from different devices :
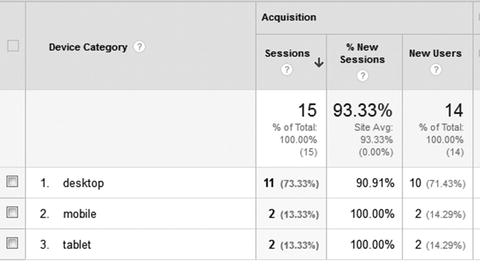
This represents another way that analytics can be used to deliver value to a business. Do they know the percentage of traffic coming from mobile? What is the trend? Is mobile traffic increasing? This might mean that the business or organization needs to pay more attention to being mobile friendly.
If you start making your site more mobile friendly or use mobile advertising, analytics can help you measure the impact. The ROI. Remember that ROI is the Holy Grail!
You could look at the trend toward mobile device usage. You can look at it before your site was mobile friendly, as well as after. Is there a difference? Hopefully there will be. Business owners, people in organizations, pay very close attention to this kind of information. It is very, very valuable. You can see clearly the impact of initiatives, of spending time and money on campaigns and improvements.
This is why analytics is so important. See how it works? Just something to keep in mind as you’re learning to use it. It’s an important piece of the pie.
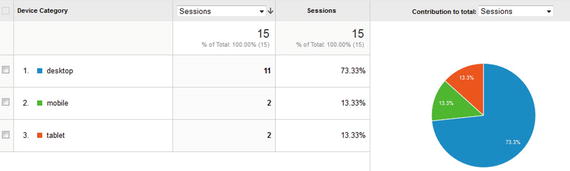
Another issue to consider is the way the information comes across. For example, a chart is one thing, but why not a pie graph? In Google Analytics, you can click in the little row of icons to get a pie graph in this view of mobile:
It opens a color-coded view that is easier to consume.
At a single glance, you see that overall mobile traffic is a quarter of the total traffic (mobile devices and tablets, which fall into the mobile category as well).
As you begin to look at these kinds of things, you can start to ask interesting questions, in a kind of “mix and match” mentality.
For example, what is the bounce rate for mobile traffic to your web site? A higher bounce rate on mobile devices might indicate that the site isn’t mobile friendly. But how do you check this?
I think it’s important to learn how to learn, so I recommend starting by asking these types of questions. Then see if you can figure out how to look under the hood. You can also cheat by Googling. For example, try Googling “mobile bounce rate in Google Analytics”.
Using Dashboards/Reports
When you’re in the position of looking at web analytics for your own site or for someone else’s, you can manually go into the tool and find items. However, this can be time consuming, and Google Analytics includes dashboards and reports you can create to make your life easier.
In Google Analytics, click on Reporting at the top:
Then choose Dashboards ➤ New Dashboard:
Then select Starter Dashboard and change Untitled Dashboard to whatever name you like:
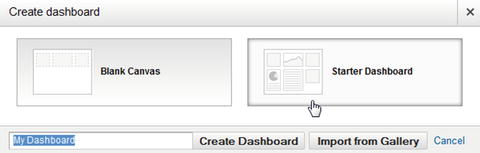
Finally, click Create Dashboard.
Next, you will probably want to set a date range. There’s nothing wrong with the default, but setting date ranges is part of the way you get the information that’s most relevant .
To change the date range, click on the little triangle to the right of the dates that show:
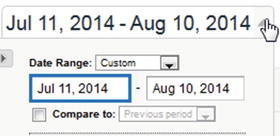
Consider the preset options, such as Last Week, which might be a good date range for a regular, weekly report:
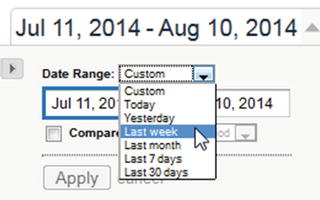
After you select a date range , click Apply:
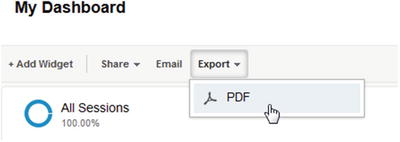
Exporting and Scheduling Reports
Next you may want to manually export a report, in order to share it with colleagues or clients . To do this, you click Export and select PDF:
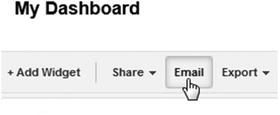
I also recommend setting up a scheduled report via e-mail. To do this, click Email:
Then enter an e-mail address to send the report to:
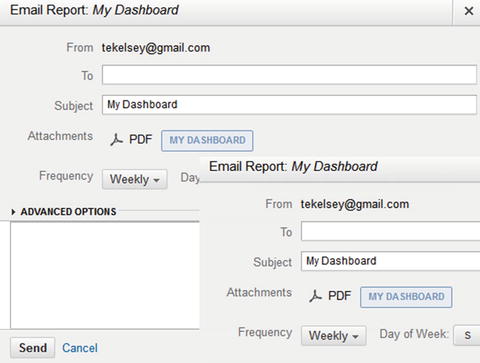
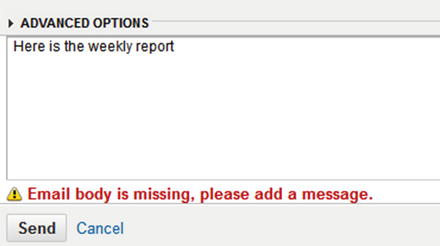
Then click in the main area and add a message, such as, “Here is the weekly report”. Then click Send:
You can always come back to Dashboards to adjust your options :

If you went through these steps, you have fully entered the world of web analytics. You looked at traffic and performance and then set up some reporting so that you can monitor traffic on an ongoing basis. Woo-hoo!
Learning More
Aside from the Google searches mentioned earlier, I recommend exploring Google Analytics. When you come across something you’re interested in, do a Google search on the concept.
To synthesize your learning, I also recommend making a blog post, discussing what you’re learning, including the questions you have, and asking people for comment.
You might also be interested in a little light viewing/reading:
Basic Concepts in Web Analytics: http://ramonlapenta.com/blog/basic-concepts-of-web-analytics
A Web Analytics Slide Presentation: http://www.slideshare.net/mattPROv1/web-analytics-concepts-theories
Bounce Rate: https://support.google.com/analytics/answer/1009409?hl=en
Conclusion
Congratulations! You just made it through a significant set of milestones. You broke through the data barrier, created some traffic, learned how to view data using various tools, experimented with multiple social media channels, and looked at behavioral data. Just getting your feet wet in these areas is impressive. Good job!
If there’s any way for you to have the right mindset that will help you get through the material and master the tool, I do believe that fun can pave the way. Hopefully, you can find something interesting when creating your own site, trying to promote it a little, and looking at how consistent effort over time can have an impact. I argue that web analytics is a critical part of marketing partly because of inspiration. That is, when you see the impact, the results of your effort, it inspires you to pursue things consistently over time.
This translates into fiscal ROI and an impact in a business setting. When you trace impact, you can show how important it is to make adjustments and show the importance of the online marketing efforts. It really helps, and it definitely gets attention. Instead of guessing and hoping, you get a clear sense of what’s going on.