Chapter 6
Investigating and Purchasing Individual Stocks
In This Chapter
![]() Looking at the best research resources
Looking at the best research resources
![]() Figuring out what those annual reports really mean
Figuring out what those annual reports really mean
![]() Deciphering 10-Ks, 10-Qs, and proxies
Deciphering 10-Ks, 10-Qs, and proxies
![]() Placing stock trades
Placing stock trades
This chapter provides a crash course in researching individual companies and their stocks. Be sure you consider your reasons for taking this approach before you head down the path of picking and choosing your own stocks. If you haven’t already done so, take a look at Chapter 5 to better understand the process of purchasing stocks on your own.
If you decide to tackle the task of researching your own stocks, you don’t have to worry about finding enough information: The problem to worry about is information overload. You can literally spend hundreds of hours researching and reading information on one company alone. Therefore, you need to focus on where you can get the best bang for your buck and time.
Building on Others’ Research
If you were going to build a house, you probably wouldn’t try to do it on your own. Instead, you’d likely find some sort of kit or a set of plans drawn up by people who have built many houses. You can do the same when picking individual stocks. In the following sections, I highlight useful resources that allow you to hit the ground running when you’re trying to pick the best stocks. In addition to the resources I cover here, check out Part V for other useful resources for researching individual stocks.
Discovering the Value Line Investment Survey
 Value Line is an investment research company. Value Line’s securities analysts have been tracking and researching stocks since the Great Depression. Their analysis and recommendation track record is quite good, and their analysts are beholden to no one. Many professional money managers use the Value Line Investment Survey, a Value Line weekly newsletter, as a reference because of its comprehensiveness.
The beauty of Value Line’s service is that it condenses the key information and statistics about a stock (and the company behind the stock) to a single page. Suppose you’re interested in investing in Starbucks, the retail coffeehouse operator. You’ve seen all its stores, and you figure that if you’re going to shell out more than $3 for a cup of its flavored hot water, you may as well participate in the profits and growth of the company. You look up the recent stock price (I explain how to do so later in this chapter if you don’t know how) and see that it’s about $75 per share.
Take a look at the important elements of the Value Line Investment Survey page for Starbucks in Figure 6-1.
 The information in Value Line’s reports is in no way insider information. Look at these reports the same way that you review a history book: They provide useful background information that can keep you from repeating common mistakes.
1. Business
This section of the report describes the business(es) that Starbucks participates in. You can see that Starbucks is the largest retailer of specialty coffee in the world. Although 88 percent of the company’s sales come from retail, note that 12 percent come from other avenues — such as mail-order, online, and supermarket sales. You also find details about joint ventures, such as Starbucks’ partnerships with Pepsi and Dreyer’s to develop and sell bottled coffee drinks and ice creams, respectively. This section also shows you that the senior executives and directors of the company own a sizeable stake (3.3 percent) of the stock; seeing that these folks have a financial stake in the success of the company and stock is a good thing.
2. Analyst assessment
A securities analyst (in this case, Justin Hellman) follows each Value Line Investment Survey stock. An analyst focuses on specific industries and follows a few dozen stocks. This section of the Value Line report provides the analyst’s summary and commentary of the company’s current situation and future plans.

Copyright 2014 by Value Line, Inc.
Reprinted by Permission; All Rights Reserved. Value Line, The Value Line Investment Survey, Timeliness, and Safety are trademarks or registered trademarks of Value Line Inc. and/or its affiliates in the United States and other countries.
Figure 6-1: Value Line Investment Survey report on Starbucks.
3. Value Line’s ratings
The Value Line Investment Survey provides a numerical ranking for each stock’s Timeliness (expected performance) over the next year. One is highest and 5 is lowest, but only about 5 percent of all stocks receive these extreme ratings. A 2 rating is above average and a 4 rating is below average; about one-sixth of the ranked stocks receive each of these ratings. All remaining stocks — a little more than half of the total ranked — get the average 3 rating.
The Safety rating works the same way as the Timeliness rating, with 1 representing the best and least volatile stocks and the most financially stable companies. Five is the worst Safety ranking; it denotes the most volatile stocks and least financially stable companies.
Starbucks’ current ratings are 3 for Timeliness, which is average, and 2 for Safety, which is above average. I’ve never been a fan of predictions and short-term thinking. (One year is a very short period of time for the stock market.) However, historically, Value Line’s ranking system has held one of the best overall track records according to the Hulbert Financial Digest, which tracks the actual performance of investment newsletter recommendations. Even so, you shouldn’t necessarily run out and buy a particular stock because of its high ranking. Just keep in mind that higher-ranked stocks within the Value Line Investment Survey have historically outperformed those without such ratings.
4. Stock price performance
The graph in Figure 6-1 shows you the stock price’s performance over the past decade or so. The highest and lowest points of the line on the graph indicate the high and low stock prices for each month. At the top of the graph, you see the year’s high and low prices. Starbucks stock has risen significantly since the company first issued stock in 1992, but Starbucks certainly has experienced some down periods. (The small box in the lower-right corner of the graph shows you the total return that an investor in this stock earned over the previous one, three, and five years and compares those returns to the average stock. The graph in Figure 6-1 shows you that Starbucks declined significantly from 2006 through 2008 but has since rebounded smartly.)
The graph also shows how the price of the stock moves with changes in the company’s cash flow (money coming in minus money going out). The solid line in the Starbuck’s graph represents 19.5 times the company’s cash flow. Over time, just as stock prices tend to track corporate profits, so, too, should they generally follow cash flow. Cash flow is an important measure of a company’s financial success and health — it’s different from net profits, which the company reports for tax purposes. For example, the tax laws allow companies to take a tax deduction each year for the depreciation (devaluation) of the company’s equipment and other assets. Although depreciation is good because it helps lower a company’s tax bill, subtracting it from the company’s revenue gives an untrue picture of the company’s cash flow. Thus, in calculating a company’s cash flow, you don’t subtract depreciation from revenue.
5. Historic financials
This section shows you 12 to 18 years of financial information on the company (in the case of Starbucks, you get information going back to just 1998). The two most helpful pieces of information in this section are
- Book value per share: This number indicates the value of the company’s assets, including equipment, manufacturing plants, and real estate, minus any liabilities. Book value gives somewhat of a handle on the amount that the company can sell for if it has a “going-out-of-business sale.” I say somewhat because the value of some assets on a company’s books isn’t correct. For example, some companies own real estate, bought long ago, that is worth far more than the company’s current financial statements indicate. Conversely, some manufacturers with equipment find that if they have to dump some equipment in a hurry, they need to sell the equipment at a discount to entice a buyer.
The book value of a bank, for example, can mislead you if the bank makes loans that won’t be paid back, and the bank’s financial statements don’t document this fact. All these complications with book value are one of the reasons full-time, professional money managers exist. (If you want to delve more into a company’s book value, you need to look at other financial statements, such as the company’s annual report, which I discuss in the section “Understanding Annual Reports” later in this chapter.)
- Market share: For some companies (not Starbucks), the Value Line Investment Survey also provides another useful number in this section of the report: the market share, which indicates the portions of the industry that the company has captured in a given year. A sustained decline in a company’s market share is a dangerous sign that may indicate its customers are leaving for other companies that presumably offer better products at lower prices. But a decline in market share doesn’t necessarily mean that you should avoid investing in a particular company. You can produce big returns if you identify companies that reposition and strengthen their product offerings to reverse a market share decrease.
6. P/E ratio
This section tells you that Starbucks sells at a P/E (price-to-earnings ratio) of 27.9 because of its recent stock price and earnings. This particular P/E is higher than that of the overall market. (You can see that Starbucks’ P/E is 1.54 times that of the overall market.) To understand the importance of P/E in evaluating a stock, see Chapter 5.
7. Capital structure
This section summarizes the amount of outstanding stocks and bonds that the company possesses. Remember that when a company issues these securities, it receives capital (money). The most useful number to examine in this section is the company’s debt. If a company accumulates a lot of debt, the burden of interest payments can create a real drag on profits. If profits stay down for too long, debt can even push some companies into bankruptcy.
Figure 6-1 shows you that Starbucks has an outstanding debt of $2,048 million. But how do you know if this is a lot, a little, or just the right amount of debt?
Possessing a larger cushion to cover debt is more important when the company’s business is volatile. You can calculate total interest coverage, which compares a company’s annual profits to the yearly interest payments on its total debt. This number tells you the number of years that the company’s most recent annual profits can cover interest on all the company’s debt.
For example, if a company has a total interest coverage of 4.5x, the company’s most recent yearly profits can cover the interest payments on all debt for about 4½ years. Starbucks’ most recent annual profits of $1,722 million dwarf its interest payments of $60 million by a factor of more than 28 to 1. Warning signs for total interest coverage numbers include a steep decline in this number over time and profits that cover less than one year’s worth of interest.
8. Current position
This section provides a quick look at how the company’s current assets (assets that the company can convert into cash within a year relatively easily) compare with its current liabilities (debts due within the year). Trouble may be brewing if a company’s current liabilities exceed or are approaching its current assets.
 Some financial analysts calculate the quick ratio. The quick ratio ignores inventory when comparing current assets to current liabilities. A company may have to dump inventory at a relatively low price if it needs to raise cash quickly. Thus, some analysts argue, you need to ignore inventory as a current asset.
9. Annual rates
This nifty section can save wear and tear on your calculator. The good folks at Value Line calculate rates of growth (or shrinkage) on important financial indicators, such as sales (revenues) and earnings (profits) over the past five and ten years. This section also lists Value Line’s projections for the next five years.
 Projections can prove highly unreliable, even from a research firm as good as Value Line. In most cases, the projections assume that the company will continue as it has in the most recent couple years.
10. Quarterly financials
For the most recent years, the Value Line Investment Survey shows you an even more detailed quarterly breakout of sales and profits, which may disclose changes that annual totals mask. In this section of the report, you can also see the seasonality of some businesses. Starbucks, for example, tends to have its slowest quarter in the winter (quarter ending March 31). This trend makes sense if you figure that many of the customers who frequent Starbucks’ coffee shops do so as they walk around town, which people tend to do less of on blustery winter days.
Considering independent brokerage research
If you’re going to invest in individual stocks, you need a brokerage account. In addition to offering low trading fees, the best brokerage firms allow you to easily tap into useful research, especially through the firm’s website, that you can use to assist you with your investing decisions.
Because discount brokers aren’t in the investment banking business of working with companies to sell new issues of stock, discount brokers have a level of objectivity in their research reports that traditional brokers (ones like Merrill Lynch, Morgan Stanley, and so on) too often lack. Some discount brokers, such as Charles Schwab, produce their own research reports, but most discount brokers simply provide reports from independent third parties. See Chapter 9 for how to select a top-notch brokerage firm.
Examining successful money managers’ stock picks
 To make money in stocks, you certainly don’t need an original idea. In fact, it makes sense to examine what the best money managers are buying for their portfolios. Don’t worry; I’m not suggesting that you invade their privacy or ask rude questions!
Mutual fund managers, for example, are required to disclose at least twice a year what stocks they hold in their portfolio. You can call the best fund companies and ask them to send their most recent semiannual reports that detail their stock holdings, or you can view those reports on many fund companies’ websites. (See Chapter 8 for more information on the best stock mutual funds.)
Through its website, Morningstar (www.morningstar.com) allows you to see which mutual funds hold large portions of a given stock that you may be researching and what the success or lack thereof is of the funds that are buying a given stock.
Finally, you can follow what investment legend Warren Buffett is buying through his holding company, Berkshire Hathaway. If you’d like to review Berkshire’s complete corporate filings on your own, visit the Securities and Exchange Commission website at www.sec.gov.
Reviewing financial publications and websites
Many publications and websites cover the world of stocks. But you have to be careful. Just because certain columnists or publications advocate particular stocks or investing strategies doesn’t mean you’ll achieve success by following their advice.
The following publications offer useful columns and commentary, sometimes written by professional money managers, on individual stocks: Barron’s, Bloomberg Business Week, Forbes, Kiplinger’s, and The Wall Street Journal. In addition, hundreds of websites are devoted to stock picking. I name my favorite investing sites in Chapter 19.
Understanding Annual Reports
After you review the Value Line Investment Survey page on a company and want to dig further into financial documents, the next step is to ask yourself why. Why do you want to torture yourself so?
After successfully completing one of the better MBA programs (Stanford’s), taking more than my fair share of accounting and finance courses, and then living and working in the real world, I’ve gotten to know investment managers and financial analysts who research companies. Although some financial documents aren’t that difficult to read (I show you how in this section), interpreting what they mean in respect to a company’s future isn’t easy.
All publicly traded companies must annually file certain financial documents. Consider reviewing these documents to enhance your understanding of a company’s businesses and strategies rather than for the predictive value that you may hope they provide.
The first of such useful documents that companies produce is the annual report. This yearly report provides standardized financial statements as well as management’s discussion about how the company has performed and how it plans to improve its performance in the future. If you’re a bit of the skeptical sort, as I am, you may think, “Aren’t the company’s officials going to make everything sound rosy and wonderful?”
To a certain extent, yes, but not as badly as you may think, especially at companies that adhere to sound accounting principles and good old-fashioned ethics. First, a large portion of annual reports include the company’s financial statements, which an accounting firm must audit. However, audits don’t mean that companies and their accounting firms can’t (often legally) structure the company’s books to make them look rosier than they really are. And some companies have pulled the wool over the eyes of their auditors, who then become unwitting accomplices in producing false financial figures.
You’ve surely heard of the accounting scandals at companies such as Enron and WorldCom. These companies manipulated their financial books, with the blessing of supposedly blue-chip corporate auditors, to mislead investors into believing that the companies were more profitable than they really were. (Identifying trouble before other investors do is a skill that many professional investors haven’t mastered. If you can identify trouble early, go manage other people’s money!)
Also keep in mind that more than a few companies have been sued for misleading shareholders with inflated forecasts or lack of disclosure of problems. Responsible companies try to present a balanced and, of course, hopeful perspective in their annual reports. Most companies’ annual reports are also written by non-techno geeks, so you have a decent chance of understanding them.
The following sections walk you through the three main elements of the standard annual report: financial and business highlights, the balance sheet, and the income statement.
Financial and business highlights
The first section of most annual reports presents a description of a company’s recent financial highlights and business strategies. You can use this information to find out about the businesses that the company is in and where the company is heading. For example, in Figure 6-1, the Value Line Investment Survey report mentions that Starbucks is also in the specialty sales business. Starbucks’ annual report can provide more detail about that specialty sales business.
Okay, enough about the coffee business; it’s time to expose you to another industry. T. Rowe Price is a publicly traded investment management company that offers some good mutual funds.
Balance sheet
You can find a company’s hard-core financials in the back portion of most annual reports. (You can find many of these same numbers in Value Line Investment Survey reports, but you get more specific details in the company’s annual report.) All annual reports contain a balance sheet, which is a snapshot summary of all the company’s assets (what the company owns) and liabilities (what the company owes). The balance sheet covers the company’s assets and liabilities from the beginning of the year to the last day of the company’s year-end, which is typically December 31. Some companies use a fiscal year that ends at other times of the year.
A company’s balance sheet resembles a personal balance sheet. The entries, of course, look a little different because you likely don’t own things like manufacturing equipment. Figure 6-2 shows a typical corporate balance sheet.
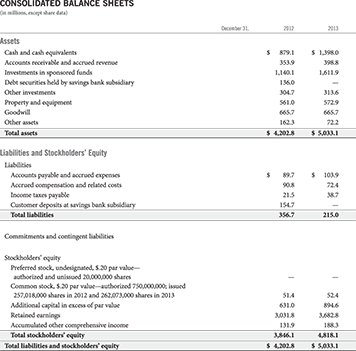
Source: T. Rowe Price Associates, Inc. 2013 Annual Report
Figure 6-2: The balance sheet from a T. Rowe Price annual report.
Assets
The assets section of the balance sheet lists the following items that a company holds or owns that are of significant value:
- Cash: I suspect that you know what cash is. Lest you think that stacks of green bills sit around in corporate vaults, rest assured that companies invest this money to earn interest. Explanatory notes often follow the balance sheet to explain certain items in more detail.
- Accounts receivable: This item represents money that is owed to the company, such as customer invoices that haven’t been paid yet.
 As companies grow, their accounts receivable usually do, too. Watch out for cases where the receivables grow faster than the sales (revenue). This growth may indicate that the company is having problems with its products’ quality or pricing. Unhappy customers pay more slowly or demand bigger price discounts.
 - Investments: In addition to cash, some companies may invest in other securities, such as bonds and stocks. Just as with your own personal situation, companies usually invest money that they don’t expect to use in the near future.
- Property and equipment: All companies need equipment to run their businesses. This equipment can include office furniture, computers, real estate they own, and manufacturing machinery that companies use to make their products. Equipment becomes less valuable over time, so a company must consider this depreciation as a cost of doing business each year. Therefore, if a company ceases buying new equipment, this entry on the balance sheet gradually decreases because the company continues to subtract the depreciation from the value of the equipment.
- Goodwill: One of the assets that doesn’t show up on most companies’ balance sheets is their goodwill. Companies work hard through advertising, product development, and service to attract and retain customers and to build name-brand recognition.
Companies can’t put a value on the goodwill that they’ve generated, but when they purchase (acquire) another firm, some of the purchase price is considered goodwill. Specifically, if a company is acquired for $100 million but has a net worth (assets minus liabilities) of just $50 million, the extra $50 million goes to goodwill. The goodwill then becomes an asset on the acquiring company’s balance sheet.
- Other assets: This catch-all category may include some stuff that can make your eyes glaze over. For example, companies keep a different set of books for tax purposes (yes, this is legal). Not surprisingly, companies do so because the IRS allows, in some cases, more deductions than what the company is required to show from an accounting standpoint on their financial statements. (If you were a company, wouldn’t you want your shareholders, but not the IRS, to see gobs of profits?) Companies treat tax deferment as an asset until the IRS receives more of its share down the road.
Manufacturing and retail companies also track and report inventory (the product that hasn’t yet been sold) as an asset. Generally speaking, as a business grows, so does its inventory. If inventory grows more quickly than revenue, such growth may be a warning sign. This growth can indicate that customers are scaling back purchases and that the company miscalculated and overproduced. It can also be a leading indicator of an obsolete or inferior product offering.
Liabilities
This section of the balance sheet summarizes all the money that a company owes to other entities:
- Accounts payable: When a company places orders to purchase things for its business, it sometimes has a lag between receiving a bill and paying it; the money owed is called accounts payable. As with inventory and accounts receivable, accounts payable generally increase with a company’s increasing revenue.
If accounts payable increase faster than revenue, the company may have a problem. On the other hand, that increase can also be a sign of good financial management. The longer you take to pay your bills, the longer you have the money in your pocket working for you.
- Accrued compensation: This line tallies money that the company must someday pay its employees. For example, many larger firms maintain pension plans. These plans promise workers who retire with at least five years of service a monthly income check in retirement. Thus, the company must reserve this money that it owes and list it as a liability or debt that it must someday pay.
- Income taxes payable: Companies are in business to make a profit, and as they earn those profits, they need to reserve a portion to pay income taxes. As I explain in the preceding section, some of the taxes that the company owes can be the result of accounting differences between the company’s financial statements and those filed with the IRS.
- Dividends payable: Not all companies pay dividends (see Chapter 4) to their shareholders. But those companies that do pay dividends typically declare the dividend several weeks in advance of when they actually owe the dividend. During this interim period, the company lists the not-yet-paid dividends as a liability.
Stockholders’ equity
The difference between a company’s assets and liabilities is known as stockholders’ equity. Stockholders’ equity is what makes balance sheets always balance.
When companies issue stock, they receive cash, which they then list as an asset. Companies divide stock proceeds between par value and capital in excess of par value. In the case of T. Rowe Price (see Figure 6-2), the par value is $0.20 per share. Par values are arcane — and largely meaningless.
Income statement
The other big financial statement in an annual report is the income statement (see Figure 6-3 for a T. Rowe Price income statement). I discuss the elements of a corporate income statement next.
Revenue
Revenue is simply the money that a company receives from its customers as compensation for its products or services. Just as you can earn income from your job(s) as well as from investments and other sources, a company can make money from a variety of sources. In the case of mutual fund provider T. Rowe Price, the firm collects fees (investment advisory and administrative) for the mutual fund investments that it manages on behalf of its customers as well as privately managed money for wealthy individuals and institutions. The company also receives income from its own money that it has invested.
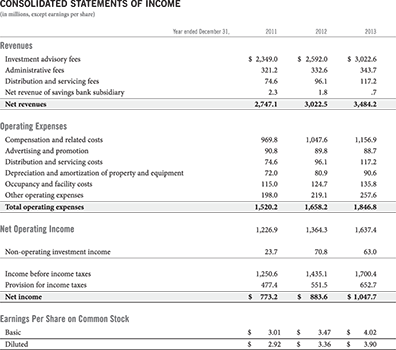
Source: T. Rowe Price Associates, Inc. 2013 Annual Report
Figure 6-3: A T. Rowe Price income statement.
Ideally, you want to see a steady or accelerating rate of growth in a company’s revenue. If a company’s revenue grows more slowly, you need to inquire why. Is it because of poor service or product performance, better competitor offerings, ineffective marketing, or all the above?
For companies with multiple divisions or product lines, the annual report may detail the revenue of each product line in a later section. If it doesn’t, check out some of the other financial statements that I recommend in the next section, “Exploring Other Useful Corporate Reports.” Examine what spurs or holds back the company’s overall growth and which different businesses the company operates in. Look for businesses that were acquired but don’t really fit with the company’s other business units as a red flag. Large companies that have experienced stalled revenue growth sometimes try to enter new businesses through acquisition but then don’t manage them well because they don’t understand the keys to their success.
When researching retail stores, such as restaurant chains (for example, McDonald’s) or clothing stores (for example, The Gap), examine the revenue changes that come from opening new locations versus the changes at existing locations, sometimes referred to as same stores. Be concerned if you find that a company’s revenue growth comes from opening new locations rather than growth at existing locations. This situation may indicate that opening more locations is masking weakness in the company’s business.
Expenses
Just as personal income taxes and housing, food, and clothing expenses gobble up much of your personal income, company expenses use up much, and sometimes all, of a company’s revenue.
Even healthy, growing businesses can get into trouble if their expenses grow faster than their revenues. Well-managed companies stay on top of their expenses during good and bad times. Unfortunately, it’s easy for companies to get sloppy during good times.
It’s particularly useful to examine each category of expenses relative to (in other words, as a percentage of) the company’s revenue to see which ones grow or shrink. As a well-managed and financially healthy company grows, expenses as a percentage of revenue should decrease. In turn, profits as a percentage of revenue increase.
T. Rowe Price’s total operating expenses relative to total revenues have decreased, while profits (net operating income) relative to total revenues have increased. Not all expense categories necessarily decrease.
Net income calculations
The net result of expenses that increase more slowly than revenues is a fatter bottom line. Sometimes companies experience one-time events, such as the sale of a division, which can change profits temporarily. Companies usually list these one-time events in the section under expenses.
I encourage you to review the company’s statement of cash flows included in its annual report. Cash can flow into and out of a company from normal business operations, investment activities, and financing activities. Sometimes a company may report higher profits but actually be facing decreased cash flow from operations, for example, if its customers are getting slower with paying bills (which could indicate that its customers are having financial problems or that they’re unhappy with the product or service being provided).
Earnings per share
Last but not least, and of great importance to shareholders, is the calculation of earnings per share. Higher profits per share generally help fuel a higher stock price, and declining profits feed falling stock prices. Remember, though, that smart financial market participants are looking ahead, so if you run out to buy stock in a company that’s reporting higher profits, those higher profits are old news and likely have already been priced into the company’s current market value.
Exploring Other Useful Corporate Reports
In addition to annual reports, companies produce other financial statements, such as 10-Ks, 10-Qs, and proxies, that you may want to peruse. You can generally obtain these reports from the companies’ websites, from the companies’ investor relations departments, or from the Securities and Exchange Commission website, www.sec.gov (see Chapter 19 for more on this site).
10-Ks
10-Ks are expanded versions of the annual report. Most investment professionals read the 10-K rather than the annual report because the 10-K contains additional data and information, especially for a company’s various divisions and product lines. Also, 10-Ks contain little of the verbal hype that you find in most annual reports. In fact, the 10-K is probably one of the most objective reports that a company publishes. If you’re not intimidated by annual reports or if you want more company meat, read the 10-Ks from the companies you want to check out.
10-Qs
10-Qs provide information similar to the 10-K but on a quarterly basis. 10-Qs are worth your time if you like to read reasonably detailed discussions by management of the latest business and financial developments at a certain company. However, I recommend leaving the research to Value Line’s analysts (see the earlier section “Discovering the Value Line Investment Survey”).
The financial data in 10-Qs is unaudited and not of great use for the long-term investor. But if you want to watch your investments like a hawk and try to be among the first to detect indications of financial problems (easier said than done), this report is required reading.
Some companies go back to restate their quarterly financials. Remember that the accountants haven’t fully approved these interim numbers. Companies may take their financial lumps in one quarter to get problems behind them, so one bad quarter doesn’t necessarily indicate a harmful long-term trend.
Proxies
The final corporate document that you may want to review is the annual proxy statement, which companies send out to their shareholders in advance of their annual meeting. The proxy statement contains some of the more important financial information and discussions that you can find in the 10-K. It also contains information on other corporate matters, such as the election of the board of directors. (Directors — who are usually corporate executives, lawyers, accountants, and other knowledgeable luminaries — serve as sounding boards, counselors, and sometimes overseers to the management team of a company.)
The proxy statement becomes much more important when a company faces a takeover or some other controversial corporate matter, such as the election of an alternative board of directors. As a shareholder, you get to vote on proposed board members and on select other corporate issues, which you can read about in the proxy statement.
The proxy statement tells you who serves on the board of directors as well as how much they and the executives of the company are paid. At annual meetings, where the board of directors discusses proxy statements, shareholders sometimes get angry and ask why the executives are paid so much when the company’s stock price and business underperform.
Getting Ready to Invest in Stocks
There’s always a chorus of self-anointed gurus saying that you can make fat profits if you pick your own stocks.
Unless you’re extraordinarily lucky or unusually gifted at analyzing company and investor behavior, you won’t earn above-average returns if you select your own stocks.
Keep the amount that you dedicate to individual stock investments to a minimum — ideally, no more than 20 percent of your invested dollars. I encourage you to do such investing for the educational value and enjoyment that you derive from it, not because you smugly think you’re as skilled as the best professional money managers. (If you want to find out more about analyzing companies, read the chapters in Part IV on small business as well as the chapters in Part V on investing resources.)
Understanding stock prices
Just about every major financial and news site on the Internet offers stock quotes for free as a lure to get you to visit the site. To view a stock price quote online, all you need is the security’s trading symbol (which you obtain by using the stock symbol look-up feature universally offered with online quote services). Most major newspapers print a listing of the prior day’s stock prices. Daily business papers, such as The Wall Street Journal and Investor’s Business Daily, also publish stock prices daily.
Cable business channels, such as Bloomberg, CNBC, and Fox Business, have stock quotes streaming across the bottom of the screen. You can stop by a local brokerage office and see the current stock quotes whizzing by on a long, narrow screen on a wall. Many brokerage firms also maintain publicly accessible terminals (that look a lot like personal computers) on which you can obtain current quotes.
The following table is a typical example of the kinds of information that you can find in daily price quotes in papers and online; the quotes in this table are for the information technology giant International Business Machines (also known as Big Blue or IBM). After the name of the company, you see the trading symbol, IBM, which is the code that you and brokers use to look up the price on computer-based quotation systems.
|
International Business Machines (IBM) | |
|
52-wk range |
172.19 – 211.98 |
|
Last trade |
4:00 pm EST (196.47) |
|
Change |
+1.36 (+0.70%) |
|
Day’s range |
194.35 – 196.86 |
|
Open |
194.38 |
|
Volume |
4,211,284 |
|
P/E ratio |
13.4 |
|
Mkt cap |
198.4B |
|
Div/Shr |
3.80 |
|
Yield |
2.00% |
Here’s a breakdown of what the information in this table means:
- 52-week range: These two numbers indicate the low ($172.19) and high ($211.98) trading prices for IBM during the past 52 weeks.
- Last trade: This line indicates the most recent price that the stock traded at (you can see that this IBM quote was from 4:00 p.m. Eastern Standard Time, which is when the New York Stock Exchange closes for the day).
- Change: This entry indicates how that price differs from the previous day’s close. In this case, you can see that the stock was up 1.36 points (0.70 percent) from the prior day’s close.
- Day’s range: These two numbers are the lowest and highest prices that the stock traded at during the day.
- Open: This line tells you the trade price at the market’s open.
- Volume: This number indicates the number of shares that traded through this point in the trading day. (To conserve space, many newspapers indicate the volume in hundreds of shares — in other words, you must add two zeros to the end of the number to arrive at the actual number of shares.)
- The P/E ratio: As I explain in Chapters 4 and 5, the P/E ratio measures the price of IBM’s stock relative to the company’s earnings or profits.
- Market capitalization (mkt cap): This number tells you the current market value of all of IBM’s stock, which in this case is $198.4 billion. You calculate this value by multiplying the current price per share by the total number of shares outstanding. (See Chapter 8 for an explanation of so-called market caps as they apply to stocks and stock funds.)
- Dividends/share (div/shr): This number shows you the current dividend (in this case, $3.80 per share), which the company pays yearly to shareholders. Most companies actually pay out one-quarter of their total annual dividend every three months.
- Yield: This number indicates the effective percentage yield that the stock’s dividend produces. To calculate the effective yield, divide the dividend by the current stock price. Thus, IBM shareholders can expect to receive a dividend worth about 2.0 percent of the current stock price.
Now you know how to read stock quotes!
Purchasing stock “direct” from companies
Numerous companies sell their stock directly to the public. Proponents of these direct stock purchase plans say that you can invest in stocks without paying any commissions. Well, the commission-free spiel isn’t quite true, and investing in such plans poses other challenges.
If you want to purchase directly from Home Depot, for example, you need a minimum initial investment of $500. Buying stock “direct” isn’t free; in the case of Home Depot, for example, you have to pay a $5 enrollment fee. Although that may not sound like much on a $500 investment, $5 represents 1 percent of your investment. For subsequent purchases, you pay 5 percent up to a maximum of $2.50 per purchase plus 5 cents per share.
If you want to sell your shares, you have to pay a fee to do that, too — $10 plus 15 cents per share. Overall, these fees compare to what you would pay to buy stock through a discount broker (see Chapter 9 for details). In some cases, these fees are actually higher! For example, you can reinvest dividends at no cost through many discount brokers.
Some direct stock purchase plans entail even more hassle and cost than the type I just discussed. With other plans, you must buy your initial shares through a broker and then transfer your shares to the issuing company in order to buy more! Also, you can’t pursue most direct stock purchase plans within retirement accounts.
Every time you want to set up a stock purchase plan with a company, you must request and complete the company’s application forms. If you go through the headache of doing so, say, a dozen times, you’re rewarded with a dozen statements on a regular basis from each individual company. Frankly, because of this drawback alone, I prefer to buy stock through a discount brokerage account that allows centralized purchasing and holding of various stocks as well as consolidated tax-reporting statements.
Placing your trade through a broker
Unless you decide to buy stock directly, you generally need a broker. As I explain in Chapter 9, discount brokers are the best way to go — they take your orders and charge far less than conventional brokerage firms, which generally pay their brokers on commission.
After you decide which discount broker you want to use (again, I provide all the info you need to make this decision in Chapter 9), request (by phone or via the Internet) an account application package for the type of account that you desire (non-retirement, IRA, Keogh, and so on). Complete the forms (call the firm’s toll-free number or visit a branch office if you get stuck) and mail or take them back to the discounter.
When you’re ready to place your order, simply call the discount broker and explain what you want to do (or use your touch-tone phone or computer to place your order). You have two options:
- Market order: I recommend placing what’s known as a market order. Such an order instructs your broker to buy you the amount of stock that you desire (100 shares, for example) at the current and best (lowest) price available. With securities in which there’s little trading or generally volatile price movements, market orders are a bit riskier. As a result, you may want to instead consider a limit order.
- Limit order: Alternatively, you can try to buy a desired stock at a specific price. For example, you can place a purchase order at $32.50 per share when the stock’s last trade was $33 per share. This type of order is known as a limit order and is good until you cancel it. I don’t recommend that you try this tactic, because it requires you to hope and gamble that the stock drops a little before it rises. If the stock simply rises from its current price of $33 per share or drops to $32.55 before it makes a big move higher, you may kick yourself. If you think that the stock is a good buy for the long haul, go buy it with a market order. If you don’t think it’s a good buy, don’t buy it.
One final word of advice: Try to buy stock in good-size chunks, such as 100 shares. Otherwise, commissions gobble a large percentage of the small dollar amount that you invest. If you don’t have enough money to build a diversified portfolio all at once, don’t sweat it. Diversify over time. Purchase a chunk of one stock after you have enough money accumulated and then wait to buy the next stock until you’ve saved another chunk to invest.