
- Contents
- Learn about JMP
- Documentation and Additional Resources
- Formatting Conventions
- JMP Documentation
- JMP Documentation Library
- Discovering JMP
- Using JMP
- Basic Analysis
- Essential Graphing
- Profilers
- Design of Experiments Guide
- Fitting Linear Models
- Specialized Models
- Multivariate Methods
- Quality and Process Methods
- Reliability and Survival Methods
- Consumer Research
- Scripting Guide
- JSL Syntax Reference
- JMP Help
- Additional Resources for Learning JMP
- Introduction to Interactive Graphing
- Graph Builder
- Explore and Visualize Data Interactively
- Overview of Graph Builder
- Example Using Graph Builder
- Launch Graph Builder
- Graph Builder Options
- Add Variables
- Change Variable Roles
- Remove Variables
- Add Multiple Variables to the X or Y Zone
- Merge Variables
- Add Multiple Variables to Grouping Zones
- Modify the Legend
- Create Map Shapes
- Additional Examples Using Graph Builder
- Example of Adding Variables
- Example of Adding Multiple Variables to the X or Y Zone
- Example of Merging Variables
- Example of Ordering Variables Using a Second Variable
- Example of Adding Multiple Variables to Grouping Zones
- Example of Replacing Variables
- Example of Overlaying Histograms
- Measure Global Oil Consumption and Production
- Analyze Popcorn Yield
- Examine Diamond Characteristics
- Overlay Plots
- Scatterplot 3D
- Contour Plots
- Bubble Plots
- Parallel Plots
- Cell Plots
- Treemaps
- Scatterplot Matrix
- Ternary Plots
- Summary Charts
- Create Charts of Summary Statistics
- Example of the Chart Platform
- Launch the Chart Platform
- The Chart Report
- Chart Platform Options
- Additional Examples of the Chart Platform
- Example Using Two Grouping Variables
- Example Using Two Grouping Variables and Two Category Variables
- Plot a Single Statistic
- Plot Multiple Statistics
- Plot Counts of Variable Levels
- Plot Multiple Statistics with Two X Variables
- Create a Stacked Bar Chart
- Create a Pie Chart
- Create a Range Chart
- Create a Chart with Ranges and Lines for Statistics
- Create Maps
- References
- Index
Chapter 6
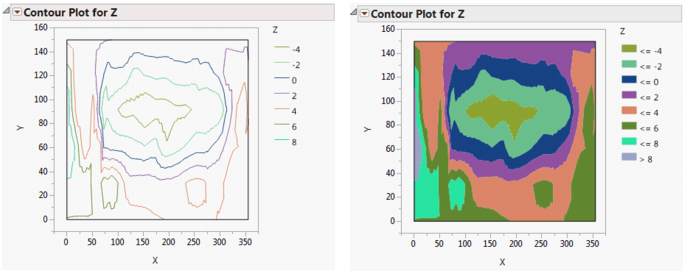
Contour Plots
View Multidimensional Relationships in Two Dimensions
The Contour Plot command in the Graph menu constructs contours of a response in a rectangular coordinate system. A contour plot shows a three-dimensional surface in two dimensions. Contours delineate changes in the third dimension.
Here are some of the options available with the Contour platform:
• specify the number of contour levels
• choose to plot contour lines or filled contours
• show or hide data points
• label contours with response values
• define and use a custom coloring scheme
Figure 6.1 Examples of Contour Plots
-
No Comment
..................Content has been hidden....................
You can't read the all page of ebook, please click here login for view all page.