
One of the most important aspects of monitoring while dealing with Microservices is the implementation of tracing or distributed tracing. We need to understand the availability of various services, check whether a service is slow, and take action accordingly. To showcase the use and importance of distributed tracing, we will implement it in our previous example using Zipkin. Zipkin is a popular and easy-to-use tool that help us implement tracing in Microservices.
This definition mentions Google's Dapper paper. This paper talks about the implementation of tracing in distributed systems that consist of multiple Microservices. This concept forms the basis of many modern tracing systems, such as Zipkin and OpenTracing. A complete discussion on Dapper is outside of scope of this chapter, but the following example should give an idea. For readers interested in the paper, check it out at https://static.googleusercontent.com/media/research.google.com/en//archive/papers/dapper-2010-1.pdf.
Coming back to Zipkin, you can download and install the Zipkin tool using the following command:
curl -sSL https://zipkin.io/quickstart.sh | bash -s
To start Zipkin independently, run the following:
java -jar zipkin.jar
Getting to the code for Microservices, we will reuse the code from the previous example. We just need to add Zipclient to our dependencies. We can either do this while creating the project on http://start.spring.io/ or add the dependencies to pom.xml.
The following screenshot shows the start.spring.io interface, this time with Zipkin Client:

The Zipkin interface lets you filter out various options:

Normally, we use Sort based on Newest First to view the latest services at the top.
The following screenshot shows various traces, with the latest listed first:
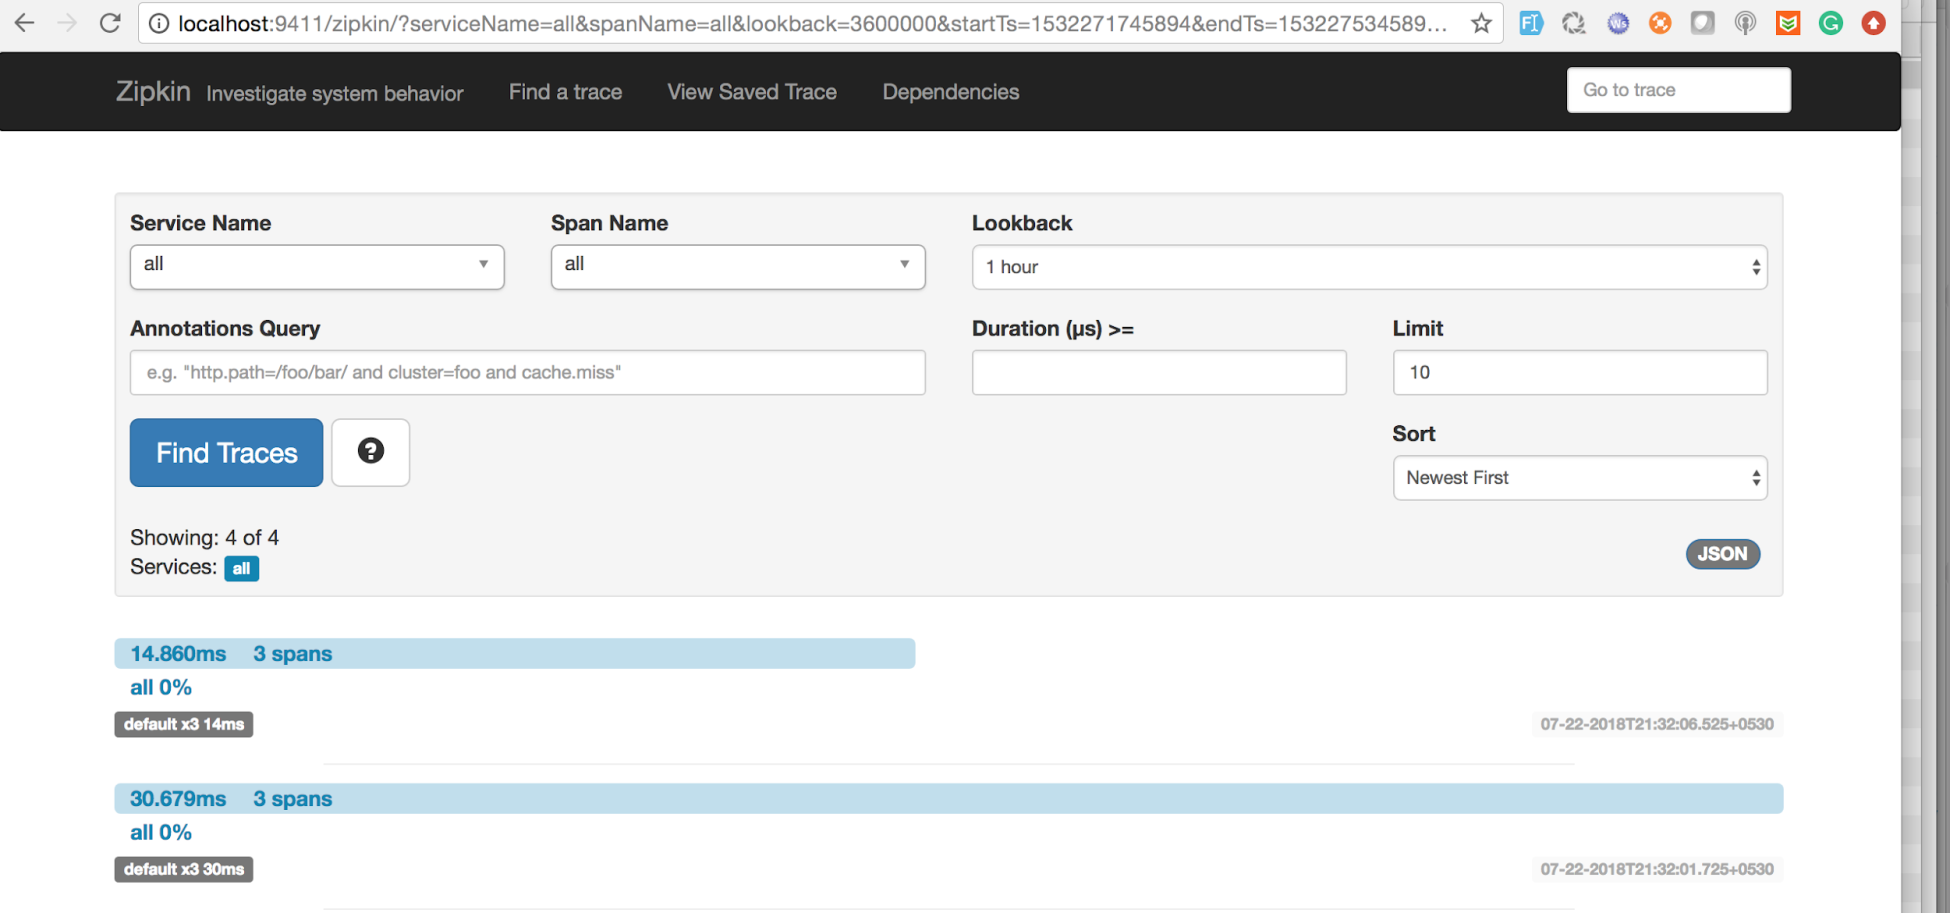
We are looking at a happy case here with services returning normally. This also shows that sometimes, the same flow might be taking more time than others. We can click on a row to further explore the flow and the time taken by different services.
The following screenshot shows a flow and how much time each Microservice is taking:

We can see the complete details for the call we made; it shows the internal calls and how much time each call is taking.
To see the advantages of Zipkin in terms of analyzing problems, let's take a look at two different cases.