
Let's try another case. Here, the API is responding very slowly. To simulate that, let's say we introduce an artificial delay of five seconds in service3:
@GetMapping("/sayhello3")
public String sayHello()
{
 try
 {
  Thread.sleep(5000);
 }
catch (InterruptedException e)
 {
  e.printStackTrace();
 }
 return("Hello from service 3.");
}
When we call the sayhello service, we see it is responding slowly. But again, we are not sure what is making the service so slow to respond. Again, let's take a look at Zipkin to see whether it can help us understand where the problem is.
The following screenshot shows the Zipkin interface:

This indicates the sayhello3 service has taken a good amount of time. To see more details, we can click on the third row for sayhello3.
The following screen appears when we click on the third row:
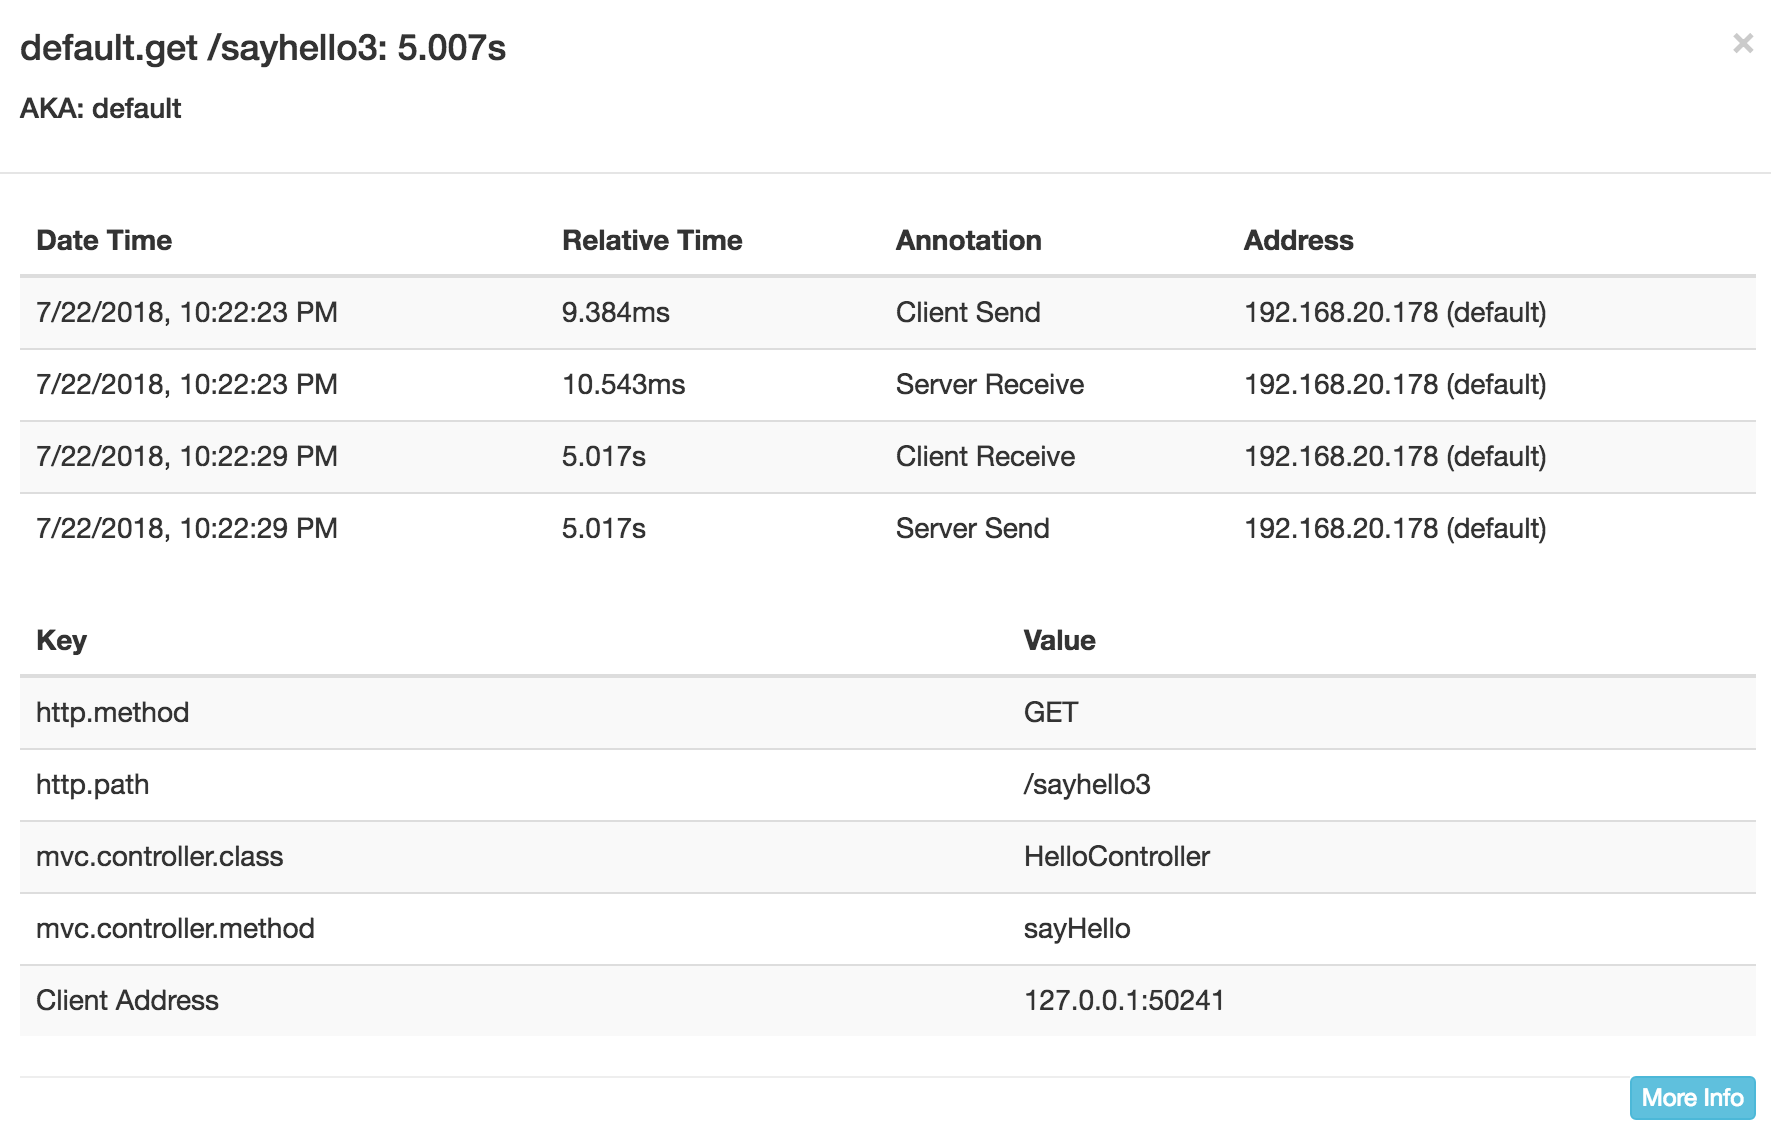
We can see most of the time is being taken by service 3 and the response time of the other two services is in milliseconds. This helps us isolate the problem area, which is service 3 in this case.
We have seen how a tool such as Zipkin can help us track errors at the Microservice level. This can be very useful in a production environment when we face an issue and need to validate which service is in a problem state.
There can be cases where you do not want to apply to trace to all the request as of course tracing comes at a cost in terms of performance (though negligible, in a production environment you want to be extra careful). Zipkin comes with an option of tracing only a sample of requests, which is configurable, such as only tracing 10% of requests.