Before JavaScript became the world's most popular programming language, it was actually looked down upon as being a quirky language that wasn't worth any real developer's time. This outlook on JavaScript was primarily caused by two issues:
Developers didn't fully understand the language.
There were no decent development tools available.
The popularity of web applications and Ajax essentially pushed JavaScript into the limelight. As a result, developers finally began to understand the language, and some of them started building development tools for JavaScript.
Today, there are a variety of tools available to developers. Probably the most important are the JavaScript debuggers present in all major browsers. With a debugger, you can pause the code execution of your script, and with a process known as stepping, you can execute the lines one at a time to find bugs in your code.
Debugging is universally necessary across all browsers and languages. Although some debugging tools offer features that other tools may not have, all debugging tools are based upon the following concepts:
Breakpoints: tell the debugger where it should break or halt code execution. You can set a breakpoint on any line in your code; the debugger will pause there.
Stepping: lets you execute one statement of code at a time. There are three ways to step through code:
Step Into: executes the next line of code. In the case of a function, the debugger executes the function and breaks at the first statement inside the function.
Step Over: also executes the next line of code. If the line is a function, the debugger executes the function and breaks at the line after the function call.
Step Out: returns to the caller when you're inside a function. It executes the function and then breaks at the return point of the function.
The call stack: records the functions and methods that executed up to the breakpoint.
The console: lets you execute JavaScript statements within the scope of the breakpoint, as well as displaying unhandled errors that may have occurred.
Although all debuggers offer support for these key concepts, and every modern browser has a JavaScript debugger, the most popular JavaScript debugger is a Firefox add-on called Firebug. Even if you don't use Firefox as your browser, you, like many other developers, may decide to install it just so you can use Firebug.
Unfortunately, Firebug does not come with Firefox by default; you have to install the add-on. You can download the latest version at www.getfirebug.com or from Mozilla's add-on site at addons.mozilla.org/en-US/firefox/addon/1843/.
Because Firebug is an add-on, you will not find an installer for your operating system. Instead, you have to visit one of the provided URLs with Firefox, click the install button on the web page, and follow the instructions. After the add-on is installed, you need to restart Firefox in order to use the new add-on.
Go ahead and install Firebug and proceed to the next section when you're ready.
By default, Firebug is not visible when you open a new Firefox window or tab. To access Firebug click the Firebug icon in the status bar at the lower right of the Firefox window. If you do not have the status bar visible you can open Firebug by clicking the Tools menu, moving your mouse over the Firebug option, and then clicking Open Firebug. Or, you can just press the F12 key on your keyboard.
Note
The F12 key will generally open a browser's developer tools.
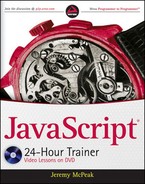
By default Firebug opens as a panel at the bottom of the window (Figure 38-1), but you can pop it out into its own window by clicking the middle panel control button at the top right corner.
At the top of the panel is a list of tabs that give you information about the web page. The far left tab is the Console tab, shown in Figure 38-2. The top portion is an information area that lists errors and results of the JavaScript code you execute in the lower portion.
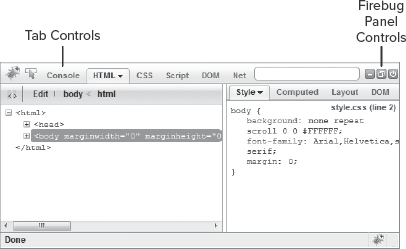
By default the console allows only single-line JavaScript statements to be input and executed, but you can click the up arrow to allow multi-statement JavaScript code. When you do so, the Console tab divides into a left panel (the informational panel) and a right panel (the JavaScript input panel).
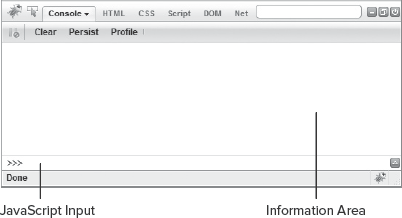
The next tab is the HTML tab, and it provides information regarding the HTML structure as it's rendered in the browser (Figure 38-3).

On the left side is a tree that lets you drill down to any element in the page. You can actually edit the HTML on-the-fly to see how a change affects its rendering. It's a powerful tool for any web developer. On the right is a panel that provides you with CSS and layout information of the element you have selected in the left panel, as well as the element's DOM object.
The next tab is the CSS tab (Figure 38-4). It displays the source code of all the CSS style sheets referenced in the page.
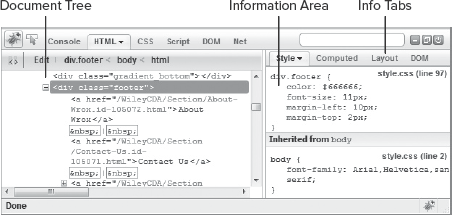
By clicking the menu you can select any style sheet and edit it to see how a change makes the page look in the browser. While it isn't overly useful for JavaScript developers, it is handy for those responsible for a page's look-and-feel.
The Script tab is next, shown in Figure 38-5, and this is where you'll spend the majority of your time in this lesson.
The left panel displays the source code of all the JavaScript referenced in the page. You can view the other JavaScript files by clicking the menu and choosing the JavaScript file you want to view. The area to the very left of the source code panel, where the line numbers are shown, is called the gutter. You'll use the gutter to set and remove breakpoints.
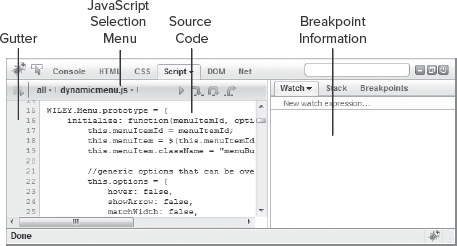
The right-hand panel of the Script tab is an information area that allows you to specify watches, view the call stack, and view the statements that have breakpoints.
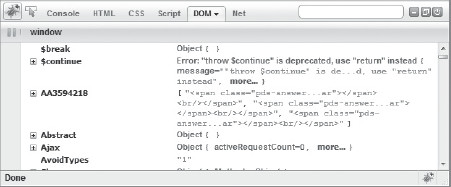
The next tab is the DOM tab (Figure 38-6). It displays everything loaded by the DOM, as well as JavaScript variables, functions, and objects in the currently loaded page.
Finally is the Net tab, which is disabled by default, but which gives you instructions on how to enable it if you want. This tab shows you all the requests made on this page, as shown in Figure 38-7.
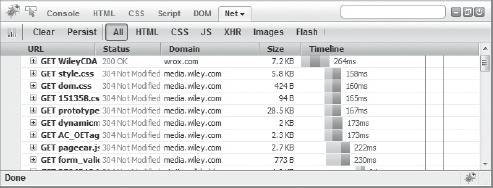
It gives you just about all the information you need regarding each request: headers, response code, what domain the request was sent to, and the amount of time it took to download the resource. It's a very useful tool when you're trying to optimize the network portion of a web application.
So that's a quick rundown of the UI. Let's focus on the tools central to JavaScript development, starting with the Script tab.
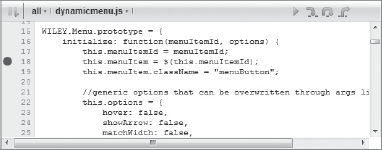
When the debugger reaches a breakpoint, it pauses code execution and waits for an action from you. This is useful because it allows you to inspect your code while it executes. To create a breakpoint, simply left-click in the gutter on the line where you want to break. Breakpoints are denoted by a red circle in the gutter on the line where you clicked (Figure 38-8).
You can also hard-code a breakpoint in your JavaScript code by using the debugger keyword, like this:
function someFunction() {
    var someVariable = "Doing some work";
    debugger;
    someVariable = "Doing more work";
}
When code execution reaches the debugger statement in this code, Firebug will break and wait for an action from you.
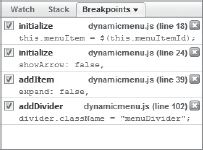
To view all the breakpoints that you've set, you can click the Breakpoints tab in the right panel (Figure 38-9). Each entry in the list lets you enable or disable a breakpoint by checking or unchecking the checkbox, and also features the name of the function containing the statement the breakpoint is on (if applicable), the file name and line number of the source file, the source text of the breakpoint, and a delete button to remove the breakpoint.
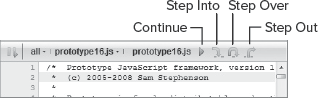
You control code stepping with four buttons in the upper right of the source code panel (Figure 38-10).
The first button is the Continue button (its shortcut key is F8). When code execution is stopped at a breakpoint, the Continue action will restart it until either the next breakpoint or the code's end is reached.
The second button is Step Into (its shortcut key is F11). It executes the current line of code and pauses at the next statement. If the current line is a function, it steps to the first line of the function.
Next is Step Over (F10), and it executes the current line of code and pauses at the next statement.
Last is the Step Over button (Shift+F11). When evoked inside a function, Step Out executes the remaining code of the function and returns to the caller.
In this lesson, you are introduced to Firebug, the most popular JavaScript debugger. You learn how to set breakpoints, step through code, and use the console to get information and change values as you need to.
For this lesson, you will need a text editor; any plain text editor will do. For Microsoft Windows users, Notepad is available by default on your system, or you can download Microsoft's Visual Web Developer Express (www.microsoft.com/express/web/) or Web Matrix (www.asp.net/webmatrix/), both of which are free. Mac OS X users can use TextMate, which comes as part of OS X, or download a trial of Coda (www.panic.com/coda/). Linux users can use the built-in VIM.
You also need Firefox and the Firebug add-on installed. If you do not have Firefox installed on your computer, visit www.getfirefox.com to download and install it. After it is installed, install the Firebug add-on as described previously in this lesson.
Create a subfolder called Lesson38 in the JS24Hour folder, and then open your text editor and type the following HTML. The bold line has a deliberate typo.
<html>
<head>
      <title>Lesson 38: Example 01</title>
</head>
<body>

<script type="text/javascript">
function writeTimesTable(timesTable) {
    var writeString = "";

    for (var counter = 1; counter < 12; counter++) {
          writeString = counter + " * " + timesTable + " = ";
          writeString = writeString + (timesTable * counter);
          writeString = writeString + "<br />";

          documents.write(writeString);
    }
}

writeTimesTable(2);
</script>

</body>
</html>
Save this file as lesson38_example01.htm, and make sure it is in the Lesson38 folder.
Open
lesson38_example01.htmin Firefox. Firebug should automatically open. If not, that's fine.If your status bar is enabled, look at the lower right of the browser window and you'll see that an error occurred in this page (Figure 38-11).
If your status bar is enabled, click the "1 Error" message in the status bar.
If your status bar is disabled, and if it isn't open already, open Firebug by pressing the F12 key, and click the Console tab.
You'll now see the error. Notice that you are given the error message, the source code that caused the error, and the number of the file and line where the error occurred.
Go back to your text editor and fix the error by removing the
sfromdocuments. Save the file again, and refresh the page in your browser.Now set a breakpoint on line 13. The code on that line is:
writeString = writeString + (timesTable * counter);
To set a breakpoint, click the Script tab and left-click the gutter at line 13. You should now see a red circle next to the line number.
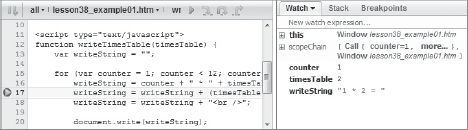
Reload the page. Notice that it looks as if nothing has happened. That's because Firebug has paused JavaScript execution. Look at the source code in the Scripts tab. You'll see an arrow inside the red circle, and the line will be highlighted (Figure 38-12). The debugger has not yet executed this line of code—it is waiting for an action from you. You'll give it an action shortly.
Look over at the pane on the right. The Watch tab should be active. If not, click it.
The breakpoint caused the debugger to pause at line 13, which is inside the
writeTimesTable()function. The items being displayed in the Watch tab are variables that have scope insidewriteTimesTable(). You can see thatthisis thewindowobject, thecountervariable is1,timesTableis2, andwriteStringis"1 * 2 = ". You can click where it says "New watch expression" to add a new watch. There aren't any that you want to add at this time.Now Step Into the next line by pressing the F11 key (or clicking the Step Into button). The debugger executes the currently highlighted line and then pauses at the next line.
Look back at the Watch tab and at the value of
writeString. It is now as follows:"1 * 2 = 2"
The values of watched items are updated in real time.
Step Into the code two more times. Notice that Firefox updates the page as you step through code. Unfortunately, not all JavaScript debuggers do this (IE's debugger doesn't).
Now Step Out of the code (Shift+F11). The loop iterates and code execution pauses again at line 13. You cannot Step Out of a function if a breakpoint is set on a statement within a loop. While the remainder of the loop's iteration executes, the debugger stops at the breakpoint again in the next iteration.
To Step Out of a function while inside a loop, you must disable or remove the breakpoint that is inside the loop.
Click the Breakpoints tab in the right panel and you'll see the information about the breakpoint on line 13. Uncheck the checkbox and Step Out again. The loop finished executing without breaking again and you Stepped Out of the function. Now code execution is paused at line 20, the call to
writeTimesTable().Step Into the code again, and it looks as if nothing happens. When you Step Out of the function, it finishes executing and returns you to the point at which the function was called. Since there is no other code to execute, Step Into doesn't really do anything.
Enable the breakpoint again and refresh the page. The code pauses again at line 13.
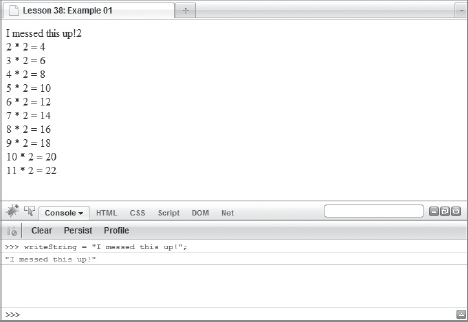
Let's mess this up. Click the Console tab and type the following code in the input box at the bottom of the Console tab:
writeString = "I messed this up!";
Now press the enter key on your keyboard. It will seem as if nothing happens.
This time remove the breakpoint by clicking the red circle in the gutter and press F8 to Continue (or click the button). The page in Firefox should look like Figure 38-13.
This happened because you changed the value of
writeStringwhile paused at line 13.
To get the sample code files, download Lesson 38 from the book's website at www.wrox.com.
Note
Please select Lesson 38 on the DVD to view the video that accompanies this lesson.