
The information content of scene categories
Michelle R. Greene* Department of Psychology, Program in Neuroscience, Bates College, Lewiston, ME, United States
* Corresponding author: email address: [email protected]
Abstract
Visual scenes, like other natural kinds, have a rich category structure. How do observers use this structure to aid perception? In this chapter, I will examine the link between scene category labels and perceptual processes. Scenes in the same category tend to share a number of features that can help the observer classify the scene. However, this process is bi-directional: given a scene label, observers are better able to classify visual content. Altogether, these results illustrate that visual perception and semantic knowledge are intimately connected, and that shared information between the two help disambiguate the complexities of the visual world.
Keywords
Categories; Scenes; Objects; Information
1 Introduction
Imagine that your friend is looking at a photograph on her phone. Curious, you ask what she is looking at, and she answers that it is a picture of a street she used to live on. Without knowing anything about the picture, you already know a good deal of things about the image: you know that it is an outdoor and urban space, for example. You can also make educated guesses about the presence of objects such as cars, trees, and houses. You can rule out a number of other objects such as sharks, black holes, or airplanes. If you have a little bit more information, such that your friend used to live in Boston, you know even more about the picture. You can make inferences about the width of the street, as well as the height, density, and architectural style of the buildings.
The reduced uncertainty that you have about the picture after being given the label “street” is the information that the label provides. Although information was a long-standing qualitative concept, Shannon formalized the concept in the 1940s, allowing information to be treated like any other physical entity such as mass or temperature (Shannon, 1948). Concurrently, psychology was moving away from behaviorism and toward modeling the mind as an information processor, and Shannon's ideas were immediately influential (Attneave, 1954; Miller, 1953). Specifically, it was understood that both visual images and natural language were redundant. If the brain capitalized on this redundancy, then it could form more economical, compressed representations that could explain our cognitive facility in the face of a complex world. These ideas then spread to the neuroscience community in the form of the efficient coding hypothesis (Barlow, 1961).
The goal of this chapter is to illustrate the bi-directional information flow between category labels and the visual perception of real-world scenes. As categories make the explicit link between vision and semantics, I will begin with some basic definitions of categories and category membership. I will then turn to the question of scene categories, and describe work that answers some basic questions such as the number of categories and their entry-level status in a data-driven manner. In the next section of the chapter, I will examine how visual features give rise to scene categories, and the extent of the utility of a range of features from low-level features such as color and contour to high-level features such as objects and affordances for providing information about category status. The regularities at these levels allow the formation of priority maps, allowing scenes to be rapidly categorized via diagnostic features. However, a scene category is more than merely a set of features: category labels come bundled with expectations of objects, locations, and events. In other words, we form schemata of categories that enable intelligent guidance of behavior. In the next section of the chapter, I will review work that shows how the information available in a category label alters even early visual representations. Taken together, these results provide evidence for a view of visual cognition that is deeply embedded in semantic knowledge, and making use of that knowledge to disambiguate the complexities of the visual world.
2 What is a category?
In a world without categories, we would have to rediscover every concept upon each use. For example, without the concept of cup, we would have to rediscover the function of this object each time we were thirsty and wanted some water. By forming mental representations of entities that can be treated equivalently, we enable ourselves to make predictions and inferences about the world. A concept is the mental representation itself, and a category refers to the set of items within the representation. Concepts link our past experiences to the current state of the world, and thus are said to “glue our mental world together” (Murphy, 2004). Concepts also play a pivotal role in perception: to say that we recognize something (say a cat) is to categorize that object as being a member of the cat category. In this way, all perception is an act of categorization (Bruner, 1957). In addition to linking perception, memory, and inference, categories also interface with language as these labels allow for information exchange between people. By sharing conceptual representations, we can communicate our knowledge about the objects, environments, and people around us.
It is generally thought we use categories in a way that maximizes information transmission between individuals. Category concepts exist in hierarchies: my chair could be more broadly described as furniture, or more specifically described as a straight-backed wooden chair. Why do I choose to describe it with the middle level of specificity? Although more specific categories provide more information overall, knowing that my chair is a straight-backed wooden chair as opposed to a metal folding chair will not fundamentally change how interact with and use the chair. However, knowing that an article of furniture is a chair and not a table will change how I interact with the object.
In general, we discuss most categories at this mid-level of specificity and are faster and more accurate to respond to labels at this level compared to more general (known as superordinate) or more specific (known as subordinate) levels (Brown, 1958; Murphy & Brownell, 1985; Rosch, Mervis, Gray, Johnson, & Boyes-Braem, 1976; Tversky & Hemenway, 1983). This middle level of specificity is known as the basic level (or entry level) of a category (Rosch et al., 1976). Although robust, the basic level preference is not absolute: a conversation between two experts may have more specific labels (Tanaka & Taylor, 1991), and very atypical items within a category tend to be labeled more specifically as well (Jolicoeur, Gluck, & Kosslyn, 1984). For example, we tend to label an ostrich at the subordinate level, even though it is a lawful member of the bird category.
There are several theoretical accounts for why the basic level preference exists, and each posits that the basic level maximizes the information between interlocutors. Models of category utility (Corter & Gluck, 1992; Jones, 1983) posit that basic level categories maximize the similarity within a category while minimizing the similarity between categories. This would allow interlocutors to have an optimal trade-off between specificity and generalization. By contrast, the basic level categories may provide maximum information compression by minimizing the description length of category labels (Pothos & Chater, 2002). Lastly, the basic level could maximize information transmission by reducing the number of diagnostic features to test, while placing weight on features that are easy to compute (Gosselin & Schyns, 2001).
2.1 What is a scene category?
In this chapter, we will concern ourselves with categories of environmental scenes. The last 20 years has seen an increase in the use of natural scene images as stimuli for experiments in visual perception. Although natural scenes present additional experimental challenges over more simple stimuli such as gratings (Rust & Movshon, 2005), there are both theoretical and practical reasons to move in this direction. Despite the complexities of real-world scenes, all natural scenes share statistical similarities (Simoncelli & Olshausen, 2001) that seem to reflect the response properties of the visual system (Field, 1987; Simoncelli & Olshausen, 2001). This highlights the fact that our evolutionary history honed the visual system to perceive natural scenes rather than gratings. Indeed, a hallmark of human scene processing is its speed: in a single fixation on a novel scene, one is able to apprehend its basic semantic information, or gist (Potter, 1975), describe a few large objects (Fei-Fei, Iyer, Koch, & Perona, 2007), understand its spatial layout (Greene & Oliva, 2009a), and even be able to form esthetic judgments (Zajonc, 1980). Thus, the study of natural scenes makes links to other critical aspects of cognition such as attention (such as when I search for my frequently lost keys), navigation, and memory.
Environmental scenes appear to be a natural kind for the human mind: they are perceived with equal facility as objects (Potter, 2012), we remember them with similar fidelity (Konkle, Brady, Alvarez, & Oliva, 2010a), and like other critical categories such as objects as faces, distinct areas of the visual cortex are devoted to processing scenes (Epstein & Kanwisher, 1998). Like objects, scenes have a hierarchical category structure with a basic level preference (Tversky & Hemenway, 1983). In that study, the authors developed a small taxonomy of eight scene categories (four indoor and four outdoor) by asking experimental participants to generate lists of environments. From these lists, they created a three-level hierarchy of these environments. For example, the most general (superordinate) level was indoor and outdoor. In the next level of the hierarchy, there were stores, schools, restaurants, and homes as types of indoor places. In the most specific level of the hierarchy, they distinguished, for example, department stores and grocery stores as different types of stores. They found that scene categories demonstrated many of the same basic-level effects as object categories: participants were able to list many more attributes and activities with the mid-level tier of their taxonomy than the other levels, and this level was the most frequently named by observers.
Despite the foundational nature of this study, many questions persisted for decades following. For example, how many categories of environmental scenes exist? In the late 1980s, Biederman estimated that there are 30,000 basic level object categories (Biederman, 1987). This estimate was reached by sampling pages of a dictionary and counting the number of words that defined a basic level object category. Using a similar method, Xiao and colleagues estimated just over 900 scene categories to create the Scene UNderstanding (SUN) database (Xiao, Ehinger, Hays, Torralba, & Oliva, 2016). However, these authors never claimed that these were basic level scene categories, and instead aimed at completeness across the space of environmental categories. Therefore, one may question whether “front seat” versus “rear seat” of car interiors or “cascade waterfall” versus “cataract waterfall” make for different basic level categories of scenes. In the SUN database, only around 400 categories were “well sampled,” which was defined by the authors as having > 100 unique photograph exemplars available for download on the web. In other words, more than half of the categories in the SUN database were relatively rare. Furthermore, in a footnote, the authors note that in a group of seven researchers who sampled 284 h of lived experience, there were only found 52 unique categories of environments that were experienced. Later work aimed at gathering a larger number of sample images per category only found 205 scene categories with at least 5000 unique image examples (Zhou, Lapedriza, Khosla, Oliva, & Torralba, 2018). Taken together, this could suggest that a good number of the 900 + categories in the SUN database are more specific than entry-level scene categories.
2.2 How many basic level scene categories exist?
Scene categories make an explicit link between visual perception and semantics. We can estimate the richness of this semantic space by estimating the number of scene categories that exist. Moreover, knowing the total number of scene categories can constrain our search for the possible mechanisms of scene categorization. For example, a coding strategy that works well for tens of categories might not scale well to tens of thousands. In order to estimate the number of environmental categories broadly, and the number of basic level categories in particular, I adopted a data-driven approach. In order to get a total count of categories that reflected usage in the vision literature, I first determined all of the scene categories that had been reported in the scene categorization literature. I identified a set of 116 studies in cognitive psychology, cognitive neuroscience, and computer vision, published between 1979 and 2011 that published their category lists. From these, I collated a total of 1532 unique scene categories. Upon examining the specific categories, I observed that 42 of the categories were proper nouns, such as “Arizona” or “Yellowstone.” Additionally, 44 categories described animate entities, rather than environments, such as “crowd of people” or “eagle.” A total of 35 categories described events rather than places, such as “aviation” or “climbing.” Furthermore, 93 categories described entities that were more object-like than scene-like, such as “doors” or “flags.” 204 categories described rare entities for which fewer than 100 images could be found. Finally, 59 categories were found to have significant overlap (e.g., “natural lake” versus “lake”). After pruning these categories, 1055 scene categories remained.
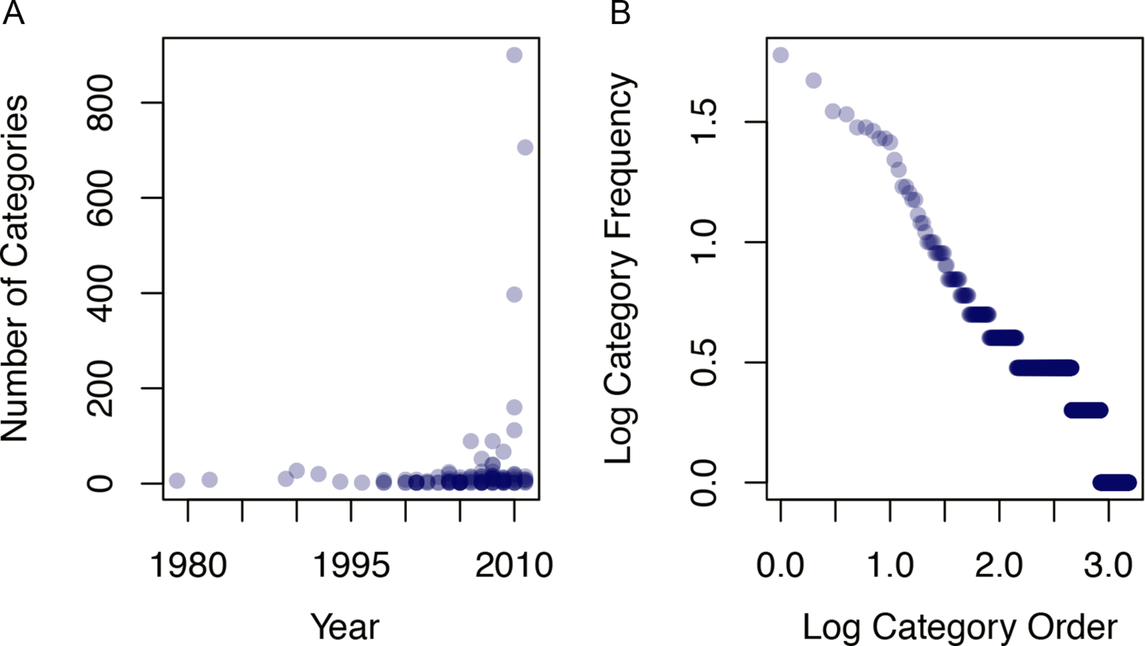
One way to estimate the number of scene categories in the world is to examine the number of scene categories used in scene categorization research. As shown in Fig. 1A, scene categorization has become an increasingly popular topic over time (shown by the higher density of points on the right-hand side of the graph) and the number of scene categories examined per study has also steadily increased over the last 40 years. In the 1980s and 1990s, fewer than one scene categorization study per year was published on average, but this has increased to an average of nine per year in the 2000s and 2010s. Similarly, studies in the earlier decades used around half a dozen scene categories per study, but this has increased to over 100 in the 2010s. However, the prevalence of any particular category is very rare: while each of the 1055 categories was observed in between 1 and 60 published studies, the median number of published studies was 2. Fig. 1B shows the category frequency as a function of frequency rank (log-log plot). The linear relationship here is evocative of Zipf's law for word frequencies, in which a small number of words are very frequent, with a long tail of low-frequency words. Although we do not yet have a full understanding for why word frequencies are distributed in this way, one intriguing possibility is that they reflect organizational processes in human memory (Piantadosi, 2014).
In order to determine how many of the 1055 categories reflect basic level scene categories, I conducted a large-scale study with 2295 online participants using a platform called Mechanical Turk (mTurk), powered by Amazon. In the Mechanical Turk marketplace, observers can perform small tasks for small amounts of money. Most tasks on this site are easy for a human, but hard for artificial intelligence (AI), and are typically used to train large-scale AI systems. In recent years, experimenters in the cognitive sciences have used the platform to upload experimental tasks and to collect data on a scale that is not possible at a single college or university (Buhrmester, Kwang, & Gosling, 2011). In this experiment, participants completed mini-experiments (called “hits”) that each consisted of 10 trials. In each trial, participants were shown two images side by side. In half of the trials, the images were drawn from the same putative category (from the set of 1055), and for the other half, they were drawn from two randomly selected categories. The participants were asked to introspect about what words they would use to describe each of the scenes if they were using them to finish a sentence such as “I am going to the ….” They were then instructed to click “yes” if they would use the same word for both images, and to click “no” if they would use two different words. As this type of sentence evokes the basic level scene category, this task allows us to determine how observers place scenes into entry-level categories, and to assess how many entry-level categories there are. In addition to the main yes/no task, the participants were instructed to type in the category name that they would use for the left image. Therefore, for each putative category, we have the extent to which observers agreed on category membership, and a distribution of terms used to describe the category.
A subset of these data were previously reported by my team (Greene, Baldassano, Esteva, Beck, & Fei-Fei, 2016). My colleagues and I collected a total of over 5 million pairwise responses from the mTurk participants. The resulting 1055 × 1055 matrix of responses is shown in Fig. 2A. In this figure, the categories have been ordered using the optimal leaf order algorithm (Bar-Joseph, Gifford, & Jaakkola, 2001) in order to show maximal structure. In this figure, areas that are lighter show category pairs that observers consistently placed in different categories, while darker areas show category pairs that were frequently placed into the same category. If all of the 1055 categories represented perfect basic level categories, then one would expect a single dark stripe down the diagonal of the matrix, with light colors elsewhere. The existence of non-diagonal structure indicates that many of the categories in the 1055 are subordinate level as they are frequently put into the same entry-level category by observers.
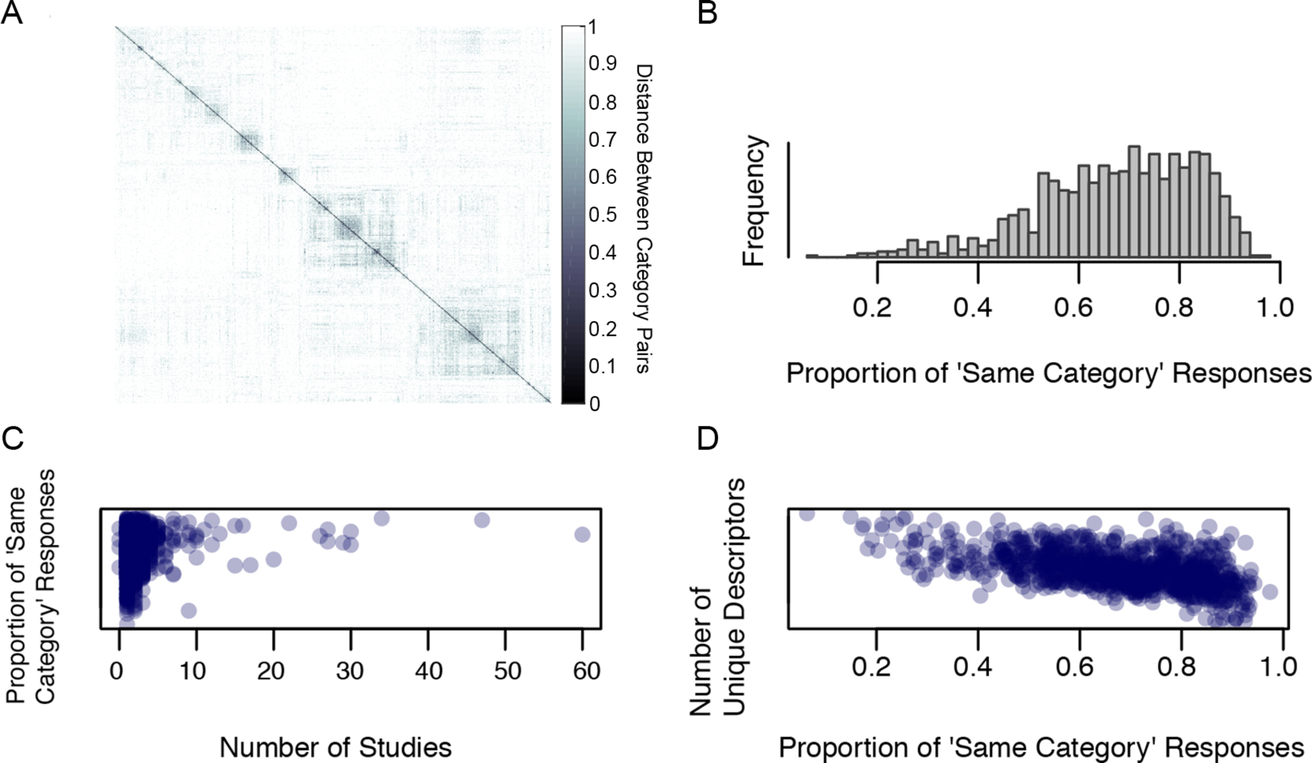
Fig. 2B shows the proportion of “yes” responses for each of the diagonal entries of the matrix. These represent cases in which both scenes were drawn from the same putative category. On average, observers agreed that two images from the same putative category were from the same basic level 69% of the time (interquartile range: 59–81%). Lowest agreement was found for “outdoor” (8%), “community center” (16%), “indoor” (17%), “research center” (18%), “dressing room” (20%), and “student center” (23%). As outdoor scenes can encompass both urban and natural landscape environments, it makes sense that agreement is lower than for indoor scenes, even though these both reflect more general (superordinate) categories. The other low-agreement categories likely reflect a larger visual diversity than most. For example, a “research center” could resemble either an office or a laboratory environment. On the other end of the scale, “train platform” (96%), “car interior” (94%), “highway” (94%), and several sub-categories of waterfalls all had high agreement of category membership.
Is there something in the “wisdom of the crowd” of vision researchers that has honed in on “good” scene categories? I observed a modest correlation between the agreement of category membership from the mTurk experiment and the popularity of the given category from the literature review (r = 0.17, P < 0.0001), suggesting that categories that are more frequently chosen by scientists are the categories that observers tend to have more agreement about as well (Fig. 2C). Finally, it appears that there is a substantial link between the goodness of the scene category and the reliability of the terms that the observers used to describe them: I observed a substantial negative correlation (r = − 0.53, P < 0.0001) between observer agreement and number of unique terms describing each putative category, indicating that the more unique terms observers had for a putative category, the less likely they were to place images from this putative category into the same entry level (see Fig. 2D).
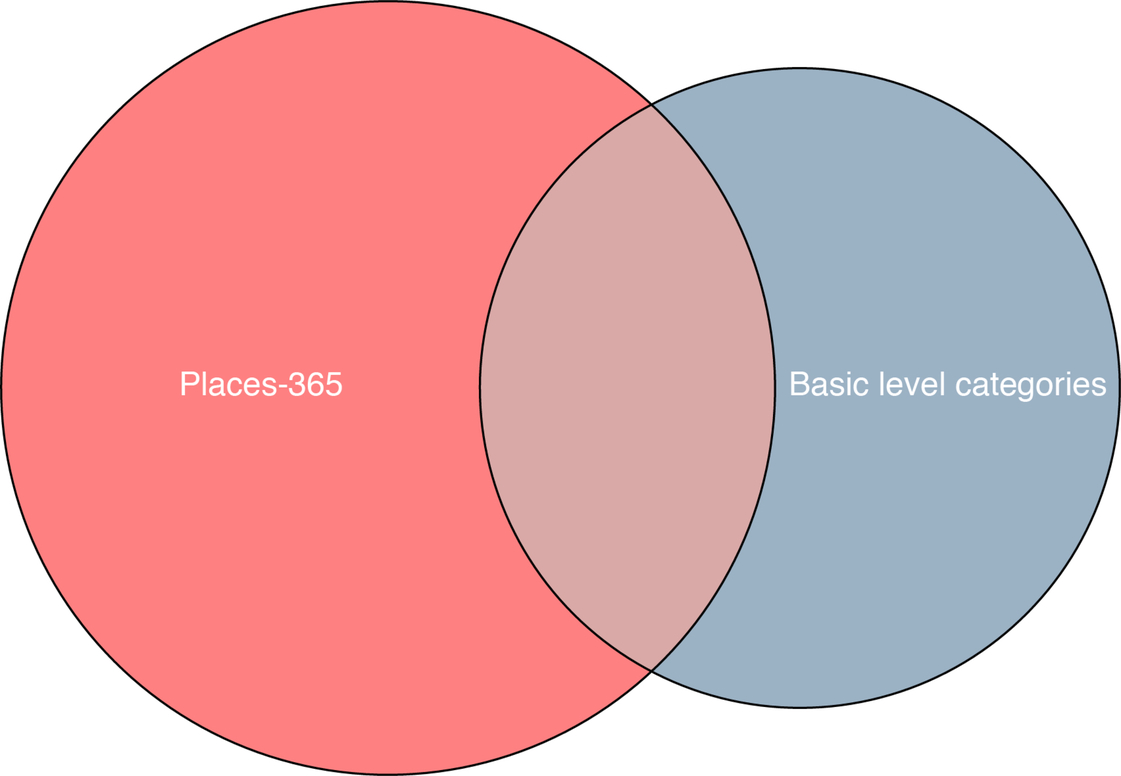
It is important to note that the categories with high observer agreement are not necessarily the basic level scene categories. Basic level categories are identified through both high within-category similarity as well as low between-category similarity (Iordan, Greene, Beck, & Fei-Fei, 2015; Jones, 1983; Rosch et al., 1976) and the current measurement only captures the former. If a category is entry-level, then observers should agree that different exemplars are members (within-similarity), and they should also reject exemplars from other categories as members (between-dissimilarity). On the other hand, if two putative categories have high between-category similarity as well as high within-category similarity, this is evidence that these should be merged into one basic-level that will maintain both the cohesion within the category as well as the distinctiveness from other categories. Overall, 36% of the 1055 categories (N = 384) had a within-category similarity of over 75%. From these, I clustered categories together when the between-category similarity was > 50%, and then I assigned the most common name provided by the mTurk participants as the basic level category name. This process yielded 211 basic level category names. Of these, 58% (N = 122) were represented in the Places-365 database (Zhou et al., 2018), and 66% (N = 241) of categories in the Places-365 database were not represented in this list, see Fig. 3. In other words, of the 455 unique categories represented in this database and the Places-365 database, only 122 were represented in both.
Now that we have established a set of scene categories for which observers have high agreement about basic level membership, it is time to link these categories with their visual features. Rosch and colleagues noted that the basic level is the most general category label for which objects have a similar shape (Rosch et al., 1976). Here, I extend this analogy to scenes by allowing the average image to show the average layout, or scene shape (Torralba & Oliva, 2003). Averaged images (N ≥ 5000 images) for 20 example categories are shown in Fig. 4. The extent to which recognizable structure may be seen in these images illustrates the extent to which there is self-similar information across images. In other words, it qualitatively shows how much visual information is contained in the category labels. For example, the average “phone booth” shows a red, rectangular structure in the center of the image, and pointed building structure can be seen in the average “temple” image as well. Similarly, “fields” and “badlands” can be characterized by their open structure and clear line to the horizon. Other categories, such as “discotheque” and “glacier” lack diagnostic structure but seem to have diagnostic colors. Finally, a few categories such as “kitchens” have few distinguishing features in the average at all.

2.3 Section summary
The goal of this chapter section is to show the comparative richness of the human conceptual structure for environmental scenes. Establishing the number of entry level scene categories is necessary for understanding how visual perception links to semantics: categories allow us to abstract over superficial differences between exemplars, and thus leverages our ability to communicate, remember, and make inferences on the basis of visual experiences. By knowing the number of categories we have, we know the relative richness of this cognitive space. I am not aiming to exhaustively enumerate all basic level scene categories. Given that membership in an entry level category depends on outside knowledge and context (Jolicoeur et al., 1984), this would be impossible. Instead, my goal is to provide an estimate both of the total number of unique environments a typical Westerner would typically name, as well and the proportion of these that are at the entry level. These results suggest that although we may distinguish around 1000 distinct types of environments, and that there may be fewer types of environments than types of objects (Biederman, 1987). As most scenes contain around a dozen objects (Greene, 2013), this makes sense. Moreover, the number of categories that have basic level status is an order of magnitude smaller than this. This suggests that for efficient communication—only a relatively small subset of categories is needed and that category labels themselves give considerable amounts of information compression.
3 What makes a scene a member of its category?
It is becoming increasingly accepted that scene understanding is achieved through an interplay of bottom-up perceptual analysis and top-down predictive guidance (Hochstein & Ahissar, 2002). In this view, bottom-up perceptual analysis would identify diagnostic features of a given scene category, and top-down predictive guidance would select additional features for subsequent analysis and disambiguation. For example, if preliminary analysis yielded a scene representation that provided equal evidence for beach and field categories, then top-down guidance could select additional features for processing that would distinguish between these possibilities, or weight one of the possibilities based on the prior probability of seeing either a beach or a field in the current context. What are the features that are most diagnostic of scene categories? How much low- and mid-level visual processing does this visual system have to complete before the information from a scene representation contains diagnostic information? Here, I will review evidence for low-, mid-, and high-level features. In each case, I will discuss the sufficiency of each feature for categorization, and any evidence that each influences behavioral categorization judgments or neural responses in scene-selective cortex.
3.1 Low-level visual features
Following Malcolm, Groen, and Baker (2016), I will define low-level visual features to be those that can be computed directly from an image by filtering for features such as color, orientation, and spatial frequency. As shown in Fig. 4, color is a feature that is diagnostic of some scene categories. Color and texture features have been shown to be effective in city versus landscape scene classification (Vailaya, Jain, & Zhang, 1998), but these features seem to be of limited use for distinguishing among 397 scene categories in the SUN database (4.2% correct, chance = 0.25%) (Xiao et al., 2016). The extent to which human observers use color in scene categorization has yielded mixed results. In general, color may be effective for natural landscape scenes for which color is diagnostic (e.g., forests are green, and oceans are blue) (Goffaux et al., 2005; Oliva & Schyns, 2000), and color seems to be used when categorization is made more difficult, for example, in the presence of blurring (Castelhano & Henderson, 2008). But in general, the utility of color for both human observers and computational models seems relatively modest (Vogel, Schwaninger, Wallraven, & Bülthoff, 2007).
The distribution of edges and junctions is another low-level visual feature whose efficacy for scene categorization has been tested in both human observers and computational models. Computer vision features that encode distributions of oriented edges (e.g., Dalal & Triggs, 2005; Lowe, 1999) achieve between 10% and 26.3% accuracy in classifying the 397 categories of the SUN database (Xiao et al., 2016). Local edge contrast is also a helpful feature for human observers. Line drawing renderings of photographs activate scene-selective brain areas in a similar manner as the original photographs (Walther, Chai, Caddigan, Beck, & Fei-Fei, 2011). Observers are particularly sensitive to the statistics of contour junctions (Walther & Shen, 2014), and perturbations to these statistics also drive decoding accuracy in scene-selective cortex (Choo & Walther, 2016). Similarly, simple statistics of local contrast explain a considerable amount of variance in early event-related potentials (ERPs, Groen, Ghebreab, Prins, Lamme, & Scholte, 2013; Scholte, Ghebreab, Waldorp, Smeulders, & Lamme, 2009).
3.2 Mid-level visual features
While low-level visual features are those that could conceivably be computed in the lateral geniculate nucleus (LGN) or primary visual cortex (V1), and high-level visual features contain nameable semantic information, mid-level visual features bridge this gap, providing information about textures, surfaces, and some shape features (Groen, Silson, & Baker, 2017).
A classic mid-level visual feature that was one of the first successful features for computer scene classification was the spatial envelope, or gist, descriptor (Oliva & Torralba, 2001). The gist descriptor is a coarsely localized Fourier spectral template that describes the dominant orientations at different spatial frequencies within one of many spatial bins. For example, one might create a gist descriptor with eight orientations, and four spatial frequency scales, localized in a 4 × 4 grid (N = 16 bins) across the image, for a descriptor with 512 dimensions. This type of representation can distinguish among broad categories of scenes, including natural versus urban, indoor versus outdoor, open versus enclosed, etc. This representation achieves 16.3% correct classification on the 397 categories of the SUN-397 database (Xiao et al., 2016). Moreover, scenes that share a similar gist descriptor tend to have similar patterns of response in fMRI throughout visual cortex (Watson, Hartley, & Andrews, 2014), and in particular within the scene-selective parahippocampal place area (PPA, Watson, Andrews, & Hartley, 2017).
Although scenes are not themselves textures, many types of scenes have diagnostic texture features. Texture features have been shown to achieve a 21.6% accuracy in classifying the SUN-397 database (Xiao et al., 2016). Some scene categories (particularly natural landscapes) can be recognized by human observers from their texture statistics alone (Loschky, Hansen, Sethi, & Pydimarri, 2010). Moreover, a representation based on texture statistics can explain many of the errors made by observers during brief scene presentations (Renninger & Malik, 2004), as well as aspects of peripheral vision (Ehinger & Rosenholtz, 2016).
Another mid-level visual feature that has garnered attention is the statistical ensemble, or summary representation. An ensemble representation explicitly codes for first-order summary statistics of the visual input (mean, variance, etc.), rather than encoding all individual display items. As visual scenes contain a great deal of redundant structure, this is an efficient representation. In both laboratory displays and natural scenes, observers are remarkably adept at estimating the mean size or center of mass of a group of objects, or even the average emotion in a crowd of faces (reviewed in Alvarez, 2011; Whitney & Leib, 2018). In a fully labeled database of 3500 scenes, I previously found that a classifier using summary statistics from the object labels (mean object size, number of objects, center of mass, etc.) could accurately classify scenes at both the superordinate (AUC = 0.83) and basic levels (AUC = 0.77) (Greene, 2013). More importantly, the pattern of errors made by this classifier resembled the superordinate-level patterns of errors made by human observers in brief presentations (Kadar & Ben-Shahar, 2012).
Although the object-selective lateral occipital complex (LOC) is not sensitive to changes in ensemble statistics, regions of the parahippocampal gyrus are (Cant & Xu, 2012). As the parahippocampal gyrus is also highly involved in scene processing, this result is suggestive of a substantial role of ensemble processing in scene understanding. Similarly, early brain responses seem to distinguish images that differ in ensemble/texture statistics for both textures (Groen, Ghebreab, Lamme, & Scholte, 2012) and natural scenes (Groen et al., 2013).
3.3 High-level visual features
High-level features are semantically identifiable features that not easily computed directly from the images, and often require human observers to be “in the loop” for annotation. These can include the list of objects with the images (Greene, 2013), hand-labeled attributes of images (Patterson, Xu, Su, & Hays, 2014), and the set of human actions that could be undertaken within scene environments (Greene et al., 2016). Because these features themselves contain semantic content, they make the most direct link between scene category semantics and visual processing. However, it is possible but not yet clear whether these high-level features are exclusively visual, nor whether they are processed in a purely bottom-up manner.
3.3.1 Objects
A “bag of words” model is a model that predicts a scene as being a member of a particular category when given the list of the scene's objects as input. For example, given the objects “waves,” “sand,” and “sky,” a bag of words model might predict beach. Such models were very popular in computer vision in the 2000s (Bosch, Zisserman, & Muñoz, 2006; Fei-Fei & Perona, 2005). Previously, I found that in a cleanly labeled scene database, a bag of words representation could effectively classify scenes at the basic level (AUC = 0.96), but that the pattern of confusion for this representation was unlike that of human observers during brief scene presentations (Greene, 2013). Part of the disconnect is that the bag of words approach seems cognitively and physiologically implausible: this model assumes that all object processing is complete before scene classification takes place. Given that the classification of a whole scene does not appear to take more cognitive resources than classifying a single object (Potter, 2012), and visual working memory of individual objects is limited (Liu & Jiang, 2005), it is unlikely that human observers use this approach to categorize scenes.
In the basic bag of words scenario, the model is given the presence or absence of all possible objects. To simulate a more realistic scenario, I examined the minimum number of objects necessary to achieve this level of performance. Following Biederman (1981), one could classify a scene from a single object (or group of objects) if they are completely diagnostic of a scene category. For example, because a toilet only occurs in a bathroom scene, if one recognizes a toilet, then the scene can be correctly classified even if no additional analysis takes place. However, without knowing the type of scene one would see in advance, we still need to examine the presence and absence of a number of objects because the diagnostic objects are not known in advance. To model the “best” objects, I computed the mutual information between each object and each scene category:
where
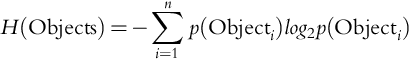
and

Over the entire labeled database, sky was the most informative object (Greene, 2013). Because the presence of sky is diagnostic of outdoor scenes, both the presence and absence of this object rule out about half of the scene categories in the database. I examined the extent to which the presence or absence of the top N informative objects could predict a scene's basic level category, and compared this level of performance to the average of N random objects selected from the database. As shown in Fig. 5A, with only the 64 most informative objects, one can achieve ceiling-level scene classification performance (Greene, 2013). Interestingly, the correlation between the off-diagonal elements in the classifier confusion matrix is also highly correlated with the confusions made by humans observers (data from Kadar & Ben-Shahar, 2012), and the strength of this correlation also increased as the number of informative objects increased, see Fig. 5B. Therefore, the mistakes made by human observers during rapid visual presentations seem similar to a classifier given the presence or absence of a few dozen informative objects.

While the previous analysis suggests that the presence or absence of a set of well-chosen objects can indeed classify scenes, this model still requires that observers be able to process dozens of objects before the scene could be recognized. Without knowing the scene category in advance, even knowing the most informative object yields only 14% accuracy (chance = 6.25%). However, this level of accuracy can only be achieved by knowing the most informative object and knowing where to devote attention in order to process it. In this case, this is somewhat easy because sky is found in the upper visual field (Greene, 2013; Oliva & Torralba, 2007). But some of the objects that also have high mutual information for scene categories, such as “chair,” “tree,” “window,” and “pillow” do not have such advantage. The results from Fig. 5B therefore present a paradox: how is it that the errors of this model are so well-correlated with the errors of human observers when this model's mechanism is so implausible? This model assumes that scene understanding is achieved exclusively through a bottom-up route that analyzes objects and uses these objects to establish the scene's category. However, the high correlation with human observers implies that their representations effectively contain information about these objects. It is therefore likely that previous knowledge about object co-occurrence is used to generate this information in a top-down manner.
If we consider that observers have time to recognize at most one object during a fixation (Liu & Jiang, 2005), we can consider a few scenarios: (1) one recognizes the object nearest to the center of the image; (2) one recognizes the largest object; or (3) one recognizes the object with the most visual saliency. Human observers have a tendency to direct gaze toward the center of the image (Tatler, 2007), and this can be explained to a large extent by photographers' tendency to frame informative aspects of an environment closer to the center of an image (Tseng, Carmi, Cameron, Munoz, & Itti, 2009). Therefore, if the object in the center of the image is sufficiently diagnostic of the scene category, then recognizing this centered object could be a route to scene categorization. I used the center xy point of the polygon that defines each object in each of the 3499 scenes. I then chose the object with the lowest Euclidean distance to the center of the image. With this object, I examined its diagnosticity (p(category | object)), and assigned the category with the highest probability as the predicted category. As shown in Fig. 6, although this strategy can achieve above-chance categorization accuracy, its overall rate (25%, chance = 6.25%), is far less than the near-ceiling rates observed for human observers. To examine the second strategy, I computed the area subtended by all labeled objects in each scene. Using the largest object, I classified the scene using maximum diagnosticity as before. This strategy yielded similar results (32% correct, see Fig. 6). Last, I examined the extent to which the most visually salient object might be useful in scene categorization. Using the saliency toolbox of Walther and Koch (2006), I found the most salient region of each image and mapped it to its corresponding object. As before I used diagnosticity as a classification criterion. As with the other two strategies, this procedure yielded marginal results (27% correct, see Fig. 6). Therefore, although one can classify scenes from groups of informative objects, it seems unlikely that scenes can be correctly classified from the perception of a single object.

Of course, correctly detecting the presence of one object can give the observer good information about the presence of others. These object co-occurrence statistics could provide a source of top-down information for scene categorization. For example, in this labeled database, given the presence of a stove, there is a 97% chance that there is also a cabinet in the image (Greene, 2013). In order to model this situation, I re-simulated the three scenarios described above, but allowed for multiple objects to be included if their presence was > 95% probable given the presence of the centered, large, or salient object. I found that adding these objects boosted the classification accuracy of each of these scenarios by < 1%, largely because so few objects had such strong co-occurrence statistics. Of course, 95% probable is a strict threshold, and it is likely that a more sophisticated Bayesian analysis would yield better performance.
Recently, Võ and colleagues have coined the term anchor object to refer to those scene objects that define the shape and space of a scene, and that determine the placement of other mobile objects around them. For example, a stove and a refrigerator are anchor objects in a kitchen, and other objects such as pots and pans are placed in reference to them. Such anchor objects seem to guide observers' construction of scene environments (Draschkow & Võ, 2017) as well as guide attention during visual search (Boettcher, Draschkow, Dienhart, & Võ, 2018). I coded each of the 617 unique objects in the labeled database as either being “anchor” or “not” and found that 98 of the objects were anchor objects. Using the same method described above, I examined the extent to which the processing of a single anchor object could categorize a scene. Interestingly, anchor objects by themselves provided less diagnostic scene information (21% classification accuracy) than the centered, salient, or largest objects. Although this seems counter-intuitive, it is worth noting that the same anchor object is often found in multiple categories of scenes. For example, a large, centered table can be an anchor in either a dining room or conference room. Therefore, by itself it cannot distinguish between the categories. I extended this analysis as above, including both the anchor object and any additional object that co-occurs with the anchor object with a probability > 95%. However, as with the large, salient, or centered objects, the addition of these objects did not appreciably improve the classification performance (22% on average). Therefore, although anchor objects seem to be effective guide posts for attention when performing visual search, they provide more information about object location than category identity.
Altogether, these results illustrate that it is implausible that observers recognize scenes by recognizing a single object within them. Although a few dozen intelligently chosen objects can accurately distinguish among scene categories, the sheer speed of scene categorization argues against the plausibility of a scene categorization mechanism that serially tests the presence or absence of dozens of objects.
3.3.2 Attributes
Objects are not the only high-level aspect of visual scene environments. In order to enumerate and characterize all of the differences between different scene environments, Patterson et al. (2014) performed a large-scale experiment on mTurk in which they provided two images to observers, and asked them to list all of the attributes that make the images different. From the raw responses, they categorized attributes that distinguish scenes into five general categories: (1) materials; (2) surface properties; (3) affordances; (4) spatial layout; (5) objects. With a different group of mTurk observers, images in the SUN database (Xiao et al., 2016) were annotated according to 102 attributes in those categories. The authors found that each of the attributes could be directly classified from image features, and that scene categorization using attributes as an intermediate-level feature was slightly more accurate (40.2% correct, chance = 0.25%) than simply using the features alone (38%). More impressively, the attribute features predicted more of the off-diagonal responses in the human confusions reported by Xiao et al. (2016), suggesting that these features may have some special significance in explaining human scene category representations.
3.3.3 Affordances
There is also a strong link between a scene's category and its affordances—the set of actions that one could take in the scene environment. Being shown a scene environment that is congruent with a set of actions (e.g., cooking in a kitchen) makes one faster to respond to action-related objects in that environment (Wokke, Knot, Fouad, & Richard Ridderinkhof, 2016), and faster to recognize the action being performed by others (Wurm & Schubotz, 2017). Moreover, there is also evidence that our scene category boundaries are largely defined by affordances (Greene et al., 2016), and that navigational affordances systematically modulate scene-selective regions of visual cortex (Bonner & Epstein, 2017).
In order to annotate a complete set of affordances, my colleagues and I adopted the American Time Use Survey, an annual telephone survey conducted by the United States Bureau of Labor Statistics. In this survey, a representative sample of the US population is polled on their activities in the previous 24 h period in 15-min intervals. For this project, we appropriated the 2014 coding lexicon for these surveys, which was developed, modified, and validated over a 2-year period of large-scale pilot data collection (Shelley, 2005). The lexicon is organized hierarchically, with 17 major classes of activities, 105 mid-level category distinctions, and 428 specific activities. From the most specific group, we collated categories that would appear visually identical (e.g., driving to work versus driving to doctor, or telephone calls to family member versus telephone call to salesperson). This left us with a set of 227 actions. The image set for this experiment was a set of 311 categories with strong within-category cohesion (see Section 2.2). In an additional mTurk annotation experiment with 484 observers, we showed an example image from one of the 311 categories along with a random selection of 18 of the 227 actions. Observers were asked to use checkboxes to indicate which (if any) of the actions could be done in the scene from the perspective of the photographer. We collected a total of 1.3 million trials such that each action-category pair was annotated by at least 10 observers.
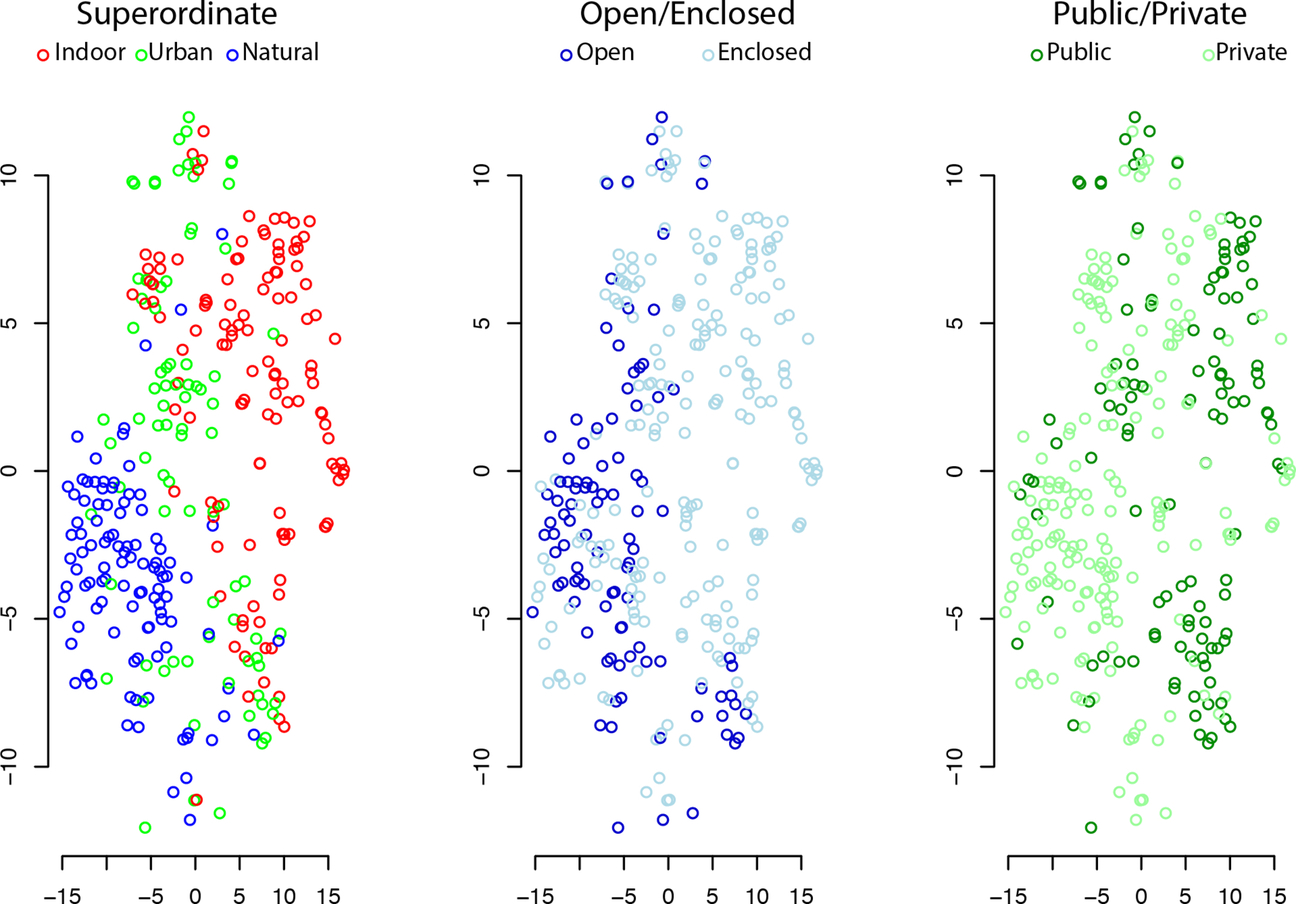
Fig. 7 illustrates the affordance space of scene categories, visualized using t-stochastic nonlinear embedding (t-SNE, van der Maaten & Hinton, 2008). It is evident that the differences in a scene's affordances can distinguish a number of different scene characteristics, including superordinate-level category (left), the spatial layout properties, such as whether the scene is an open or enclosed space (center, Greene & Oliva, 2009b; Oliva & Torralba, 2001), or whether the environment reflects a public or private location (right).
We wanted to see if similarities between categories in this affordance space predicted the types of category similarities we observed from the same-different category task on mTurk. To do this, we created a 311 × 311 category distance matrix in which each cell of the matrix represented the distance (or inverse similarity) between a pair of scene categories. We then examined the correlation between this set of distances and the distances from the mTurk experiment. We found that about 2/3 of the explainable variation in the human distances could be explained by the distances in affordances (Greene et al., 2016), and that this explanatory power was greater than that of a number of other popular low-, mid-, and high-level features.
3.4 Are high-level features exclusively visual?
However, we do not yet know whether these high-level features are exclusively visual. Do we need human annotation for these features because human observers bring in additional non-visual knowledge, or that we simply do not yet have a grasp on the nonlinear transformations that would be necessary for computer-based analysis? Recent advances in computer vision, namely, the deep convolutional neural networks (dCNNs) have made tremendous progress in object detection and classification (Russakovsky et al., 2015). It appears that the depth of these networks allows for very sophisticated, nonlinear transformations of image content (Kriegeskorte, 2015). As the activation patterns for upper layers in these networks have been shown to accurately classify images in a number of different ways (Razavian, Azizpour, Sullivan, & Carlsson, 2014), I am currently exploring the extent to which affordances can be predicted by dCNN features. The extent of successful affordance classification with dCNN features shows the extent to which this knowledge arises visually, rather than through non-visual cognitive means.
3.5 Connections between image features
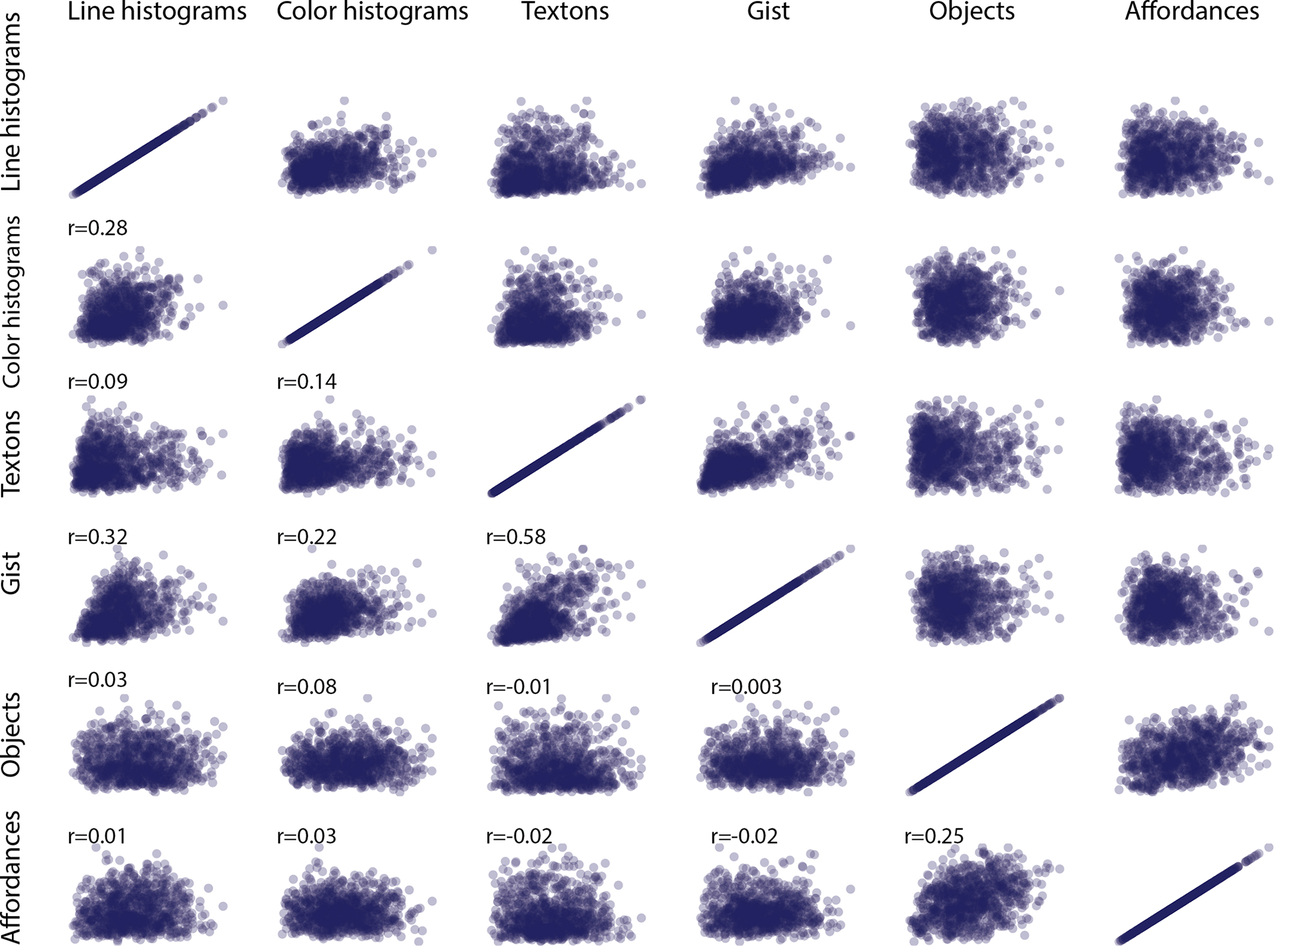
In this section, I have detailed that a range of low-, medium-, and high-level features can be used to classify scenes. In this section, as with the literature more broadly, they have been treated as largely independent entities. Is this a reasonable assumption? In Fig. 8, I plot the distance between scene category pairs in features at each of three levels: low (line histograms and color histograms), mid (textons and gist), and high (objects and affordances). All features were extracted from the SUN-397 database (Xiao et al., 2016). The low- and mid-level features were released along with this paper, and the high-level features were obtained by Patterson et al. (2014). This figure shows that two scene categories that are have high similarity according to gist features, for example, also tend to have high similarity according to textures (r = 0.58), and line histograms (r = 0.32), and scenes that share the same objects also tend to share the same affordances (r = 0.25). Therefore, if an observer has processed a particular feature in a scene, they will have non-zero information about other features as well. From the point of view of the visual system, these correlations are very adaptive because they point to statistical redundancies that can be exploited to create more efficient representational schemes. However, these create difficulties for the scientist trying to ascertain which features are processed to which degrees and at what point in time.
3.6 Section summary
In this chapter, I first established a set of scene environments that have basic level structure at scale, allowing us to establish the comparative richness of the semantics of scene environments. The next section detailed the myriad visual and conceptual features that can be used to categorize these scenes at a computational level, as well as the extent to which they are sufficient to explain scene categorization. However, many correlations exist between these feature spaces, and scenes that are similar along one type of feature also tend to be similar along a different feature as well (Fig. 8). These correlations can create difficulties for the interpretation of studies in scene categorization, because despite being able to assess independent contributions from these correlated features (Greene et al., 2016; Groen et al., 2018; Lescroart, Stansbury, & Gallant, 2015), assessing their causal role in category representations is not possible. However, each of these correlations represents a source of possible top-down information that can aid scene categorization. If two features are highly correlated, then the bottom-up analysis that yields the presence of one can provide the other “for free” from the top-down.
4 Do observers use category labels in visual processing?
So far, we have examined the nature and number of environmental categories, as well as the types of features that can inform the boundaries between categories. What do these category labels do for us? Are they explicitly used during the perceptual process? The power of a category label for aiding visual categorization was first observed by Potter in 1975. In her study, observers were shown a series of photographs at a rate of up to eight per second. One of the photographs was a target that was queried in a later memory task. Observers were either pre-cued to the target's identity, or were cued after the stream of images had been presented. Some of the pre-cue trials consisted of a visual preview of the target photograph, while other pre-cues consisted of a brief category label or description of the photograph. Potter found that observers were much more accurate at identifying pre-cued photographs, and remarkably, that the format of the pre-cue mattered very little (Potter, 1975). In other words, the category label by itself provided about as much information to observers as viewing the photograph in advance. Extending this paradigm, Intraub assessed whether observers could also pick out information from a “negative category”—for example, to pick out an image from the stream that was not from a category shared by other photographs in the stream. She found that although performance on this task was lower than that of a positive category cue, observers could perform the task reliably above chance even at a presentation rate of nine images per second (Intraub, 1981). These results suggest that despite being presented for only 113 ms each, every photograph in the stream was tagged for at least some semantic analysis.
Is it the case that observers extract visual categories automatically? In Intraub's task, semantic analysis was task relevant because the observer needed to know whether there was a negative-category image present in the stream. By contrast, an automatic process will take place even if it conflicts with the observer's task. To answer this question, Fei-Fei and I used a modified Stroop paradigm in which observers were presented with a scene or object category label that was superimposed over visual content. The observers were asked to classify the label as being a word that describes an object or a scene while ignoring the visual content (itself either a scene or object). In half of the trials, the label description matched the visual content, while in the other half of trials, the label was incongruent with the content. Despite the irrelevance of the image to the task at hand, we found that observers were faster and more accurate at categorizing words on a congruent visual background compared to an incongruent background, suggesting that object and scene category information is extracted automatically, even when doing so hurt performance on the task at hand (Greene & Fei-Fei, 2014).
When a category label is invoked, is it the case that the label activates likely visual features associated with the scene category? Caddigan and colleagues tested this idea using two sets of scene images from six different categories. One set had been rated by observers as being very typical (or “good”) members of their category, while the other set had been rated as being atypical (or “bad”). The goal of the experiment was to establish whether the “goodness” of the exemplar influenced observers' abilities to detect a scene as a well-formed coherent scene (as opposed to a phase-randomized, “scrambled” version of a scene) when the images were rapidly presented and backward masked. The research team first established the amount of time necessary to perform this task at 70% accuracy on mid-typicality images (about 45 ms on average). Using this presentation duration, Caddigan and colleagues presented this scene-or-scramble detection task to observers. Half of the scenes were good exemplars, and half of the scenes were bad exemplars. They found that observers' sensitivity to the good exemplars was significantly higher than their sensitivity to the bad exemplars (Caddigan, Choo, Fei-Fei, & Beck, 2017). While it had been long-established that typicality influenced categorization, this result shows that typicality influences even the detection of an image as a well-formed scene, which further highlights the automatic nature of scene categorization. Moreover, this result suggests that when current visual input contains visual features that conform to our inner representation (or “template”) of a category member, that this automatic category extraction is facilitated, suggesting that even the earliest visual stages are influenced by top-down expectations of category appearance.
What might these top-down perceptual templates look like? Together with my colleagues, I have been working toward developing a system whereby this private mental knowledge can be visualized externally. We call this system REVEAL (Representations Envisioned Via Evolutionary ALgorithm, Greene, Botros, Beck, & Fei-Fei, 2014). In a REVEAL experiment, the participant is presented with two images in each trial and asked to select which of the two is closer to their mental representation of a scene category, say a street scene. At the beginning of the experiment, the two images consist of entirely random visual noise, but we employ a genetic algorithm to learn what visual features of each noise example are associated with being chosen, and which image features decrease the likelihood of being chosen. Based on what it has learned, this algorithm can then create new image examples with more of the frequently chosen features. In this way, the images that are shown to the participant get closer and closer to their mental representation as the experiment progresses. The participant is allowed to terminate the experiment when they are satisfied with the result. In Fig. 9A, the top row shows this end point for each of five participants who completed this task. Although the results are far from photorealistic, we improved the visualization in the bottom row by averaging together the 20 images from the SUN database that were most similar to each result. To verify that what we have visualized is an integral part of each participant's street scene representation, we also employed a scene-or-scramble task similar to that employed by Caddigan et al. (2017). In this experiment, half of the street images were the streets that were most similar to the individual participant's visualized representation, and the other half were street scenes that were the least similar. As shown in Fig. 9B, participants were significantly more sensitive to detecting images that were more similar to their scene representation than ones that were dissimilar, suggesting that we are able to visualize the necessary features of an individual's street scene category representation. One possible objection to this result is that the participant may have primed themselves to the type of image they recreated by doing the reconstruction phase of the experiment immediately before the detection task. To test that possibility, we had one participant re-do the detection task 14 months after the initial reconstruction, and obtained virtually identical results. Therefore, images with visual features that are shared by typical category members not only aid categorization and detection, but we are able to find out what these features are for an individual participant.

5 What work is being done by the category label?
Category labels are also known to do a good amount of cognitive work. Specifically, they seem uniquely suited to helping perceptual processes: observers are faster and more accurate in identifying an object after a congruent verbal cue compared to equally diagnostic non-verbal information (Lupyan & Thompson-Schill, 2012). For example, the word “dog” is more helpful in identifying a picture of a dog than is the sound of a dog barking. Moreover, this effect seems to be perceptual in nature as the word label was found to modulate the P1, one of the earliest event-related potentials (ERPs, Boutonnet & Lupyan, 2015). Category labels may also play a role in pure detection tasks, as they lower the threshold at which observers can report objects that have been obfuscated in a continuous flash suppression paradigm (Lupyan & Ward, 2013).
A somewhat different account emerges when we consider the role of category labels on memory. Overtly naming an object at its basic level category can reduce observers' subsequent memories of it (Lupyan, 2008; Richler, Gauthier, & Palmeri, 2011). This makes sense from the point of view of information compression: extracting out a category label allows one to discount the numerous idiosyncratic features of the exemplar. Indeed, although visual memory is generally outstanding, it is challenged when there are multiple exemplars of the same object category to be memorized (Konkle, Brady, Alvarez, & Oliva, 2010b), suggesting that visual memory may outsource some of its demands to language. However, it is not yet clear why category labeling might lead to worse memory. The act of labeling itself might shift the object representation (Lupyan, 2008), or tasks that require exemplar-level processing may require more depth than those requiring category-level processing, leading to better memory (Richler et al., 2011).
In addition to boosting detection, perception, and memory, category labels also provide a rich set of knowledge for visual search. When observers are given a scene category label, they generate a consistent and correct set of expectations about the objects that are found in that category (Greene, 2016). These expectations are so strong that they can sometimes lead to false reports in observers (Brewer & Treyans, 1981; Castelhano & Henderson, 2008). Given a target object to find in a scene, observers generate eye movements that cluster around where that object can be found contextually: a search for pedestrians will be constrained to horizontal sidewalk and street surfaces, while a search for paintings will be constrained to walls (Torralba, Oliva, Castelhano, & Henderson, 2006). How exactly category labels influence visual search in scenes is less clear. Although searching for an object in a scene is more efficient than a random object array (Wolfe, Alvarez, Rosenholtz, Kuzmova, & Sherman, 2011), and previewing a scene before search leads to more efficient search (Castelhano & Henderson, 2007), simply previewing the category name before commencing search does provide much of a performance boost (Castelhano & Heaven, 2010). This could be because the “grammar” of the scene that is relevant to search is in a format that transcends category. For example, if we are looking for a coffee mug, we know that it is likely to be found on horizontal surfaces such as tables as desks. However, knowing that we are looking for a coffee mug in a kitchen tells us very little about where these horizontal surfaces are until we preview the specific spatial layout of a specific kitchen. As we previously saw, the “anchor objects” that help guide visual search are not themselves especially diagnostic, and instead serve as landmarks that define space within an environment.
Taken together, we can see that the act of labeling a scene as a member of a particular category seems to aid very early processing, including detection and recognition. However, this labeling does not by itself come with information that aids in visual search, and it may be detrimental to memory by allowing observers to abstract over visual features that differentiate among different scene exemplars.
6 Conclusions
In this chapter, I have examined the notion of the information contained in a visual scene, and how much of this information is contained in the scene's category or label. Given a scene label, observers are able to generate consistent expectations of the objects they will find in the scene, and given a label that is congruent with a picture, are able to use the category-based expectations to more easily categorize the scene. Images that share the same category label also tend to share a number of low-, mid-, and high-level features that could be employed to aid the categorization process. However, the correlations that exist between these features require that we work to assess the independent contributions of each. Altogether, these results illustrate that visual cognition and semantic knowledge are intimately connected, and that shared information between the two help disambiguate the complexities of the visual world.