
CHAPTER 5
Lean Practices and Tools
Reducing variation in any system or process is a fundamental principle that precludes waste elimination. When followed and used, Lean practices and tools can help to reduce variation and waste as well as serve as a microscope for identifying improvement opportunities. Lean practices are planning approaches used throughout the transformation process. Lean tools are specific analytical methods and problem-solving approaches. It is not the intention to differentiate between practices and tools here, because there is often a subtle difference between the two. Rather, both focus on helping to identify causes of variation and waste that can eventually lead to variance reductions and improvement.
Typically, a keen understanding of the process is required in order to understand the source of variation prior to its reduction. Namely, you want to put the process under a microscopic focus in order to address process improvement. It must be understood that all processes have random variability. It is inherent. It is imperative that processes are stable in order to differentiate between random variability and actual waste (assignable variation). Lean tools help promote a common understanding of the current system state as well as to help direct improvement efforts of stable processes. If a process is unstable, any improvement pursuit may simply be chasing phantoms.
Often the application point for the Lean microscope differs depending upon the environment. For example, in lower volume, batch environments, the examination of connections and flows between resources is critical for waste reductions. This is true due to downstream arrival delays, given longer upstream process times of batches. Therefore, it is important for system drum beat or takt time (defined in Section ‘Takt Time’) to be consistent between connecting process resources. Alternatively, in higher volume, repetitive processes, it is assumed that processes are initially designed with a common takt time across system resources. Therefore, a greater focus on the productivity of the resources themselves should be pursued. In particular, a measure such as overall equipment effectiveness (OEE) and the six big losses of equipment utilization that focus on equipment availability (equipment failure, setup, and adjustment), equipment speed loss (idling, minor stoppages, and reduced speeds), and output loss due to lower quality (defects and reduced yields) are useful.1
In addition to a sharp focus on process for identifying and reducing sources of waste, not all Lean practices and tools are equally applicable in all types of environments. For example, consider the use of heijunka or production leveling for service environments. Although production leveling may be accomplished to a degree, it is difficult at best for services to level production because of an inability to inventory a finished product and because of an expectation for offering a relatively short-order response time. Although it may be possible to level or influence demand to some extent using incentives or other devices, transformation processes of services must be flexible in order to respond to varying demands.
There are numerous Lean practices and tools. Although it may not be an exhaustive list, many of these are examined below. It should be noted that one's imagination and creativity in solving problems is useful for identifying and designing Lean practices and tools.
Standardization
A standard is a rule or an example that provides clear explanation for an outcome. A standard is the current, best method. It serves as a benchmark to assess or judge alternatives and as such standards should always be changing to reflect achieved improvements. Standards also serve to make out-of-control conditions obvious.
Characteristics of effective standards include the following. First, they should be simple and specific, so that they are readily understood. Second, it is desirable for them to be visual to further reduce the possibility of misunderstandings. And, third, it must be recognized by all that they are to be followed. If five employees each doing the same task ignored the standard and did it his own way, there would likely be five different outcomes or variations.
Standards should have the following six points2:
Individual authorization and responsibility
Transmittal of individual experience to the next generation of workers
Transmittal of individual experience and know-how to the organization
Accumulation of experience (particularly with failures) within the organization
Deployment of know-how from one workshop to another
Discipline
The first point reflects that individuals have the obligation in their roles in the formal organization to follow standards. It further suggests that individuals must have the authority, or the power, to implement the standard to complete their assignment. This point should also include that when one possesses the responsibility and authority, one should be accountable for applying the standard as well. Namely, accountability is the state of being totally answerable for the satisfactory completion of a specific assignment. Points two through five suggest that workers must be involved in sharing their knowledge. It should be shared with others as well as making it part of the organizational history. This includes mistakes as they are learning opportunities for all. Mistakes are costly. The impact of the mistake can be lessened if it can prevent others from making the same mistake. The last point of discipline refers to the fact that standards must be requirements that are to be adhered to religiously in order to reduce variation.
Although standards refer to a current best method, standardization means achieving the expected outcome using planned routines. The act of standardization refers to developing, communicating (orally, written, and visually), utilizing, improving, and sharing standards throughout the organization. The development of standards (and improvements) is based upon the scientific method. This is a process of inquiry based on the formulation of a hypothesis (an expectation), capturing observable and measureable evidence to test the hypothesis, assessing the validity of the evidence, and drawing conclusions to accept, reject, or modify the hypothesis to guide future standards.
An integral element of standardization is the use of Standard Work Instructions (SWIs). An SWI is simply a set of specific instructions that allow tasks to be completed in a consistent, timely, and repeatable manner. It is desirable for SWIs to be written and accompanied by a visual portrayal depicting the sequential nature of the work to be completed. SWIs should be posted at or near the location of the task to be performed.
Single Minute Exchange of Dies (SMED) or Quick Changeover
The concept of Single Minute Exchange of Dies (SMED) refers to quick tool changeover times between production orders. The phrase ‘single minute’ does not mean that all changeovers and startups should take only 1 min, but that they should take less than 10 min, or a single digit. This rapid changeover is a key to reducing production lot sizes and improving flow, and it is an absolute prerequisite to achieving an objective of system flexibility.
The SMED concept was conceived in the mid-1950s.3 In an environment producing a diversified group of commonly ordered items, it was observed that bottlenecks were caused by long tool changeover times that drove up the production lot sizes resulting in large inventories. Traditionally, if set up times were long, lot sizes for these commonly ordered items were large in order to achieve economies of scale. This preference spread set up costs over a greater number of units, thereby driving unit costs down.
If set up times could be reduced, the consequential lot size and inventory would also be reduced. Three common implementation techniques promote SMED.4 These three steps include the following:
Separate internal set up activities from external set up activities. This is the most important step. One should perform external set up activities for the next production order, while the current production order is being processed. Internal set up activities are those that can be performed only when the machine is stopped. External set up activities (e.g., prestaging the required tools for the next order) for the subsequent order can be done, while the current order is being processed.
When possible, convert internal set up activities to external set up activities. Examples include preheating parts and use self-aligning jigs.
Streamline all aspects of the set up task, both internal and external activities. Several practices can be followed to achieve streamlining, including:
Standardize function, not shape; for example, standardized or common parts, standardized assembly tools and steps, and utilization of common tooling can all reduce set up times or the number of setups. For example, use multipurpose die sets.
Use functional clamps or one-turn attachment devices that are faster than threaded rods for hold downs (or eliminate fasteners altogether if possible).
Use standardized jig plates.
Adopt parallel operators to avoid non-value-added activities such as walking, while performing setups.
Eliminate adjustments. This reduces variation and results in first pieces being good pieces.
Lastly, mechanization of die movements, tightening, loosening, and adjustments may permit further set up time reductions.
After SMED improvements have been achieved, the next challenge, which is closely associated yet more difficult, is One-Touch Exchange of Dies (OTED), which refers to performing set up changes in less than one minute. The concept suggests that as long as a changeover is necessary, it should be performed with a single motion. The ultimate objective for SMED and OTED is one piece flow, or single unit production lot sizes.
Value Stream Mapping
Value stream mapping (VSM) is best understood as a visual technique for depicting the sequence of activities required to design, produce, and offer a good or a service as well as the necessary information and support flows. The tool entails creating a visual portrayal of the current state of a process or system that includes current cycle times, down times, inventory levels (raw materials, work-in-process, and finished goods), material flow paths, and information flow paths. The depiction of the current state is intended to guide the user's efforts toward determining a desired or ideal future state and possible implementation plan. Although the scope of a VSM can be small, it was originally intended to be a broader tool than process mapping as it is often used to portray an entire supply chain's value stream.
Although VSM is derived from Gilbreth's process mapping approach, but the development of VSM in its most popular form is credited to the Toyota Production System (TPS) and was first popularized in 1988.5 Various VSM symbols are used to portray the placement of an order by a customer, activities within a supplier order processing system, relaying of information through to a vendor, and subsequent value-added order process activities (e.g., fabrication, assembly, and distribution), as well as any and all non-value-adding delays (e.g., setups, queues, material movements, and storage).
Many VSM symbols are used to portray the material and information flows. These symbols are often divided into four groups: (a) process, (b) material, (c) information, and (d) general symbols. Some of the more common symbols along with a symbol interpretation are shown in Table 5.1.
Table 5.1. Common VSM Symbols
| VSM Process Symbols Symbol | Interpretation |
|---|---|
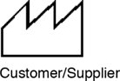 | This icon represents the supplier when in the upper left; the usual starting point for material flow. The customer is represented when placed in the upper right; the usual end point for material flow. |
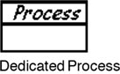 | This icon is a process, operation, machine, or department, through which material flows. Typically, to avoid unwieldy mapping of every single processing step, it represents one department with a continuous, internal fixed flow path. In the case of assembly with several connected workstations, even if some WIP inventory accumulates between machines (or stations), the entire line would show as a single box. If there are separate operations, where one is disconnected from the next, inventory and batch transfer, between multiple boxes would be used. |
 | This is a process operation department or work center that other value stream families share. Estimate the number of operators required for the value stream being mapped, not the number of operators required for processing all products. |
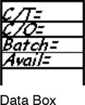 | This icon goes under other icons that have significant information/data required for analyzing and observing the system. Typical information placed in a Data Box underneath FACTORY icons is the frequency of shipping during any shift, material handling information, transfer batch size, demand quantity per period, and so forth. Typical information in a Data Box underneath PROCESS icons vary, but may include the following: C/T (Cycle Time) = time (in seconds) that elapses between one part coming off the process and the next part coming off; C/O (Changeover Time) = time to switch from producing one product on the process to another; Uptime = percentage time that the machine is available for processing; EPEI (Every Part Every Interval; a measure of production rate/s for the time interval); Number of operators = use OPERATOR icon (shown as the third to last symbol in Table 5.1) inside process boxes; Number of product variations; Available capacity; Scrap rate; Transfer batch size (based on process batch size and material transfer rate). |
 | This symbol indicates that multiple processes are integrated in a manufacturing work cell. Such cells usually process a part family or a single product. Product moves from process step to process step in small batches or single pieces. |
| VSM Material Symbols | Symbol Interpretation |
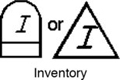 | These icons show inventory between two processes. While mapping the current state, the amount of inventory can be approximated by a quick count, and that amount is noted beneath the triangle. If there is more than one inventory accumulation, use an icon for each. This icon also represents storage for raw materials and finished goods. |
 | This icon represents movement of raw materials from suppliers to the receiving dock/s of the factory. Or, the movement of finished goods from the shipping dock/s of the factory to the customers. |
 | This icon represents the ‘pushing’ of material from one process to the next process. Push means that a process produces something regardless of the immediate needs of the downstream process. |
 | This is an inventory store or ‘supermarket’ where a small inventory is available and one or more downstream customers come to the supermarket to pick out what they need. The upstream work center then replenishes stocks as required. When continuous flow is impractical, and the upstream process must operate in batch mode, a supermarket reduces overproduction and limits total inventory. |
 | Supermarkets connect to downstream processes with this ‘pull’ icon that indicates physical removal. |
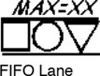 | First-In-First-Out (FIFO) inventory. Use this icon when processes are connected with a FIFO system that limits input. An accumulating roller conveyor is an example. Record the maximum possible inventory. |
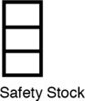 | This icon represents an inventory buffer (or safety stock) against problems such as downtime, to protect the system against sudden fluctuations in customer orders or system failures. Notice that the icon is closed on all sides. It is intended as a temporary, not a permanent storage of stock. |
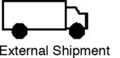 | Shipments from suppliers or to customers using external transport. |
| VSM Information Symbols | Symbol Interpretation |
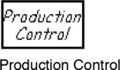 | This box represents a central production scheduling or control department, person or operation. |
 | A straight, thin arrow shows general flow of information from memos, reports, or conversation. Frequency and other notes may be relevant. |
 | This wiggle arrow represents electronic flow of information or data. It can indicate the frequency of information/data interchange, the type of media used, for example, fax, phone, and so forth, and the type of data exchanged. |
 | This icon triggers or pulls production of a pre-defined number of parts. It signals a supplying process to provide parts to a downstream process. |
 | This icon represents a card or device that instructs a material handler to transfer parts from an inventory store (e.g., a supermarket) to the receiving process. The material handler (or operator) goes to the supermarket and withdraws the necessary items. |
 | This icon is used whenever the on-hand inventory levels in the inventory store (e.g., a supermarket) between two processes drops to a trigger or minimum point. When a Triangle Kanban arrives at a supplying process, it signals a changeover and production of a predetermined batch size of the part noted on the Kanban. It is also referred as ‘one- per-batch’ kanban. |
 | A location where kanban signals reside for pickup, for example, a simple sign board. |
 | This icon represents a pull system that gives instruction to subassembly processes to produce a predetermined type and quantity of product, typically one unit, without using a supermarket. |
 | This icon is used to represent production leveling over a period of time. |
 | Scheduling using MRP/ERP or other centralized information planning system. |
 | Gathering of information through visual means, for example, Gemba walk. |
 | This icon represents verbal or personal information flow. |
| VSM General Symbols | Symbol Interpretation |
 | This icon is used to highlight improvement needs and plan kaizen workshops at specific processes that are critical to achieving the Future State Map of the value stream. |
 | This icon represents an operator. It shows the number of operators required to process the VSM family at a particular workstation. |
 | Other useful or potentially useful information. |
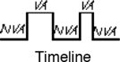 | The timeline shows value-added (VA) times (cycle times) and non-value-added (NVA) times. Use this to calculate lead time or throughput time. |
One of the more important symbols is the timeline symbol depicting value-added (VA) times and non-value-added (NVA) times. It often reveals common wastes due to queue times, material movements, long set up times, storage times, inspection times, all of which are NVA activities as viewed by the customer. It should also be noted that the user is encouraged to create new symbols for specialized applications.
While creating the current state map, it is best to involve a diverse team representing the affected area. Involve affected customers, suppliers, or both to get a complete picture if the VSM extends outside the transformation process. Use averages for process times. The essential question to ask when assessing the current state is whether an activity adds value from the customer viewpoint. Remember a few simple rules: constraints are good places to examine closely, simple solutions are often better, identify and exploit bottlenecks, and maximize the use of human resource capacity.
Kaizen and Kaikaku Events
VSMs are useful for conducting kaizen and kaikaku events. Remember, kaizen roughly translates as good (zen) change (kai). A kaizen event is typically a short-term project targeted to find localized process improvement over a period of about 3–5 days. The common objective of a kaizen event is incremental minor change(s).
Kaikaku events possess a larger scope. This is typically true for the duration as well as the extent of process involvement. Kaikaku events have a process focus, but they are typically aimed at finding radical change. Kaikaku events may entail introducing new knowledge, new strategies, new approaches, new production techniques, or simply new equipment.
Takt Time
Although attributed to German aircraft engineers in the early 1930s with Mitsubishi bringing the concept back to Japan, the TPS embraced takt (tact) time as a tool to improve assembly line efficiency. Takt time refers to the drum beat of the system, the beat that should set the pace or speed for operations. It is derived from the German word taktzeit that translates as cycle time. Simply put, it is the maximum time allowed per unit to produce a product in order to meet demand.
The goal behind establishing a takt time is to match output speed (total cycle time) with customer demand. Ideally, system output should correspond with demand. In its simplest form, takt time (T) per unit would be determined as:
T = 5 work time available per day/units of demand per day
T is subsequently used to establish the speed or pace and to balance workloads of transformation processes.
It should be evident that an important issue to address, while establishing takt time, is the performance of non-value-added activities. As noted above, using a Lean tool microscope better enables the examination of connections and flows between resources. This is critical for achieving waste reductions. In low-volume batch transformation processes, it is not uncommon for non-value-added activities such as material movement time, queue (wait) times, storage times, set up times, and inspection times to exceed 70% of the total throughput time. Any activity performed that is not valued by the customer takes work time away from performing value-added transformation activities. This actually increases the minimum possible value of T and, therefore, lengthens the possible response time for meeting demand.
Similar to takt time is pitch. Pitch indirectly refers to takt time but it makes an adjustment for container size. For example, if takt time is 1 min/unit and a container holds 10 units, then pitch is 10 min, the time required for a container to be produced and sent downstream. Both takt time and pitch time should correspond with demand.
Production Leveling and Balancing
This practice refers to producing at a constant rate over time as well as maintaining a constant ratio or balance among items being produced. It is also known as uniform plant loading, production smoothing, or by its Japanese counterpart heijunka. In any process, fluctuations in performance typically increase waste. This is because it becomes increasingly difficult to effectively utilize capacity provided by resources (equipment, workers, and inventory) that must be ready to meet demand as it occurs.
A simple numerical example can be used to explain the production leveling and balancing concept. Assume a company produces six items, products A–F, using a single process. Let's say over the course of a 5-day work week, the expected demands for the six items are 40, 80, 20, 30, 15, and 0 units, respectively. For a single 8-h shift, production leveling suggests using a ratio that reflects the relative demand values over the time interval and these values would remain the same each day of the work week. The rate of production for each item that would maintain this constant ratio over the entire 8-h interval would be 8, 16, 4, 6, 3, and 0 units, respectively.
Following production leveling and balancing, batches are made as small as possible in contrast to traditional mass production, where bigger is considered better. A more traditional mass production approach would produce 40, 80, 20, 30, 15, and 0 in single batches once a week or 8, 16, 4, 6, 3, and 0 units, respectively, in batches once per day, five times a week. The ability to justify small batch production rests on a firm's ability to achieve SMED because changeover or set up time indirectly controls batch size. The argument has always been based upon the notion of economies of scale. Namely, if it takes longer to perform a changeover, subsequent batch size must be greater in order to achieve a lower per unit cost. If a firm can achieve a lower changeover time and cost, then it should be willing to pursue more changeovers, because the objective should be to minimize total system cost that, for the workstation, is a combination of changeover costs and inventory costs. Although more changeovers promote higher changeover costs, if the time is lowered the increased number of changeovers may not greatly impact changeover costs. Meanwhile, lower batch size clearly reduces inventory costs. This can result in lower total system costs.
A heijunka box, a scheduling tool used to visually depict what to produce, when to produce it, and how many to produce, may further explain the concept. This tool is commonly divided into a grid of rows and columns creating a set of pigeonholes receptacles. Each row of the box represents a particular product, while each column of the box represents a specific time period such as an hour of the day or day of the week. Colored cards (kanbans) representing individual jobs are placed in the heijunka box to provide a visual representation of the upcoming production runs. Figure 5.1 depicts a production plan for the six items (A–F) over an 8-h shift.
In Figure 5.1, the heijunka box is divided into eight columns of equal lengths representing the hours in an 8-h shift. The plan shown depicts building an A and then two B's along with a mix of C's, D's, and E's in each of the 1-h intervals. The simple repeating patterns of kanbans in each row and multiple columns smooth planned production for each of these products. The Heijunka box allows visual control of a smoothed production schedule. This helps to ensure that planned production capacity is kept constant thereby eliminating many issues associated with variable demand. Furthermore, the kanbans reflect downstream demands. So, the kanbans act to pull production out of the upstream workstations by authorizing upstream production.
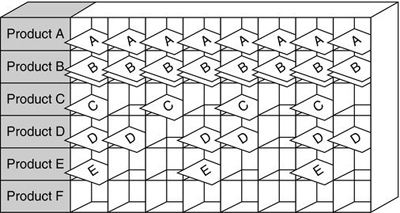
Figure 5.1. Heijunka box with kanbans
It should be noted, however, there is a significant difference between planning and executing. Ideally, production can easily be leveled when demand is constant over time. One would simply match capacity, or the planned rate of output, with the demand rate. In reality, demand varies and it is costly to vary capacity (people, machines, or inventory). Capacity is typically added or subtracted in chunks. Furthermore, it is difficult, if not impossible to know demand in advance and adding capacity may take significant time. As a result, there is often a mismatch between demand and capacity as shown in Figure 5.2. Because demand varies, it becomes necessary to either maintain underutilized capacity at times to meet demand, allow some demand to go unmet, or to absorb variations in demand with flexible capacity if possible.
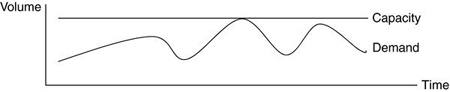
Figure 5.2. Mismatch between variable demand and level capacity
The ability of a company to level production is governed by the flexibility of capacity. This refers to the ability of the workforce and equipment to shift production as required or to the use of inventory to absorb demand variations. It is desirable for upstream processes to be flexible in order to offer the necessary response if downstream consumption varies its withdrawal rate in terms of timing, quantity, or both. Furthermore, the variance or amplification of demand will typically increase as demand passes further upstream. This variance in the demand amplification has often been referred to as the bullwhip effect. This effect is greatly exacerbated as demand is extended further upstream in the supply chain.
In response to demand fluctuations, the process must possess the flexibility to quickly expand or contract capacity as needed. Greater flexibility can be achieved through various means, including redeploying idle cross-trained workers, working overtime for short periods, maintaining minimal inventories, changing the cycle time pace of the process, or some other inventive means.
To prevent fluctuations in production, even in outside affiliates, it is important to try to keep fluctuation in the final assembly line to zero. One noteworthy alternative to production leveling aimed at achieving a lower variance in production is demand leveling. It is sometimes practiced to smooth out demand variations. Demand leveling is the deliberate influencing of demand itself to achieve a more predictable pattern of customer demand. Influencing demand may be achieved by manipulating the product offering, offering price incentives, advertising, or some other means. However it is accomplished, the idea is to shift demand to off-peak periods, thereby enabling a firm to reduce demand variance and the overall level of capacity needed to meet demand as it occurs.
Visual Management Techniques
There is an old adage that ‘a picture is worth a thousand words.’ Visual management techniques employed within a Lean Management system have the ability to convey a lot of information quickly. Furthermore, people remember information better when it is represented and learned verbally and visually.
The principal purpose of visual management techniques is to readily depict the current status or performance of the system in comparison with its expected performance and to signal the need for action. Deviations depicted suggest assigning the responsibility for conducting an investigation to find the cause that allows for corrective action to be taken and the permanent elimination of the cause.
The number of visual management techniques is only limited by one's imagination. Practice suggests several guidelines that should be adhered to, while using visual management techniques. First, the tool should clearly depict the current state of the process. Further, the current state should be depicted relative to the expected state. Various colors can be used to depict multiple state conditions.
Second, simpler is typically better. Visual management techniques do not require the use of sophisticated technology as technology is not a prerequisite. Rather, visual tools should be easily and quickly updated. These tools should engage the individual(s) close to the process and individuals who are responsible for maintaining the tool and correcting the process.
Third, these tools require discipline. The information must be captured on a regular basis over time. Information collected following a defined plan is more likely to depict patterns that reveal assignable causes of variation over time. This information must serve as the basis for taking corrective action. Namely, leadership must be committed to using the tool, it must be used as the basis to assign responsibility for undertaking an investigation, and it should be used for accountability regarding investigative results.
Fourth, smaller time increments between data capture may bring issues to light sooner. It is difficult at best to determine an appropriate time interval, but as a rule of thumb, established and stable operations should use a smaller or more frequent increment as variability is more likely due to assignable causes and less likely due to random causes. Similarly, if performance results are taken at more locations, it may be easier to pinpoint the source of variation.
Fifth, it is imperative that the data captured be useful. The process location, frequency of collection, and the extent of information collected must be determined. Data may reflect defects due to unmet specifications regarding characteristics such as length, width, height, weight, or volume. Data may reflect flow interruptions due to late materials, poor machine reliability, missing tools, unavailable operators, and so forth. Data may also reflect simple abnormalities. Regardless of the nature of the data, the information captured must be honest. It is easy for data to be distorted, biased, or skewed. We all know averages can be misleading. The metrics captured must be reliable for adjusting output for continuous improvement.
Last, it is often useful to couple audio signals with visual signals. This will reduce the likelihood that a single signal will be overlooked. Investigations conducted as a result of an abnormality depicted by visual management techniques commonly ask the ‘5W2H’ questions (Who, What, When, Where, Why, How, and How much) or ‘5 Why’s' to get to the root cause of the problem or variation. Numerous investigative tools are useful, including but not limited to benchmarking, brainstorming, value stream or process maps, Pareto analyses, cause-and-effect, or 6M (Man, Machine, Methods, Materials, Metrics, Mother Nature) diagrams, check sheets, scatter diagrams, run diagrams, and others. Many of these are discussed in Chapter 6.
There is an old idiom that ‘seeing is believing.’ A powerful tool that offers this capability is a Gemba walk. It refers to visiting the factory floor in order to see firsthand what is going on. A problem with seeing firsthand is that interpretation of what is seen may be difficult. There are various reasons for this, such as the work may be unfamiliar to the viewer, problems are not typically uncovered until after they have occurred, the work may be so complex making problem diagnosis or definition difficult, problems may be hidden as teams may be comprised of friends and colleagues, distinguishing between human error and random chance may be difficult, and leaders may see control as an ad hoc responsibility versus a continuous requirement. Nevertheless, Gemba walks allow leaders to see, provide team members' access to leaders, and demonstrate leader involvement in improvement.
A3 Problem-Solving Report
The term A3 is derived from the paper size used for the report, which is the metric equivalent to 11″ × 17″ paper. Similar to VSM, the development of the A3 as a tool has been attributed to the TPS. The A3 is commonly used in conjunction with VSM. Whereas the VSM's view is aimed at a higher-level value stream, the A3 offers a structure that always begins by defining the issue from the detailed customer's perspective. The A3 problem-solving process represents a structured approach to help people engage in collaborative, in-depth problem solving. It drives problem-solvers to address the root cause of problems that surface in day-to-day work routines.
The A3 problem-solving approach suggests a stepwise orientation. Figure 5.3 shows a sample A3 template, and a common 6-step A3 problem-solving procedure is outlined below.
Identify the problem or need.
Observe the process first hand, involve local workers to explain and document the current state preferably with a visual depiction, quantify the magnitude of the problem, and identify ideal state to be targeted.
Conduct root cause analysis to identify problem source.
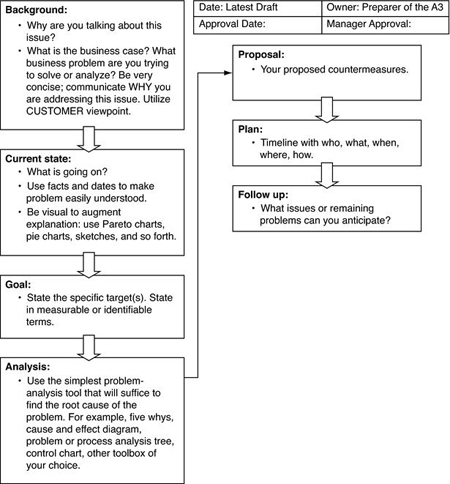
Figure 5.3. Sample A3 template
Devise detailed plan consisting of alternative solutions to address root cause(s) and identify preferred solution alternative. Planning facilitates accomplishment, so it should address the 5W2H (Who, What, When, Where, Why, How, and How much) questions. Namely, it should address the individual(s) responsible for each task, the tasks that need to be done to get the solution(s) in place, due date(s), affected location(s), an expected target condition to be realized that addresses benefits to be achieved, standardizes the new tasks in written and preferably visual fashion, expected costs to be incurred, and it should attempt to anticipate remaining issues or future problems. It has been suggested that the plan specifies work outcomes, content, sequence, and tasks; creates a clear, binomial connection between source and destination of workflows; and eliminates possible cycles or loops, ‘workarounds,’ or delays for inferior outcomes.
Implement and test plan.
Monitor, collect performance data, and iterate back to step 1 if necessary.
Workplace Organization: 5S's
Workplace organization, or the 5S's, refers to a set of sequential steps designed to improve efficiency, strengthen maintenance, spotlight the emergence of issues, and to promote continuous improvement.6 The sequential 5S steps are often identified (with their Japanese counterparts) as: sorting (seiri), straightening (seiton), sweeping (seiso), standardizing (seiketsu), and sustaining (shitsuke). These five sequential steps are explained below.
Sorting (Seiri) refers to eliminating anything unnecessary in the work space. This includes tools, parts, and instructions. Only essential items are kept in easily accessible and typically designated work space places. Everything else is stored in remote locations or discarded.
Straightening or setting in order (Seiton) suggests there should be a place for everything and everything should be kept in its place when not in use. The place for each item should be clearly identified or labeled. For example, tool cribs often accomplish this with shadow boards. Items should be arranged in a manner that promotes efficient workflow, with equipment used most often being the most easily accessible and each part, tool, piece of equipment, or supply source should be kept close to where it will be used. Knowing where items are kept reduces searches, while promoting traceability and productivity.
Sweeping, shining, or cleanliness (Seiso) refers to keeping the workplace neat and organized. At the end of each shift, clean the work area and be sure everything is restored to its place. This makes it easy to know what goes where and ensures that everything is where it belongs. A key point is that maintaining cleanliness should be part of the daily work, not an ad hoc activity undertaken only when things get too messy. Keeping the workplace clean will spotlight problem identification earlier as problems typically suggest a mess such as a machine fluid leak.
Standardizing (Seiketsu) refers to consistent and standardized work practices. All work stations for the same job should largely be identical. All employees doing the same job should be able to work in any station with the same tools that are in the same location in every station. The benefit for this is variance reduction. Team members must understand and value the benefit for doing work following company standards rather than their own way.
Sustaining the discipline (Shitsuke) suggests the previous four steps must become habitual. It is often noted by practitioners that this is the most difficult step as it requires discipline to maintain. People seemingly find it easy to slide back into old habits.
Spaghetti Diagrams
A spaghetti diagram is visual flow charting tool that uses a continuous line tracing that depicts the flow of work. It is used to depict both value-added and non-value-added flows. There are a couple of simple rules for its use. First, it is typically hand drawn taken from observations over a period of time. Second, it is not necessarily drawn to scale. It is intended to simply represent material or worker flow paths to promote the elimination of non-value-added movements. It is often used in conjunction with 5S projects.
Cellular Manufacturing
Cellular manufacturing is based upon the concept of group technology, which seeks to take full advantage of economies of scale offered by part similarity. The goal of cellular manufacturing is to achieve greater flexibility to produce a wide variety of lower demand parts or products, while still maintaining the high productivity and lower unit costs of large scale production.
Group technology commonly examines parts for similar shape characteristics. Similar shapes may imply similar processing requirements. Similar processing requirements may translate into reduced or minimal set up changes when switching from one part to another in the family. This presents the economies of scale and provides the greater demand volume through a family that justifies moving the equipment into the cells.
More commonly found in low to moderate volume batch manufacturing environments, cellular manufacturing groups the machines necessary to produce an entire family of parts in close proximity. Cells are typically U-shaped or C-shaped. An example is shown in Figure 5.4. You will note that the VSM symbol depicts an operator, while lighter colored arrows depict material flows and darker arrows depict operator movements.
This U-shaped cell configuration allows an operator to start and finish work in virtually the same location, thereby eliminating movement. This design offers major advantages in greatly reduced material flow distance and time, reduced set up time, reduced inventory levels, and cumulative lead times. The U or C shape also fosters greater communication as workers are nearby one another.
It is common to design the flow to occur in counterclockwise manner. This direction keeps employees' dominant hand in the direction of arriving material as most people are right-handed. It is also possible to vary cell output in the form of increasing or decreasing the number of cell operators as demand warrants.

Figure 5.4. U-shaped or C-shaped manufacturing cell
Total Preventive Maintenance
Total Preventive Maintenance (TPM) is a process developed for improving productivity by enhancing the likelihood equipment resources will be available when needed. TPM has basically three goals: zero defects, zero equipment failures, and zero accidents. If maintenance is done properly, uptime will improve, as will overall equipment effectiveness (OEE) (how well equipment performs relative to design capacity during the periods of scheduled production).
Although TPM has been practiced for many years, it got firmly established in Japan during the 1950s. At that time, Deming and other individuals demonstrated the application of statistical methods for monitoring and controlling processes to ensure that they operate at full potential to produce conforming products.7
An important objective for a TPM program is to provide the machine operator with the training for performing much of the routine, ongoing maintenance, and problem detection capability. Activities such as routine adjustments, cleaning, and lubricating are simple examples. TPM goes further by training workers to use senses including feeling, seeing, hearing, and smelling for anomalies such as vibrations, heat, breaks or cracks, bangs, smoke, and so forth. The intimate knowledge the machine operator acquires during operations along with the training affords the operator a keen ability to detect impending issues or decreasing quality. Coupling the maintenance capabilities of a machine operator with a preventive maintenance team responsible for activities such as predictive maintenance and extensive overhauls turns TPM into more of a proactive approach that aims to identify potential downtime issues as soon as possible and prevent them from occurring.
Wellness Programs
More recently, wellness programs have recognized that machines are not the only valuable resource that needs regular maintenance. The most valuable resource of any enterprise is its people. This resource requires regular maintenance as well as human resources must be available when needed. Wellness programs are employee-centered programs featuring proactive personal fitness programs, including physical examinations, substance abuse and group counseling, and individualized diet and exercise programs. Wellness programs have been very effective in improving employee productivity, while reducing absenteeism and health care costs.
Because wellness programs are a more recent development than TPM programs, cost/benefit evidence demonstrating their value is limited. One example of a wellness program demonstrating benefits has been in use in Oakland County, Michigan since 2007. Its program consists of health surveys, risk assessments, blood pressure screening, glucose tests, nutrition and exercise classes, as well as smoking cessation classes. After 4 years, the program is providing measureable results. The year 2009 saw a 12% decline relative to 2008 in health insurance costs for the county.8 Also, during 2009, the voluntary program accounted for 56% of the employees. Like many Lean initiatives, success has encouraged greater participation.
Employee Cross Training
Since Lean is based upon improvement through change, it is imperative that leaders invest in team members' training, education, and skills. This includes cross-training, or capability of a team member to perform a variety of tasks. Cross-training promotes benefits to the organization including enhanced flexibility and greater idea generation.
Recognition that the most important asset of any firm is its employees necessitates investing in the capabilities of this asset. Leadership must promote, encourage, and actually involve itself in the process for improving education and skills through continuing teaching, learning, and training. An organization that can effectively build greater capabilities into its people is more likely going to be able to produce quality in its products and services.
Cross-training offers employee benefits as well. Job enrichment (vertical job expansion that includes additional tasks offering resulting in more control and responsibility) and job enlargement (horizontal expansion of the job that includes additional tasks on the same level of skill and responsibility) offer employees the opportunity to learn new skills, enhance motivation through greater employee value, and combat boredom.
Ergonomics
The field of ergonomics contributes to important Lean practices. It is concerned with safety and the ‘fit’ between people and their work. It takes account of the worker's capabilities and limitations in seeking to ensure that tasks, equipment, information, and the environment suit each worker. The most important ergonomic risk factors are posture, force, and repetition, all of which depend on workplace design. Ergonomic injuries comprise more than 50% of all workplace injuries in North America.9
The International Ergonomics Association divides ergonomics broadly into three domains: (a) physical ergonomics, which is concerned with human anatomy and delves into relevant topics such as working postures, materials handling, repetitive movements, lifting, workplace layout, as well as safety and health; (b) cognitive ergonomics, which is concerned with mental processes and mental workload among other relevant topics; and (c) organizational ergonomics, which is concerned with relevant topics that include work design, design of working times, teamwork, and quality management among other relevant topics.
The foundation of ergonomics appears to have emerged in ancient Greece. Evidence indicates that the Hellenic civilization in the 5th century BC used ergonomic principles in the design of their tools, jobs, and workplaces.10 The TPS also uses ergonomic principles. The TPS philosophy suggests ergonomics is a precursor to delivering on objectives of quality, delivery, and low cost. Since ergonomics focuses on employee safety and eliminating waste in tasks such as repetitive movements, work design, and improving quality, it is clearly central to Lean practices.
Error Proofing: Jidoka, Poka-Yoke, and Andon
The principle of Jidoka essentially refers to a machine stopping itself when a problem occurs. It has been described as the combined effort of automation and workers to quickly identify errors and taking corrective action or automation with a human touch. The concept has been attributed to Sakichi Toyoda, the founder of Toyota Industries Co., Ltd. and its incorporation into an automatic loom weaving process.
Jidoka, or autonomous automation, relieves the need for the worker to continuously assess whether the operation of the machine is normal. Rather, this effort is required only when there is a problem alerted by the machine. This degree of automation implements some supervisory function by a worker that has also been referred to as self-checking or quality at the source. It engages both worker and machine capabilities in the assessment process. This typically means that if an abnormal situation is detected, the machine stops and the worker will stop the production line so that attention is focused on understanding the problem and eliminating the source of variation.
Defect production may be attributed to either random or assignable causes or variation. Random causes of variation cannot be eliminated. On the other hand, assignable variation such as human errors can be eliminated. Poka-yoke is a Japanese term that means fail-safe or error-proofing. The concept has been attributed to Shigeo Shingo. He observed that the human element of complex systems is a significant contributing factor to the production of mistakes or errors. In response, he developed the poka-yoke, a mechanism that helps to avoid (yokeru) mistakes (poka). Its purpose is to eliminate product defects by preventing, correcting, or drawing attention to human errors as they occur. It has also been described as baka-yoke or fool-proofing.11
More broadly, poka-yoke refers to any device or constraint purposefully designed to prevent a failure or incorrect outcome. It prevents a mistake from occurring or progressing downstream. It could be a device that allows only one possible outcome for an action; the single outcome being good that prevents mistakes from occurring.
There are two broad types of poka-yokes. The first being a warning poka-yoke that alerts an operator to an impending mistake. This does not prevent the error, but immediately stops the process when an error is detected. Many types of sensory measuring or detection devices can perform this function. The second type is a control poka-yoke that actually prevents the mistake from being made. The control poka-yoke does not allow a process to begin or continue after an error has occurred. It removes the response to a specific type of error from the hands of the operator. Examples of a control poka-yoke include jigs that hold successive products in an identical orientation or fixed position for processing or fixture pins that keep incorrectly placed parts from fitting properly. Good poka-yokes are simple, reliable, assure 100% compliance with specifications, provide immediate feedback, and are low cost.
An andon refers to a status display indicator used to notify management, maintenance, or workers of a quality or process problem. It is commonly either an audible signal such as warning horn or a visual signal such as a light. The signal is typically activated manually by a worker using a pull cord or button or automatically by the production equipment itself. The intent is to stop production immediately so that the issue can be corrected. Common reasons for manual activation of the andon are part shortage, defects, tool malfunction, or the existence of a safety problem.
5 Why's
The 5 Why's is a questions-asking practice used to explore the cause/effect relationships underlying a particular problem. Ultimately, the goal for asking these questions is to determine the root cause of a defect or problem.
The development of the 5 Why's approach has been attributed to Sakichi Toyoda. As noted above, he is also known for inventing the automatic weaving loom that employed Jidoka, or autonomous automation.
Total Quality Management
Like Lean Management, Total Quality Management (TQM) possesses a customer-driven philosophy for organization-wide continuous or ongoing improvement. It possesses a methodical foundation of numerous principles and tools, experimentation, scientific analysis, and problem solving. Although TQM often conjures up images of statistics and tools such as Pareto charts and control charts, it goes well beyond statistics and tools to incorporate components of leadership, culture, and teamwork as well. Similar to Lean Management, TQM should be viewed in a systematic manner with activities that eventually lead to enhancing customer value.
An examination of Lean Management practices and tools cannot be devoid of a discussion of TQM; the two are inseparable. The effective management of quality is discussed in Chapter 7. It too follows a systems approach. The discussion involves the execution of three interdependent planning stages (strategic quality planning, tactical quality assurance, and operational quality control and improvement), each comprised of various activities.
An examination of various TQM process improvement tools is included. Specific TQM tools examined in the chapter are benchmarking, brainstorming, process mapping, histograms and Pareto charts, cause and effect diagrams, check sheets, scatter diagrams, control charts and acceptance plans.
Summary
Reducing or eliminating variation in any system or process is a fundamental Lean principle. Lean practices and tools can help to reduce variation and waste as well as serve as a microscope for identifying improvement opportunities. In this chapter, numerous Lean practices and tools are identified and explained. It is noted that Lean practices are planning approaches used throughout the transformation process. Lean tools are specific analytical methods and problem-solving approaches. The focus of both is helping to identify causes of variation and waste that can eventually lead to variance reductions and improvement.
In addition to identifying and explaining Lean practices and tools, this chapter also identifies several key points for the use of Lean tools. These points are summarized below:
Typically, a keen understanding of the process current state is required in order to understand the source of variation prior to its reduction. Lean tools help promote a common understanding of the current system state as well as to help direct improvement efforts of stable processes.
Often the application point for Lean tools differs depending upon the environment. In lower volume, batch environments, the examination often focuses on connections and flows between resources. In higher volume, repetitive processes, the focus is typically on the productivity of the resources given a common takt time across system resources.
Not all Lean practices and tools are equally applicable in all types of environments. Differences between manufacturing and service environments limit the applicability of some Lean practices and tools. Consequently, flexibility is keen for services in order to respond to varying demands.
Lean practices and tools are limited only by one's imagination and creativity in solving problems. The variety of practices and tools is unlimited.