
Chapter 12
Workflow
Learn how to see. Realize that everything connects to everything else.
Leonardo da Vinci
Workload unpredictability is one of the most frustrating things that service teams face. Service breakages often come out of nowhere, forcing team members to drop everything to respond. These can lead to newly discovered problems that inevitably lead to yet more unplanned work, all of which then must be prioritized against current commitments. Any work that gets delayed as a result predictably leads to disappointment by the customer and frustration within the delivery team. Who wouldn’t become commitment-shy when faced with that?
IT teams with reactive service commitments do what any sensible person would under such circumstances: make as few hard commitments as possible, leave plenty of slack to accommodate for the unforeseen, and make change requests as painful as possible. This usually results in behavior like padding out project commitments and using governance processes to minimize the frequency and scope of any changes, particularly those that might lead to service breakages that can exponentially expand the volume of unplanned work.
Unfortunately, with the increasing demands of customers that push developers to release service changes at an ever faster rate, these strategies are no longer tenable. Instead, teams need to find better ways to understand the root causes that drive change requests and unplanned work. They also need to learn where potential hazards and friction points exist that might lead to effort and scheduling variability as well as rework. One of the best ways to do this is by looking at the flow of work itself.
In this chapter we will explore the best ways to structure your team’s workflow to better understand what work is moving through your ecosystem, how and where it flows, and how to better structure these flows so that your team can be better positioned to deliver production services that meet the needs of the customer.
Workflow and Situational Awareness

Figure 12.1
Workflow boards are only part of the situational awareness journey.
A work item is more than something that someone has to perform. It symbolizes a believed need that must be fulfilled in order to meet one or more of the customer’s target outcomes. Understanding the way that work is created and defined and the route work takes as it flows through an organization can tell you a lot about the delivery capabilities of the organization’s teams and their overall health. This includes each of the larger themes in this book, such as:
How well the target outcomes are understood
The level of situational awareness to determine everything from where any gaps between the current conditions and the target outcome exist to the level and sources of risk in any proposed actions that might close them
Where delivery friction occurs, how much is encountered, and how well its causes are understood
How and how well any learning opportunities are captured and exploited
There are a number of useful patterns that can reveal far more about the deeper dynamics of each of these themes and how they affect the overall dynamics of the team. Some of the more obvious measures include the ratio of proactive to reactive work, the number of people and teams a work item needs to move through to reach completion, and even who can declare an item “done.” Some may even explore the common forms of dysfunction teams face, such as the number of rework cycles a work item goes through, the amount and types of unplanned work that the team encounters through a given cycle, and inaccuracies in work estimation.
However, while many IT organizations might be aware of these sorts of problems in their ecosystem, few bother to investigate deeply enough to uncover the underlying root causes. Most will, at best, put in place some superficial changes that address some of the symptoms.
One of the reasons for this breakdown comes from the way that most IT organizations think about and approach the problem of managing work. Let’s take a quick look at the two most common patterns to see what is happening and why.
Managing Work Through Process
Arguably the most common approach for organizations to manage the work that flows into teams is through formalized processes. Often these align to some official project or IT Service Management (ITSM) methodology, which provides extensive amounts of supporting materials for a wide range of processes, along with professional communities that can help with implementation details.

Figure 12.2
“Why does the release process require collecting garden gnomes?”.
While the ready-made processes and supporting materials of these methodologies are nice and convenient, they do come with a number of limitations. For one, they tend to focus people more on the processes and how to follow them than on how well the work moving through them helps customers achieve their target outcomes. I regularly encounter teams with extensively detailed change management processes that do little to effectively manage and track change, or heavily structured incident management processes that seem to do little to prevent future incidents or improve how they are handled. I see these backed by complex ticketing tools with detailed workflows that capture and move work through the team all while building extensive management reports. Yet every time, I find that it seems nearly impossible to dig deep enough to see and understand any useful workflow patterns and their causes.
Traditional process management is not the only place that suffers this process focus. Increasingly, I see Agile teams that have standups that do not coordinate work and retrospectives where nothing is learned or improved upon.
What makes all of this worse is that when real problems occur, the solution with a process-focused approach is to follow the process harder. So the result of an incident caused by a change usually will focus more on increasing the scrutiny and compliance to the change process and less on the dynamics behind the root cause for the incident.
This way of thinking aligns with the traditional assumption that all ecosystems are ordered systems where cause and effect are always clear and observable. In such a world, any failure is caused not by a breakdown of situational awareness but by poor execution rooted in insufficient compliance to process. Unfortunately, not all ecosystems are ordered systems. The reasons for this are discussed in depth in Chapter 5, “Risk.”
Managing Work Organically

Figure 12.3
“I manage work as organically as this service architecture!”
Another increasingly common pattern is to take the other extreme and avoid imposing any processes whatsoever. In this model the team is considered to be in the best position with their firsthand experience to structure their work. If they are left to self-organize in whatever way lets them get the job done, they will inevitably find the best structure for the situation.
For those accustomed to method-driven management, this model sounds like a scary recipe for failure. The primary problem with this approach is not the absence of a process, but that it is really easy for teams to forget to have a clear feedback mechanism to ensure information flow and cross-functional alignment.
Those who usually go down this path start in a small environment. Process can often get in the way of getting the job done. As context and situational awareness are within easy reach of everyone, this approach can work rather well to start, given the right interpersonal relationships.
As an environment becomes larger or more dynamic, however, it becomes exponentially more difficult to stay on top of every aspect of every activity across the ecosystem. As a result, context and situational awareness degrade.
Without some active mechanism to ensure cross-functional alignment, team members often start to form a view inwardly focused on the part of the ecosystem they are most familiar with. This myopia fragments context and degrades the efficacy of decision making. With fewer obvious opportunities to share knowledge, knowledge islands start to form and workloads start to become uneven across the team.
The Tyranny of Dark Matter
Having the wrong focus when managing work is not the only way that situational awareness can break down. In fact, some of the most destructive ways that decision and delivery effectiveness can degrade often arise from those seemingly innocuous patterns that so often go ignored, creating what I like to call Dark Matter.
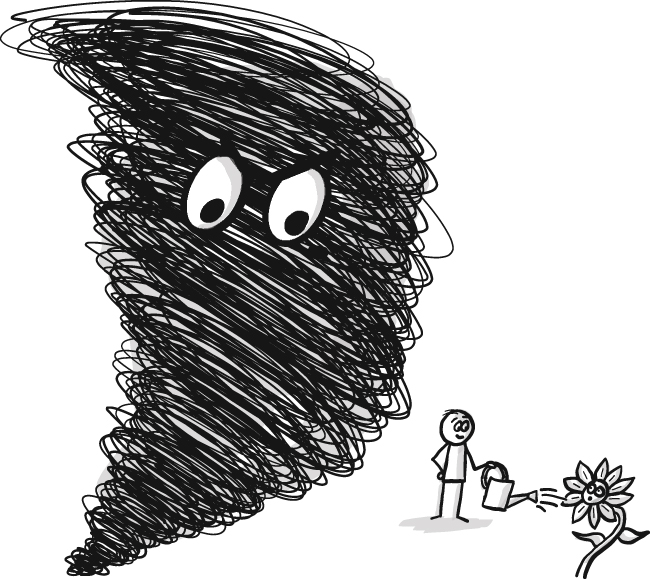
Figure 12.4
As Dark Matter grows, so does its dangerousness.
Dark Matter arises from two types of common conditions that occur in teams responsible for maintenance activities. The first are those tasks that only a small number of people have enough context and experience to know how to perform. The tasks might be relatively simple and might not even require much skill. However, they might prove impossible to perform without enough of the right context.
The second set of conditions is even more nefarious. These are the various pieces of work that no one bothers to capture and track. These tasks could be one-off individual events or something that unexpectedly crops up while performing another, larger activity. However, the most common are those activities that seem so small and mindless that they hardly seem worthwhile to record, let alone track. They include such things as service restarts, password resets, log rotations, small configuration tweaks, and various code and environment build and cleanup activities needed to keep things humming along. If it takes longer to fill out a ticket than to do the actual job, filling out the ticket might seem pointless to bother with, particularly when the team is busy.
However, these poorly known or rarely captured tasks introduce a layer of Dark Matter that is corrosive to situational awareness. That small or uninteresting task might be a clue to an important problematic pattern or a need for some improvement that has yet to be fully understood. Being hidden, there isn’t an opportunity to determine what triggers the need for the activity, let alone the benefit of performing it. As such, it can hide dangerous problems and bottlenecks. With no record of the source or number of these tasks, the quality and availability of information on hand to investigate subtly degrades with the passage of time.
Dark Matter leaches capabilities away from the team. Even if these tasks are individually small, they take time to do and can be disruptive to other, more challenging work. As a byproduct, these distractions often increase task switching that can introduce mistakes, accidentally lose context, and cause team members to fall into the trap of taking on too many things at the same time.
Dark Matter inevitably lurks in most service environments, particularly those where recording friction is high, such as organizations with rigid processes or difficult-to-use ticketing systems. The more difficult a system is to deal with, the more likely people are to work around it. This feeds a vicious loop that encourages the creation of ever more Dark Matter, all while creating a façade of capture and control.
The same is true with teams that cover multiple roles, such as development and operations. It is easy to miss the importance of capturing the task and its context while juggling work, particularly if it is one task of a large string and its importance may not be clearly apparent due to one’s own context shifting or personal viewpoint.
Another potential source of Dark Matter has to do with the tools themselves. As an increasing number of delivery and operations tasks become buried in stacks of tools, important information can be missed. This is especially true where the system of tools is cobbled together with little time invested in working out an effective way of capturing and reporting what the tools are doing in meaningfully contextual ways.
Learning to See the Disconnects in Action
Even if you are convinced that you and your team have any Dark Matter problem well under control, how easy is it for you to check the level of shared situational awareness in your environment? Would anything change if suddenly you had the power to see everything as it flowed through?
Let’s take a moment to try and visualize what is usually happening to a typical IT team. Even if you have complex processes and many layers of support, in the end work ends up hitting the team roughly, as illustrated in Figure 12.5.
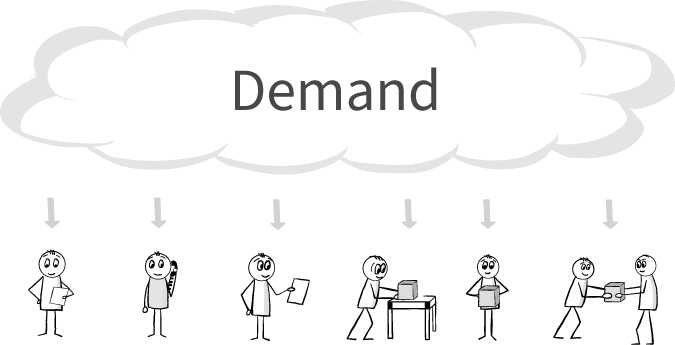
Figure 12.5
The happy delivery team in action.
When all is well, work drops down as a steady stream from a cloud of demand. Tasks might be coming through as an assigned ticket, a suddenly noticed issue, a drive-by request, or a system alert. Like most delivery teams they have only limited reach to pierce through the demand cloud, and this is only if they have both the time and management buy-in to do so. The urgency of the request and the real possibility of being interrupted by another, more urgent item encourage them to complete the task as quickly as possible, sometimes alone and other times in collaboration with others.

Figure 12.6
The unexpected interruption.
Inevitably, there are times when something happens that takes out a team member. We have all had something like this happen at one point or another. Sometimes it is a particularly difficult or poorly articulated task. Other times it might be one of those “boomerang” rework activities that bounce back and forth between the team member and someone else, or a task that is far larger than initially anticipated. Regardless of the cause, there is now a work item that is consuming at least one person’s time and effort that just won’t go away. It is as if a crate were to suddenly fall on you and prevent you from moving.
In a warehouse, often people will rush to help you. Unfortunately, in IT this sort of thing is rarely so visible. Even if someone happens to notice, many times the trapped team member will signal that they are okay. As IT professionals, our tendency is to indicate that it is just a bad day, and we’ll just power through this one like all the others. We even fool ourselves, often squirming under the crate thinking “I can do this!” Figure 12.7 illustrates how problems can begin to spiral out of control.
The problem with this approach, as we all know, is that work keeps coming. If we are particularly unlucky, it will start stacking up on the pinned-down team member. Sometimes this is caused by a lack of visibility of the problem, or tasks that make sense for only that person to do. Conditions continue to quietly deteriorate as long as the person remains stuck.
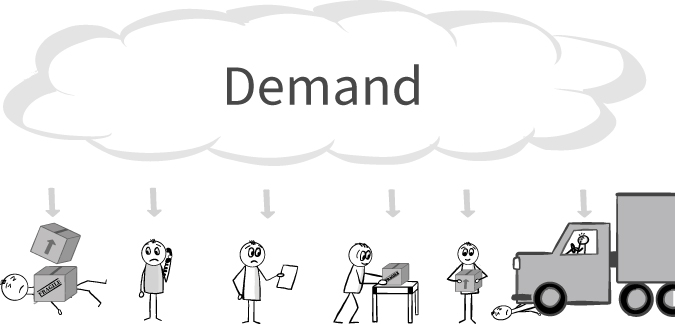
Figure 12.7
The chaos begins.
From the management perspective there might not appear to be any problem. The rest of the team might continue to get through work quickly enough, even if a sizeable percentage of them happen to become similarly stuck. The problem occurs when a far more visible constraint hits, such as a big incident or release that fully occupies the bandwidth of one or more team members. If the team is particularly unlucky, the event is more significant, such as an accident, illness, vacation, or even someone leaving the company.

Figure 12.8
The chaos spirals out of control.
With capacity already constrained, the team can find itself fighting to stay afloat. If a team member does depart, any unshared knowledge may be permanently lost. This is particularly hazardous if they were quietly performing Dark Matter tasks that didn’t happen to be captured or understood by others. This can leave a gaping hole in the team where work becomes lost or neglected. Many often refer to this as having a “truck count of zero.”
Work still continues to stream in. The work of the now buried worker is long overdue. With deadlines missed, activities dependent upon them begin to cause ripple effects that might make customers upset enough to complain. As these escalate through the management chain, a manager might decide to pull someone else off of their work to expedite the late work. That, of course, further reduces capacity, causing further disruptions to both work and the remaining workers who will have to rush around juggling tasks just to keep up.
Work that was being silently handled by the now departed worker will start to pile up. Anyone who has been in this situation knows that these work items will ultimately end up going in one of two directions. If the team is lucky, the work will be something others know how to do and someone will quietly request another person directly to perform it. The other route is the one that leads to the black hole.
Being effectively invisible, work items that go into the black hole will fester, quietly eroding the operational service. Inevitably, a failure or escalation will lead to their discovery, creating more expedited work. Those work items that someone manages to prevent from falling into the abyss are tossed onto the remaining team members. Without sufficient understanding of the amount of work and its value, there are few, if any, expectation changes. The increased load leads to more stress, long nights, heroics, inevitable mistakes, and disappointed customers. Unless demand shrinks or capacity increases considerably, morale will worsen as the team steadily becomes overwhelmed by problems.
While the graphics might be funny, the reality isn’t. These sorts of things happen all the time, even under the most ordinary of circumstances. Unfortunately, IT work by its nature is rarely so visual. Managers and team members alike seldom can see the dynamics on the ground effectively, let alone use such insight to better manage work, improve prioritization, or invest effectively.
Resolving Disconnects by Building Context
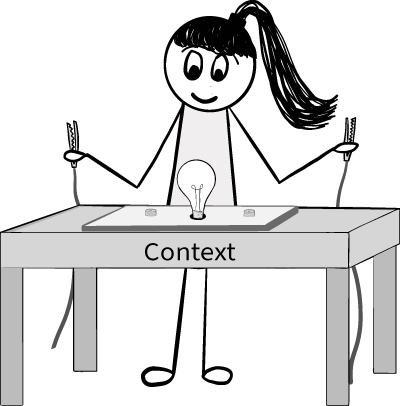
Figure 12.9
Lucy resolves the disconnect to illuminate the situation.
If situational awareness is so important, how can we find better ways to capture, visualize, and understand what is going on in our workflow?
The first step is to look at how contextual information flows across your organization. Effective information flow is necessary to ensure that the right level of context is available to maintain the situational awareness necessary to make accurate decisions that are needed to perform work effectively.
One useful place to start is by looking at how quickly and accurately information moves between people and teams that work and rely upon one another across the delivery lifecycle. Common ways that information flows slow or loses context include the need to involve managers or single individuals to communicate and align teams and work. Another occurs when teams rely upon different communication mediums. For instance, teams using different ticketing systems or fundamentally different ticketing flows that split related activities into separate buckets that are not clearly interlinked or exposed to other teams across the lifecycle can be particularly dangerous.
Poor communication flow between people or teams that have little to no regular in-person informal engagement can make it particularly tricky to build and maintain any sort of shared context. Anyone who worked remotely during the COVID-19 pandemic probably experienced some of these problems. A lot of incidental communication, whether it is in the hallways or over lunch, can help individuals not only share information but also surreptitiously pick up important context by observing how the other person responds to various situations. As familiarity increases, teams begin to “entangle” and build a detailed shared context that allows individuals to work effectively with one another with low communication overhead.
Communication methods are also important. They can take many forms, from emails and verbal conversations to issue-tracking tickets, slide decks, documents, and videos. The function of each communication method is to capture and convey information and context. Each method has its own advantages and downsides. The trick is to not only understand the pros and cons of each, but also find a means to bolster the way that information flows by favoring the methods whose downsides can be minimized in some way.
For instance, to avoid the ephemeral and untraceable nature of teleconferencing, teams often move verbal communication to chatrooms like IRC, Slack, or Teams, where not only can everyone catch what is going on, but communication can be captured and saved easily. Likewise, email suffers from being easily lost, misinterpreted, or unintentionally omitting people. Such context loss can lead to confusion or misalignment. More effective teams tend to favor a combination of interlinked chat, wikis, and tickets. Even things such as presentations and meetings can be recorded and put up online internally for reference in the future.
There are also a number of ways to link and cross-reference information across communication mediums in order to maintain context. For instance, chatbots can capture and relay build, test, and production health information, as well as capture and post chat conversations to wikis. Linking issue-tracking IDs into code repository check-ins, builds, test runs, and deployments facilitates easy cross-referencing of any activity with related artifacts and events throughout the activity’s lifecycle.
Spending the time to put the right methods in place to ensure information flow and context can prevent a great deal of confusion not only across teams, but also between new, remote, and vacationing members and their peers.
Visualizing the Flow
As previously discussed, the IT industry is hardly alone in having the problem of figuring out how to successfully coordinate activities among a group of people in a dynamically changing environment. Manufacturers have struggled with aligning people, raw materials, suppliers, and machines for decades. They are plagued with everything from broken machines, design defects, resource bottlenecks, supplier issues, all the way to customer demands for customized solutions. Top-down management through command and control processes in manufacturing these days can destroy a business through high defect counts and the creation of a lot of scrap.
To overcome these challenges, Lean manufacturers have come up with a system of visual signals across the manufacturing process to allow those on the floor to share situational awareness quickly and noninvasively. Tools and parts are engineered to ensure it is clear when they are not being put together correctly (poka-yoke), while stations, tool boards, machines, and carts are organized to not just make it easy for the worker to do the job but to make it obvious when something is not quite right. Lean manufacturers also came up with a very useful logistical control technique to ensure just the right number of parts are in just the right place at just the right time. It is called kanban.
Kanban means “signboard” in Japanese. Just like the “refill me” cards you might have seen at the back of displays in supermarkets, it provides a signal to notify an upstream supplier when additional material or work is ready to be brought over, or “pulled,” to a workstation. The signal might be anything from a physical card that sits in the material supplied to the work station to a specially colored container. It is positioned at a point that gives the upstream supplier enough time to resupply the station before all remaining material is exhausted.
The best way to think of kanban is as a chain being pulled from the end of the line as illustrated in Figure 12.10. In manufacturing that is usually where the customer is, as it is the customer who creates the demand.

Figure 12.10
Simple chain workflow.
The card triggers the station upstream to begin work. As it exhausts its supply of parts, a card signaling the need for replenishment appears and is sent to the supplier upstream to generate and send the next batch of parts, and so on as Figure 12.11 illustrates.

Figure 12.11
Walking up the chain.
Each station keeps just enough resources on hand to both satisfy demand and allow enough time for the station it depends on for supply to respond.
Although this sounds deceptively simple, when used in conjunction with Andon (a signal used to alert that something at a workstation is awry), this technique provides a rather sophisticated form of telemetry. This greatly improves the flow of communication needed to ensure there is enough effective shared situational awareness to maintain a sustainable flow across the entire manufacturing process. With this technique, no station begins until its immediate downstream customer makes a demand. The card or signal demand tells the provider exactly what the downstream “customer” needs, and is timed to arrive just at the moment that the customer requires it. This means that the placement of the card in the supply should be able to tell us the cycle time for each step, not only indicating throughput but pointing out potential bottlenecks across the delivery chain.
A variation on this technique has been adapted for software development by David Anderson. Anderson’s technique uses cards to represent work items and a simple board where the cards are posted to denote the state of each work item. Its simplicity and visual nature make it a very effective way to see the state and flow of work as it moves through to delivery. This helps both worker and interested party alike to see for themselves what is really going on. With no initially required significant changes to the way that people work, there are fewer potential barriers to thwart implementation.
These qualities have meant that interrupt-driven support and operationally focused organizations have increasingly adopted kanban-style boards to improve task and delivery workflow management. This technique has proven successful across a wide range of industries.
Unfortunately, as the technique is so simple, many try to create unnecessarily complicated flows and rules, and in the process lose track of its actual visual purpose. To help you avoid putting yourself in the same situation, the next section provides some important basics for you to consider when using a kanban-style workflow board.
Workflow Board Basics
The most important rule for creating a successful kanban-style workflow board is to keep everything about the board as simple as you can for as long as you can. Complexity, whether it is in building sophisticated state columns and swim lanes or investing in what you think is the ultimate workflow software tool before really understanding how work flows, will only add unnecessary noise that gets in the way of establishing the situational awareness you are trying to attain.
Begin with the following:
A whiteboard, wall, or large piece of white butcher paper on which you can draw or mark out lines with a pen or colored tape for use as the board
Cards or Post-it Notes/sticky notes to stick on the board
The size of the board needs to be big enough to fit all the cards in a way where they are all visible. Unless your team is large or has many hundreds of tasks going at any given time, something roughly a couple of meters long by a meter wide should be sufficient to start. You can easily adjust the size as needed, which is the beauty of starting with a simple physical board. Figure 12.12 illustrates the simple starting board.
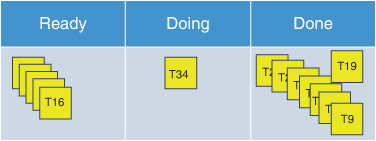
Figure 12.12
The starting kanban board.
State Columns
Workflow boards are typically laid out with a series of columns, as illustrated in Figure 12.13. Each column represents the current state of the task.

Figure 12.13
The state columns.
The rule with columns is to start with as few as possible. People have a tendency to think of all kinds of corner cases where additional columns could be useful. Remember that in the beginning, complexity is your enemy. It can obfuscate patterns that cause you to lose visibility of what is really going on. You should include additional columns only if you can show that they will be regularly used by most, if not all, people using the board, and that they demonstrate significant tangible value over the added cost of board complexity.
Most boards start with Ready, Doing, and Done columns, going from left to right. This simple layout works for the vast majority of cases, with little variation. The Ready column holds those items waiting to be worked on, the Doing column contains the work currently in progress, and the Done column consists of those items that have been completed.
Boards that include the full delivery cycle work similarly. They have a Doing column named for each phase. The main differences are with the Ready and Done columns. There is only one Done column at the end. Work that is completed in the middle of the board simply moves from the Doing state to the Ready state of the next required phase, such as Dev to Ready for Test. Figure 12.14 demonstrates this workflow board (where Dev, Test, and Deploy are Doing columns).

Figure 12.14
Full delivery cycle board.
State Columns for Operations
Operational work often entails a few phases that are fundamentally different than typical software delivery work and thus affect the layout of the board. Operational-specific boards sometimes need a couple of additions. The first is a Prequalified column, placed at the very left before Ready. The Prequalified column is to deal with many of the common quality problems associated with tasks that hit teams with operational responsibilities. For instance, tasks that say things like “move datacenter” are too large and opaque to be helpful. Such items need to be broken down into smaller, more manageable chunks before they can make their way to the Ready column. Similarly, a task that says “fix service” does not tell you what is wrong, whether it is urgent, or even if it is a production issue. The Prequalified column not only helps keep out of Ready the sort of garbage that might damage flow but also provides a spot to break work into reasonably sized pieces while gathering enough information to understand its priority and what needs to be done.
Having a Prequalified column can also provide a useful indication of how severe your task quality issues are. A high number of rejected tasks that hit it, or items that seem to take weeks to sort out, could mean there are disconnects upstream that need to be investigated. As you manage to tackle their root causes, you might find that you can eventually retire this column. Figure 12.15 demonstrates a workflow board with a Prequalified state column.

Figure 12.15
Operational workflow board.
As indicated in Figure 12.15, the second potential addition is a Scheduled column. This is used for work, such as maintenance events, that require a predetermined start date to coordinate resources and align with business and change requirements. The Scheduled column typically contains a master item with a date and/or time flag, with all the associated subtasks that need to be completed at that time. A good rule for this column is that all the work has been reviewed and is in sufficient shape to execute.
The Scheduled column is useful for resource scheduling. It can also be handy for spotting large peaks of work proactively, giving the team an opportunity to shuffle work around to reduce load.
If scheduled events are few and far between, or include only a small number of tasks with few required resources and little coordination, it is possible to do away with the Scheduled column and instead use color-coded task cards (covered in the upcoming “Task Cards” section) to indicate the special nature of the events. Practices such as automation, dark launching, and feature toggles can also help do away with much of the need for a Scheduled column.
Swim Lanes
Another configuration option for the board is to introduce horizontal rows, sometimes referred to as “swim lanes,” as illustrated in Figure 12.16.

Figure 12.16
Swim lanes.
Swim lanes are typically used to divide work into different service classes. This is done so that very special types of work can be visually separated from everything else through a dedicated lane. The best way to think of a swim lane is as a visual representation of a team’s bottlenecks. Each swim lane reduces both the capacity and flexibility within the team, creating resource islands that not only allow for misalignment across the team, but do so in a way that obscures the whole of what is trying to be accomplished. The more swim lanes, the more bottlenecks, and the more likely important work will get stuck behind a bottleneck.
For this reason, it is beneficial to keep the number of swim lanes to an absolute minimum. Most teams find that they can get by with no more than two swim lanes, one for normal work and the other for items that need to be expedited. The Expedite lane is for work that is so important that everything else needs to be dropped to take care of it. These work items hit suddenly without notice and, if not immediately jumped on and resolved, can severely damage the business. Few items should ever be placed in Expedite, and when something does, it should not be for very long The Expedite lane is organizationally costly and disruptive, and as such should only be used sparingly.
An expedited item should immediately include a “kaizen” (or improvement) retrospective review that occurs after the item has been handled. This acts as a good way to find out why the item was expedited, and figure out if there is any way to prevent it from happening again in the future. If the same event happens more than once, the problem needs to be escalated. The escalation of a task that happens more than once not only deters others from abusing the column to prioritize their work over everyone else’s but also ensures that senior management is aware of the problem to help support any remediation that needs to be put in place. Such rigor not only helps find solutions that eliminate the need for anything to be expedited, but also helps everyone appreciate the impact that an item has on interrupting flow.
Avoid Building Swim Lane Superhighways
A common temptation of teams is to build lots of swim lanes. Some of the most common reasons teams do this is to divide work types into separate categories—for instance, splitting web server and backend work, or database and networking tasks. This is particularly appealing to inflexible specialist roles. Other times teams will create one swim lane for each person in the team. Building lots of swim lanes should be fiercely resisted, as they have a nasty tendency to create internal bottlenecks and dysfunction for very little gain.
Consider the following real-world example to better understand the problem. Suppose that you need to deliver to a customer a new application or service that requires infrastructure services such as network, storage, and a database to be set up for it to run on. Many would be tempted to break each of those tasks up across a board that looks like Figure 12.17.

Figure 12.17
Team swim lane example.
This layout might seem sensible, but there are two very obvious problems:
Work isn’t balanced across the columns: If there are separate people tied to each column, the ones stuck handling the application work may find themselves overwhelmed, all while the storage team sits around with nothing to do. Even if the storage team does go to help the application team, should they drop their application work whenever something appears in their swim lane?
How do you deal with dependencies across swim lanes? This issue is far more challenging. For instance, everyone might be dependent upon an infrastructure ticket being completed before they can start working. There might be even more complicated flows between application, database, and storage where the interdependencies move back and forth between swim lanes. Not only is all of that lost, but so is clarity of the priorities and ordering of tickets across the swim lanes. Not only does managing that become a nightmare, but the value of the board itself becomes severely limited.
If work categories are important to you, you might be better off starting with a simple traditional board with two swim lanes and using colored tickets. That way, ordering and dependencies can be placed in the same swim lane, reducing confusion. Also, putting everyone in one swim lane reduces the potential for an “us vs. them” mentality within the team.
This isn’t to say that you should never add a swim lane. Although doing so seldom makes sense, if you do introduce an additional swim lane, you must be vigilant in monitoring the overall flow of work across the board to see whether the swim lane accomplishes your goals without introducing dysfunction. If you do add another swim lane, you should accompany the addition with an action plan to try to change the conditions that require the added lane. This might include such things as cross-training, automation, or simply eliminating the work. This can give you the flexibility in the future to remove the swim lane in case it is causing problems.
Task Cards
The final piece of the board is the task card, which is typically a 3×5 paper card or sticky note used to write a task on. The task card should contain some sort of identifying information, a creation date to help with tracking cycle time, and potentially a short description of the task. Color coding the cards based on what type of a task each represents can be very helpful. Categorizing the task card can be done any number of ways, from specific product or project streams to work or skill types. One successful configuration is color coding by types such as “projects,” “maintenance,” “production changes,” and “requests.”
As mentioned earlier, tasks should be broken down into reasonably sized and logical chunks. Optimally, these tasks should be reduced down to that which can be done in no more than a day. Why a day? The cadence of activity within the operational world is fast and ever changing. Items that can’t be done in a day tend to get interrupted and put aside for more urgent tasks, creating delays to that task and leaving partially done work lying around. Also, larger tasks tend to get stuck on the board, which reduces the sense that progress is being made, frustrating people and causing people to ask for status updates on the stuck item, a very common and nasty form of interrupt.
You’ll likely find that the majority of operational tasks tend to be small enough that any one person can handle several in a day. If you find this is not the case, however, you should dig in to understand why. At times you might find that your environment has become so complex and difficult to work in that it is in danger of becoming completely unresponsive to the business. Under these circumstances, it is imperative to find ways to reduce environment and task complexity. This might include accompanying technical or organizational friction that needs to be streamlined or removed.
Another important thing to think about when creating tasks is to ensure that there is some ability to learn from the activity by answering the following questions:
Why did we have to do it?
Are there ways to improve it or make it go away?
Is it clear what the target condition is behind it?
Did it uncover some problem that we need to investigate further.
You shouldn’t put any of this sort of information in the ticket unless it is particularly valuable. It is intended more to prime review and improvement activities later.
Preventing Dark Matter
Having to create a ticket for tiny tasks is still an issue with a workflow board. Most teams will find the friction to be far too high, even if they somehow overcome the challenge of being convinced of the value of capturing something so miniscule.
To reduce this friction, you should consider creating simple tally boards where each completed (Done) task becomes a simple mark on the board, as illustrated in Figure 12.18. You might have one board for restarts, another for password resets, another for simple cleanup jobs, and so on. The board can be as simple as a piece of paper on the wall next to the workflow board that anyone can add to. If you use a software tool, you can create a simple web page with a button that instantly creates and closes a ticket of that specific task type.
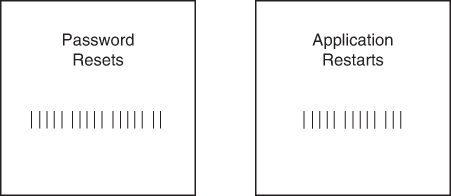
Figure 12.18
Example tally boards.
At the end of the week the tallies can be collected and added up. Numbers can help support further investigation or investment cases. Growth trends can provide an early indication of coming trouble. The most common result is that the team and management alike are surprised at the sheer size and scale of how often they have to deal with little tasks.
Using the Board
The way that the board itself works is simple. Each team member grabs a work item that is in the Ready column that they are ready to work on and moves it into the Doing column. They then perform the task. When the task is complete, they move the work item to the Done column, marking on the task card the date that the work was completed. They then grab the next item in the Ready column to work on and start the process all over again.
It is that simple.
There might be some occasions where tasks come in and go straight to the Doing column. These are usually important activities that are either being expedited or, more likely, an additional related and unforeseen item a person handling a task has noticed and wants to quickly record and take care of. While important activities should not have to wait for a long time in the Ready column, it is important for tasks to not be pushed into Doing by someone other than the person who is taking on the task. Pushed tasks can cause interruptions and work in progress to build unnecessarily.
Watching tasks moving across a board is surprisingly satisfying. Seeing the completed work building up in the Done column both gives a sense that work is being done and allows the team to get a visual indication of the sheer amount of work that they are doing. As many operational tasks end up being small, expect it to be a sizeable pile. The board also works as a great public relations tool that helps others see what and how much is happening. It allows the team to improve their perceived responsiveness to their customers as well as spot and defuse moments when the team is being overwhelmed. As most IT work is often invisible, seeing lots of items moving across the board provides a great visual representation of what is really happening.
Seeing the Problems
It is inevitable that work will get stuck in the Doing column. There can be all sorts of reasons for it. Sometimes work will get blocked by an external dependency. Other times items will be far more complicated than they first appear, consuming far more time than was expected. People can also get interrupted by other work or life matters, causing tasks to get held up. Then there occasionally is an expedited item that flies by that forces work to be momentarily dropped. The power of the board is that all of these eventualities should create a visible effect that everyone can see.
I have employed some tips to handle these eventualities to keep the board moving. The first is to track task cycle time. Often this will be obvious, with one or more cards sitting stuck in one place. However, if you have a lot of work flying through, you might want to consider marking when the work items entered into the Doing column. By timestamping tasks as they move into the Doing column and again when they are moved to Done, even just at the granularity of date, you can start to spot those that took longer than normal to make their way through the workflow. This can provide clues to help diagnose and solve problems that exist in your environment. You may also find value in noting when items first arrive in the Ready column as well if you suspect certain tasks are sitting without any activity being performed on them for too long.
Another common challenge comes from tasks that become blocked. Blocked work happens all the time within Operations. There will often be tasks with external dependencies, including waiting for a new software build, data to be loaded, or a supplier to deliver hardware. Blocked work creates subtle yet important disruption in flow. Understanding when blockages happen, as well as their causes, is very important. Work that is blocked can be tagged with a bright-colored marker, such as a neon-colored Post-it Note stuck on top of a physical board or a visible highlight for an electronic one. These make blockages stand out, bringing attention that can help with removing impediments.
Some people may be tempted to move the task to a “Blocked” holding column in order to declutter the Doing column. They often feel this makes blocked tasks more obvious and searchable. This may even be inevitable with an electronic tool.
The problem with having this extra column is that it adds visual complexity to the board. While it makes it easy to see the number of blocked tasks, you might miss important details regarding their state. Are they partway done or yet to be started? Blocked tasks can easily happen in either or both situations, such as in the previous example regarding application, storage, and database work. What is worse, you will inevitably see blocked tasks getting shuffled back and forth between columns. This breaks a common board rule that tasks should rarely move backward across a board. Tasks moving up and down the board in loops can give a false impression that more work is being completed than is actually the case. It also can break the continuity of tasks as they fit in the bigger picture of activities. This can make it more difficult to find the true nature of dependency chains and misordering of work pulled into the board. Figure 12.21 illustrates this scenario.
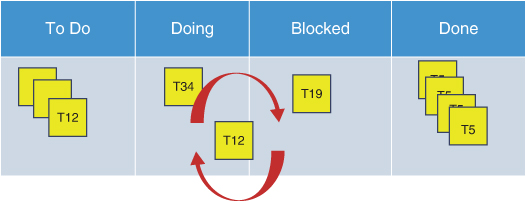
Figure 12.21
Blocked column state confusion.
If you are using a tool that makes it otherwise impossible to add a blocked state tag to a task, the holding column will need to be highly visible and carefully monitored. This is to ensure that everyone is aware of the situation to prevent tasks from being accidentally lost or left languishing, and to get help to remove any obstructions quickly.
Limiting Work in Progress
Busy teams that suffer from reactive work often face large piles of partially done work. Workflow boards will capture these piles, making them visible to everyone. In Lean circles this is referred to as work in progress, or WIP.
As many of us know WIP can build up for any number of reasons. The most common reason is task switching caused by reactive or poorly specified work coming in. Often teams get interrupted midstream through an activity, causing one to be dropped for another. Other times team members will try to multitask either when work items are being passed back and forth between teams or while waiting for a job to complete. If work is specified particularly badly, someone might even find that they have started a task only to have to kick it back so that it can be clarified or a raft of dependencies can be cleared before it can be picked up again.
Small amounts of WIP are inevitable. It is when WIP grows uncontrolled that it can wreck the flow of work in the team. Not only does work end up sitting around for a lot longer than it should, completion dates for WIP start to become increasingly unpredictable. As the pile of WIP gets larger, seeing and understanding what is going on becomes ever harder. All of this can make customers nervous, creating escalations that end up causing even more work to be interrupted, all while creating an unnecessary amount of extra stress on the team.
To thwart this problem, one tactic that many teams use is to put in place limits to the amount of work that can be in a progress, or Doing, column at any given time. These WIP limits are used to reduce task switching and work items from languishing partially done. Some teams go so far as to limit work items to one per person, eliminating the possibility of multitasking altogether.
Monitoring the amount of WIP is important. You may even find that conditions in your environment may favor establishing limits both to help protect the flow of work and to prevent team members from switching between several tasks. This can help shield the team from having to take on more work than they can sensibly complete.
Having overly strict WIP limits does introduce some significant dangers, however, especially in very dynamic operational environments. Many operational tasks are small by nature. It is not uncommon for someone to handle tens of 5 to 10 minute tasks while they are simultaneously monitoring a long-running task without encountering any problems. Enforcing strict WIP limits without first understanding the dynamics in the ecosystem could force more of the sorts of dysfunction that you are trying to avoid in the first place, whether it is in not recording work being done or creating yet another team division to shed everyday tasks to. Other problems such stringent WIP limits can create include having work repeatedly change state or be broken down into unnecessarily small pieces, all to work around the limit.
Maintaining situational awareness in an operational environment is far more valuable than limiting WIP. I tend to institute WIP limits only after we have noticed problematic patterns developing. More often than not I have found that they need to be enforced upon individuals with the propensity to take on far more than they can sensibly handle rather than seek help for the entire team. In those cases such tools can protect wannabe superheroes, often saving teams and careers.
The Limits of a Workflow Board
The board is a very important tool to put in place, but in fast-paced, dynamic environments it is not enough on its own. Without additional help, structure, and mechanisms to collectively better understand what is going on, work will continue to fly all over the place and chaos will continue. You will also need to work through other considerations, including how to keep everyone across the lifecycle aligned and improving in step with one another, as well as how best to handle the differences between delivery and operational work. Ignoring these considerations will result in only marginal improvements.
Managing the Board
The first important challenge to overcome is finding a way to keep the board and workflow maintained. While the board appears simple, it still requires some sort of oversight to ensure tasks enter the workflow correctly and do not get stuck for too long along the way. This includes not just stopping misprioritized work from jumping the queue, but also making sure tasks are an appropriate size and clarity. Without this, boards can become messy or inaccurately reflect what is going on.
Someone should also be regularly looking at the board holistically end-to-end to ensure that contextual information and subtle but important activity patterns are being captured and understood across the team. While managers can help, it is preferable to push this activity down into the team as a rotating duty as the Queue Master. Not only can the Queue Master accomplish these things far more effectively than a manager, but they can help prevent workflow from reverting to a push model while simultaneously strengthening the managerial escalation path for problems. Chapter 13, “Queue Master,” explains this Queue Master role structure in more detail.
Managing Flow and Improvement
The team needs a natural cadence of sync points to fix any alignment issues, learn from each other, and improve. The workflow board itself does not do this alone. It must be supported by establishing a regular cycle of sync points dedicated to this purpose. Without it team members inevitably begin to drift, creating conflict, confusion, and rework.
Another related issue is that workflow boards focus on flow, making it unclear for how project-related activities might fit alongside the everyday flow. While such items can be put into the boards like any other set of tasks, scheduling and dependency management are not completely straightforward. This is especially the case for larger teams that handle multiple projects and releases simultaneously.
Fortunately, there are some effective ways for overcoming each of these limitations that I have worked out over many years of experimentation. The first we will cover are around the cycle itself. From there we will work through the various roles that hold it all together.
Summary
The best way to manage work flowing in and through a delivery team is to optimize for shared situational awareness and team learning. And the best way to do that is to use visual workflow boards that expose the work moving through the system. This enables the team to see trends that might create bottlenecks or overload the team. Watch out for work management approaches that focus on generic processes and “best practice” as they have a tendency to create distortions that hide information, curtail learning, and cause process friction that encourages people to work outside the process to accomplish their goals. Small tasks, or “dark matter,” are also dangerous. These are tasks that require less effort to complete than what it takes to create a ticket to track it. The urge to not capture the task can hide problems and demand that consume team resources in ways that make it difficult to fix.
Workflow techniques such as kanban can help improve work visibility and awareness. It is also a great way to spot and remove bottlenecks and single points of failure, as well as to learn and improve.